Comparing the best BI tools: A Comprehensive Breakdown
Featuring: GoodData, Tableau, PowerBI, Looker, Sisense, AWS QuickSight, Domo, Qlik

Choosing the right BI tool is a bit like finding the perfect business partner — it needs to be smart, reliable, and help you uncover opportunities you might otherwise miss. Today’s top business intelligence (BI) platforms do more than just crunch numbers. They turn raw data into clear insights, helping teams make faster, smarter decisions. But with so many options out there, how do you pick the best BI solution for your business?
In this article, we’ll break down some of the best BI tools on the market — Tableau, Power BI, Looker, Sisense, Quicksight, and GoodData — and see how they stack up. Whether you’re focused on ease of use, AI features, or getting the most value for your investment, this comparison will help you find the right fit.
But before we begin, let’s recap…
1. What are BI tools?
Generally speaking, BI is the combination of strategies, technologies, and services used to transform raw data into valuable insights — the aim is usually to support better decision-making.
BI tools are software that helps companies manage BI-related processes. They turn raw data into valuable insights by connecting data sources, creating dashboards, and making sharing insights with teams easy.
2. Why is it important to choose the right BI tool for your business?
Choosing the right BI tool and centralizing your data in one accessible location is essential for several reasons:
- Decision-making can get a major boost with augmented analytics. By leveraging machine learning and natural language queries (NLQ), it automatically generates valuable insights, turning data into compelling stories with interactive visualizations. For this reason alone, augmented analytics is among the key features to look for in a modern BI tool.
- Productivity can be increased through the streamlining of processes and workflows, supported by multiple data source connectivity and the creation of analytic models. This includes the ability to centrally manage one version of the analytics, and the capability to connect a wide range of data sources.
- Reusability can encourage the efficient reuse of data and reports. Facilitated by a unified metrics store, the capacity to auto-deliver the user interface saves time and enables effortless replication of valuable insights and dashboards. This is further supported by an “as code” architecture and seamless integration with third-party tools for extensive analytics.
- Future-proofing capabilities ensure a company’s analytics solution is prepared for future data challenges, technological advancements, and further integration with third-party tools — ensuring long-term sustainability.
- The right BI tool can keep expenses in check while maximizing the value of your data analysis. The BI tool provider should be driven to continuously innovate and enhance the platform. Additionally, guaranteed security options and reliable customer support contribute to a comprehensive solution that adds value.
To effectively evaluate a BI tool, it’s crucial to identify the most important features. For a deeper dive into what to look for, check out our eBook, How to Choose the Best BI Tool. It offers detailed explanations of key capabilities that can help streamline your business.
3. Comparing the best BI tools:
Choosing the right analytics platform can shape your organization’s success — not just today, but for years to come. To help with your evaluation, the tables below compare key capabilities of the top BI and analytics tools on the market. For a deeper dive into each tool, check out these companion articles: AWS QuickSight alternative, Sisense alternative, Tableau alternative, Qlik alternative, Power BI alternative, and Looker alternative.
Architecture
 |  |  |  |  |  |  |  | |
|---|---|---|---|---|---|---|---|---|
| 100% Cloud-native (Docker & Kubernetes) | ||||||||
| Real-time analytics without feature limitations | ||||||||
| Exposed semantic data model as a shared service | ||||||||
| Open APIs, SDKs, and standard protocols usage | ||||||||
| Integrating with other BI and AI/MLs, developer notebooks, and other third-party applications | ||||||||
| All analytics definitions are declarative and they can be exported, imported, versioned, shared, and inherited. | ||||||||
| Super-high performance, intelligent analytics cache | ||||||||
| Integration with leading process management workflow software (or built-in feature) to drive decision intelligence | ||||||||
| Composable & reusable metrics | ||||||||
| Strong support for multitenancy |
Dashboards
| | | | | | | | |
|---|---|---|---|---|---|---|---|---|
| Easy-to-use self-service capabilities for non-technical users | ||||||||
| Intuitive drag-&-drop UI |
Embedding
| | | | | | | | |
|---|---|---|---|---|---|---|---|---|
| SSO & white labeling | ||||||||
| iFrame | ||||||||
| Javascript library to embed and customize anything you need as React, Angular, or Vue components | ||||||||
| Web components |
Scaling and Change Management
| | | | | | | | |
|---|---|---|---|---|---|---|---|---|
| Automated scaling to thousands of user groups — departments, teams, and clients | ||||||||
| Streamlined change management to roll out changes to thousands of user groups without breaking their customizations | ||||||||
| Possibility to change the underlying data warehouse without breaking your data model, metrics, or dashboards |
AI/ML features
| | | | | | | | |
|---|---|---|---|---|---|---|---|---|
| AI/ML options for all analytics user personas and skillsets | ||||||||
| Natural Language Query (NLQ) features like search, auto-complete, and in-dashboard chat | ||||||||
| One-click ML forecasting, clustering, and key driver analysis for non-Data Scientists | ||||||||
| Embedded Jupyter notebook integration | ||||||||
| Personalized insights surfaced directly from the “exploration” home page |
Data Integration
| | | | | | | | |
|---|---|---|---|---|---|---|---|---|
| Manual & Automated CSV upload | ||||||||
| Use your own data warehouse (e.g., Redshift, Snowflake, BigQuery, PostgreSQL) | ||||||||
| Industry-first, Analytics Lake stores analytics-ready artifacts such as metadata, semantics, and pre-aggregated metrics |
Data Security and Compliance
| | | | | | | | |
|---|---|---|---|---|---|---|---|---|
| End-to-end compliance & security — from data warehouse to visualizations | ||||||||
| SOC 2, ISO 27001:2013, CCPA, GDPR & HIPAA |
Deployment Options
| | | | | | | | |
|---|---|---|---|---|---|---|---|---|
| Fully hosted — managed in the cloud by the provider | ||||||||
| Self-hosted — deploy to Amazon Web Services, MS Azure, Google Cloud, or on-premises |
Pricing
| | | | | | | | |
|---|---|---|---|---|---|---|---|---|
| Easy-to-scale pricing — not priced per user (regardless of user rights), query, or session for external usage | ||||||||
| Low entry for teams or small businesses |
4. Where does GoodData stand in the BI and analytics market?
GoodData’s all-in-one platform is designed to go beyond traditional analytics and give businesses greater flexibility. Specific features that make it one of the most popular BI tools in today’s market include:
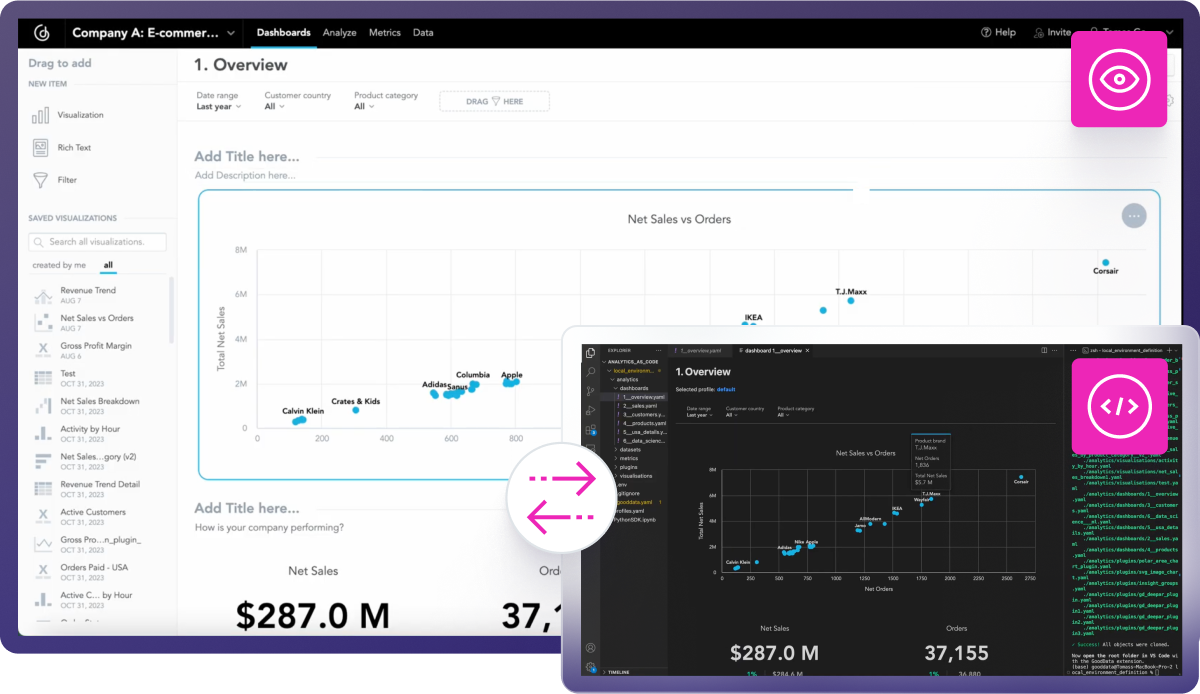
Analytics as Code
GoodData is one of the only tools to apply software development best practices to analytics, including CI/CD, version control, robust testing, and automation — making analytics workflows more efficient and accelerating business growth.
Everything can be done programmatically, making it a perfect fit for analytics engineers and teams who want to build repeatable workflows and apply coding principles to their data processes.
This Analytics as Code foundation also drives GoodData’s AI-powered analytics. Unlike traditional drag-and-drop tools, the platform seamlessly integrates with Large Language Models (LLMs), enabling them to interpret programming languages and code structures. This allows you to translate natural language into structured commands, unlocking new levels of automation and insight.
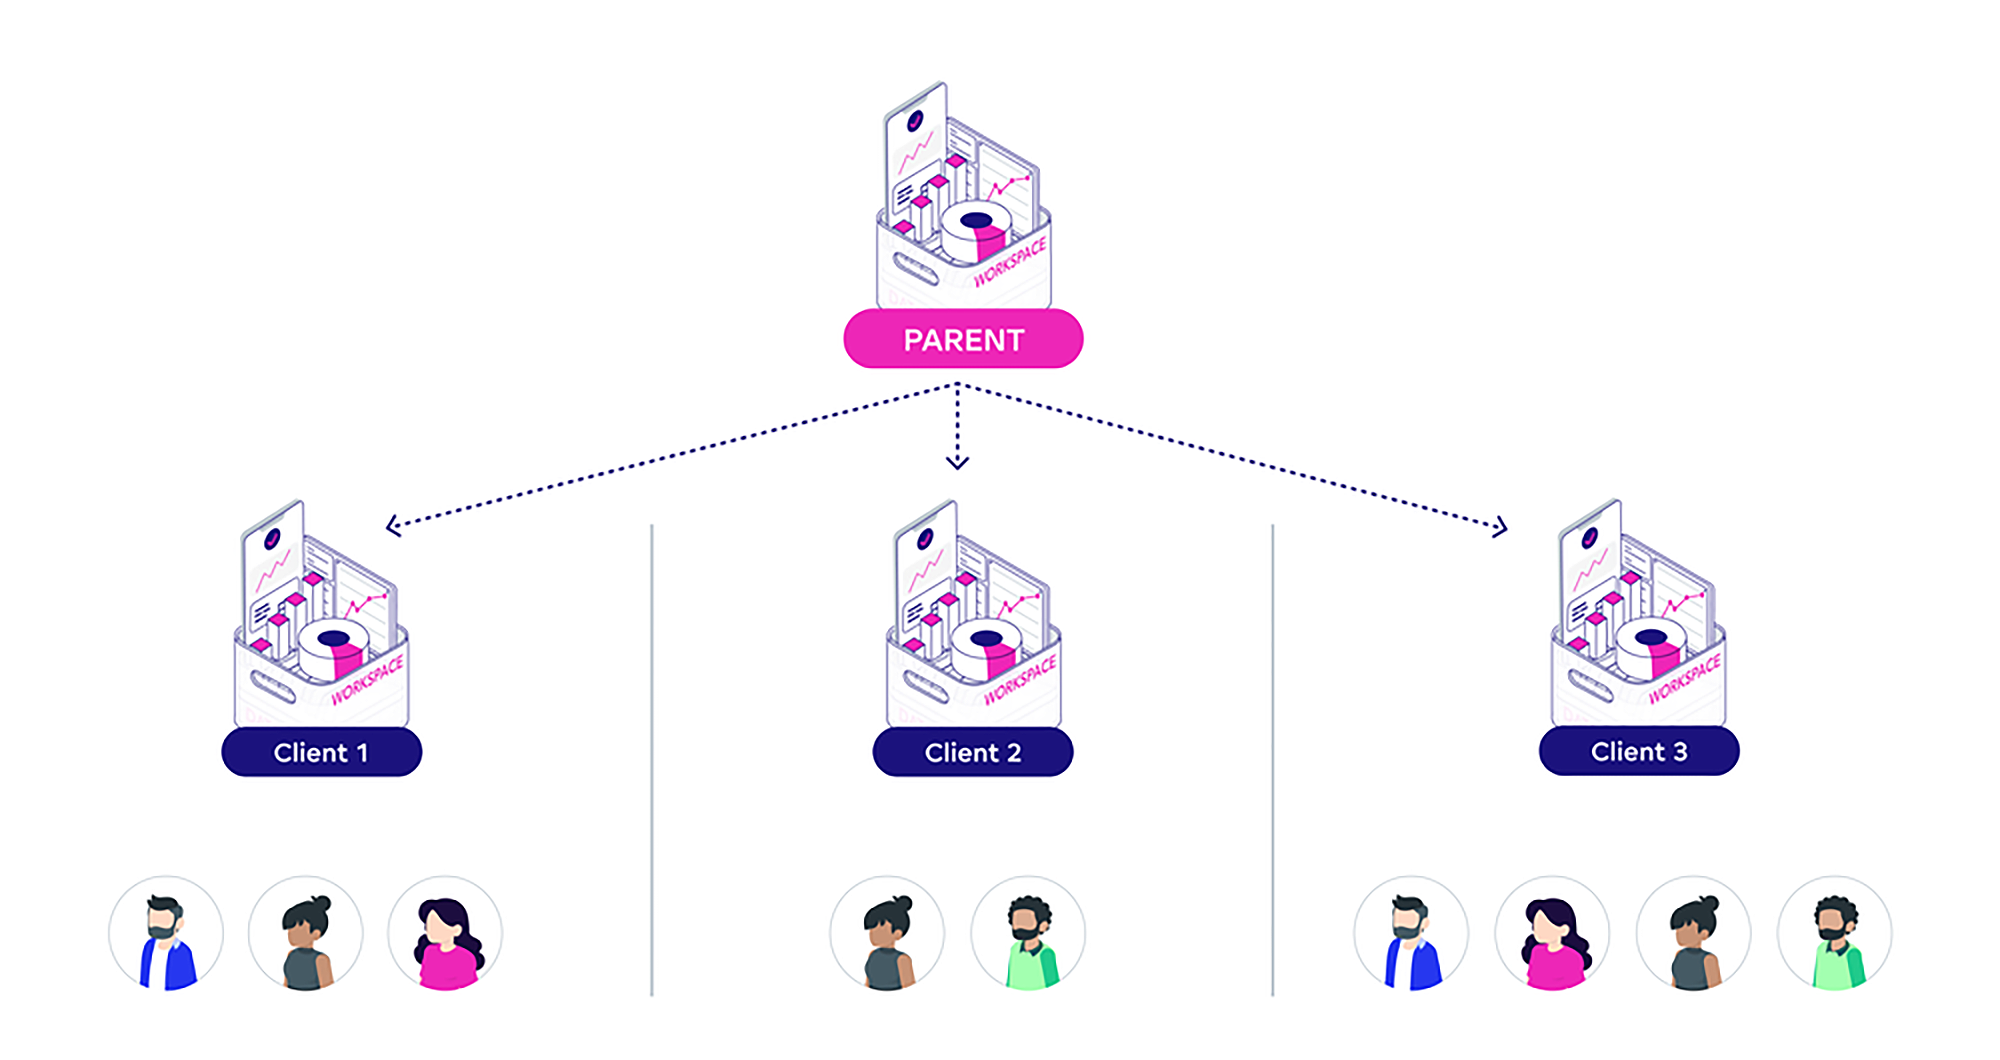
GoodData provides multi-tenant analytics, meaning multiple groups of users (such as internal teams, clients, customers, and other stakeholders) can all be securely supported within the same environment. This streamlines the efficient management of evolving data integrations and enables the seamless scaling of unified analytics, ensuring each user gets access to the right data when they need it.
For example, wholesalers or retailers may offer dashboards to their customers, each with standard data. If a retailer needs customized insights, those changes are made centrally and pushed to the specific customer’s environment. Broad updates can be made to the central “parent” template and automatically applied to the “child” dashboards.
Thanks to FlexQuery, an intelligent analytics cache that provides infinite scalability, GoodData’s multi-tenant architecture can scale without compromising performance. FlexQuery reduces query times and optimizes cloud data warehouse processing, helping to minimize costs and avoid unpredictable expenses.
Self-service analytics
For traditional BI and analytics users, GoodData provides a low-code/no-code analytics environment, which is designed to empower individuals without coding skills to access and analyze data.
One way to achieve self-service analytics is with a semantic layer. This translates complex data into a more understandable and business-friendly format and the Multidimensional Analytical Query Language (MAQL) can be used to write simple queries. Together with the drag-and-drop UI option, users can create new insights and dashboards as they please.
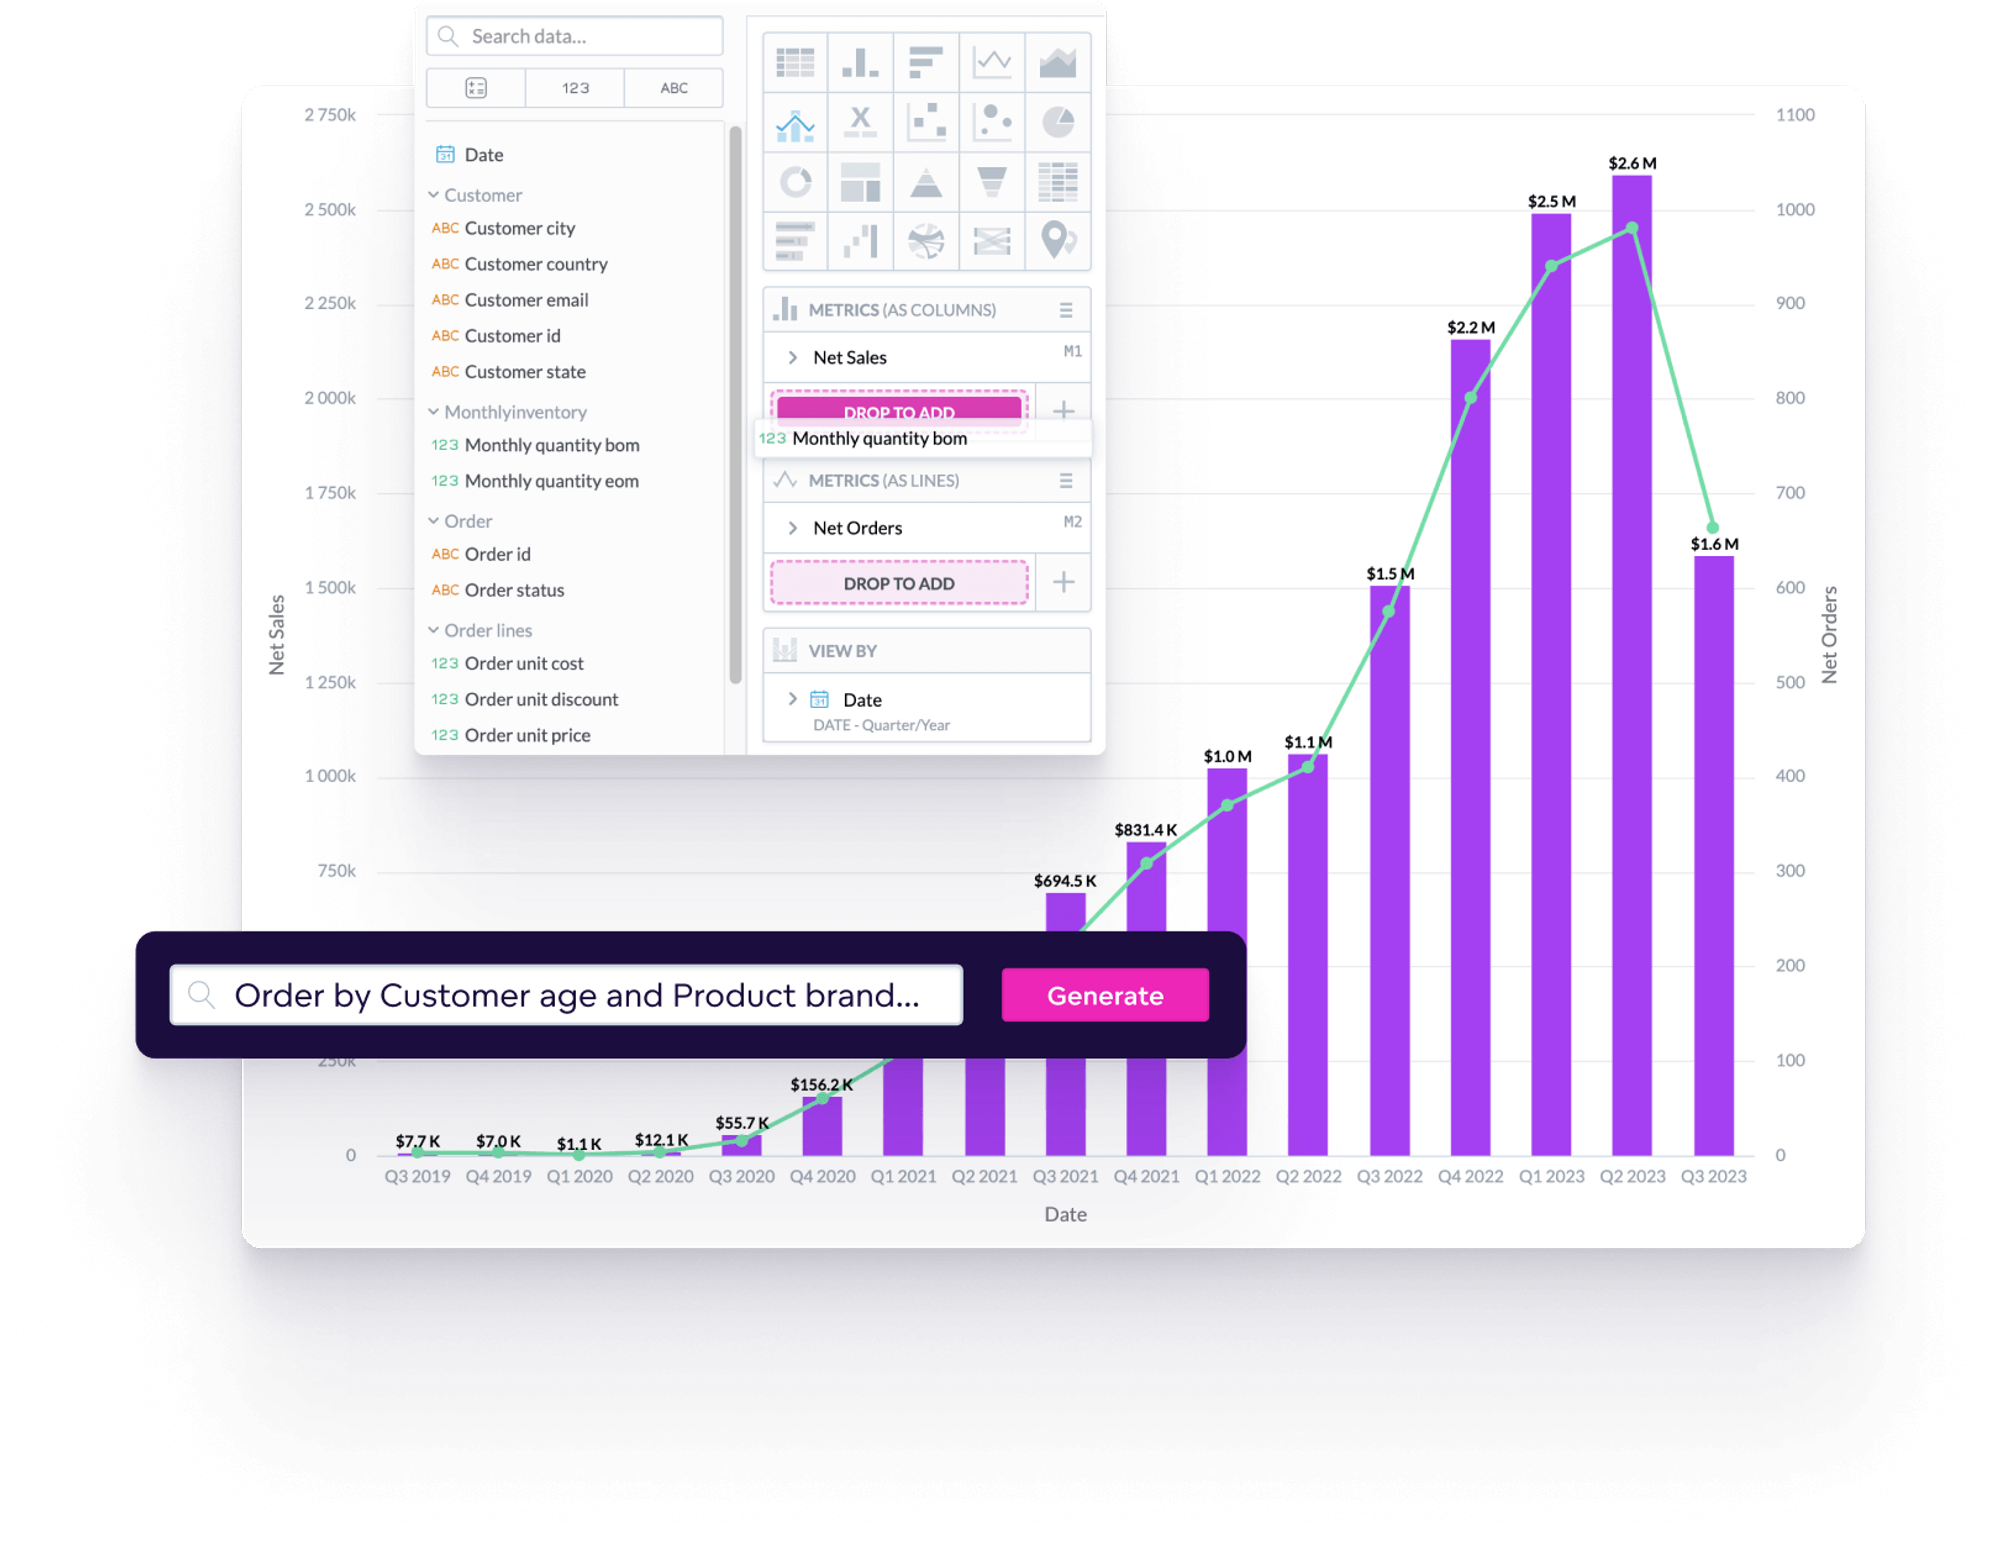
User-friendly automated insights eliminate traditional data analysis barriers (human error, missing information, and connections) and enhance the overall user experience. Users can input requests in plain language, and the platform translates these into actionable insights, offering detailed explanations, predictions, and more.
Flexible and future-proof analytics
GoodData’s flexible analytics environment empowers companies to strategically deliver data; ensuring the right information gets to the right place for aligned decision-making. This forward-looking approach, rooted in future-proof analytics, prepares businesses to adapt to changes and trends, guaranteeing long-term success.
GoodData offers a range of customization, embedded analytics, and integration options. You can tailor your analytics to match the identity of your brand, use APIs and SDKs to address specific needs, and easily embed analytics into your applications using iFrames, SDK libraries, or web components. These tools are designed for dashboards and UIs, allowing seamless integration with company apps for a faster development process.
GoodData offers access to third-party resources and provides seamless integration with external applications, including Jupyter Notebooks and other BI tools. This enables sophisticated machine learning applications and advanced predictions, thereby expanding the platform’s capabilities and effectively catering to a wide range of use cases.
Thanks to a consistent (‘single source of truth’) metrics store and semantic layer, the data, expressions, metrics, and KPIs remain the same when you use these other tools (developer notebooks, other BI or AI tools, etc.)
Flexible pricing model
GoodData offers a transparent and flexible pricing model tailored to meet the needs of different customers. Customers are given the following options to purchase licensing, depending on what works best for their use case.
- Workspace pricing: Flexible workspace pricing allows businesses to customize their plan based on specific features and services. The pricing is aligned with an organization's unique needs, ensuring value for each workspace and selected feature.
- User pricing: An affordable user pricing model, enabling teams to start small and scale up as the content becomes more valuable and usage grows.
- Cost saving: GoodData stands out from other vendors as it does not include a native cloud data warehouse (which can lead to increasing data warehousing costs) in its analytics stack. Instead, costs are reduced through an advanced caching layer built on Apache Arrow.
Ready to learn more?
Choosing the best BI tool for your business isn’t just about picking software — it’s about empowering your team to make smarter, faster decisions with confidence. The right BI platform can integrate complex data from various sources, turn this into clear insights, and deliver self-service analytics to the people who need it most. To learn more about finding the best BI tool and launching your analytics, check out our eBook on best practices for launching analytics.
And remember, with GoodData, you needn’t choose between ease of use, AI-powered insights, or scalability — you get it all in one platform. Interested in seeing this in action? Sign up for a free trial or request a demo — our experts are here to walk you through the platform and answer any questions.
Note: The above evaluation of features is based on our best understanding of publicly available information available at the time of publishing (April ‘25). To understand more specific details and feature differences readers are encouraged to perform their own research. All of the product names, logos, and brands used are for identification purposes only and remain the property of their respective owners. Use of them does not imply any affiliation with or endorsement by them.
Does GoodData look like the better fit?
Get a demo now and see for yourself. It’s commitment-free.
Trusted by