The Semantic Layer: A Practical Guide For Modern Companies
9 min read | Published


Summary
This article explains what a semantic layer is and why it matters in modern data analytics. A semantic layer sits between raw data and the people or applications that use it, translating technical structures into business-friendly terms. By providing consistent definitions, simplifying access, and improving governance, it helps organizations create a single source of truth that supports both human decision-making and AI-driven insights. The article also highlights how a semantic layer enhances self-service analytics, data security, and overall performance.
What is a Semantic Layer?
The semantic layer is a logical component that helps map the physical data structures to create a conceptual data model. It can be found between the database and the applications used by end users. By defining all of the rules and relationships between the data elements, it provides a common vocabulary for the data in business terms.
Why Do Organizations Need a Semantic Layer?
The semantic layer is a crucial but often overlooked part of all business intelligence (BI) platforms. It provides a simplified and consistent data view, allowing users to interact easily with the data, even if they have no technical knowledge of the data source.
Among other things, the semantic layer:
- Enables the creation of dynamic dashboards, allowing end users to flexibly query the underlying data or perform data and insight exploration.
- Smoothly scales data and analytics to a company’s user base.
- Saves resources and time wasted on duplicated communication and ensures data veracity.
Ultimately, the semantic layer makes it easy for companies to manage large amounts of data while generating accurate real-time insights. It is particularly important for companies using data for business, scientific, or machine learning purposes in a way that:
- Keeps them in control
- Secures the veracity of the insights pulled from different places
- Promotes access to data and analytics across their user base
The Different Types of Semantic Layers
Semantic layers take different forms, depending on the purposes they are built to serve. Factors that can influence semantic layer type include the kind of data source, the user base, the analytical tool being used, and the desired outcomes.
The semantic layer can be implemented in different ways, depending on the purpose of the data and analytics.
Semantic layer in a data warehouse
The main purpose of a data warehouse is to provide a centralized data source for the whole organization. It is designed to be a single source of truth for different departments, user groups, and use cases. The structure of data in the warehouse can be complex and technical, which makes it difficult for users to access the information they need. As a result, business users often extract portions of this data into BI tools, creating localized semantic layers that can contribute to semantic layer spread.
Semantic layer within data pipelines
When constructing data pipelines (the process of adding data from various sources to a data warehouse), data engineers input a semantic layer in the code. This layer helps to name and organize the different parts of the data models, such as tables and attributes.
Semantic layer in Business Intelligence (BI) and data analytics
This type of semantic layer defines business concepts and the relationships between them. It also defines metrics and calculations that can be used for analysis and reporting through different users and user groups for specific business use cases.
Universal semantic layer
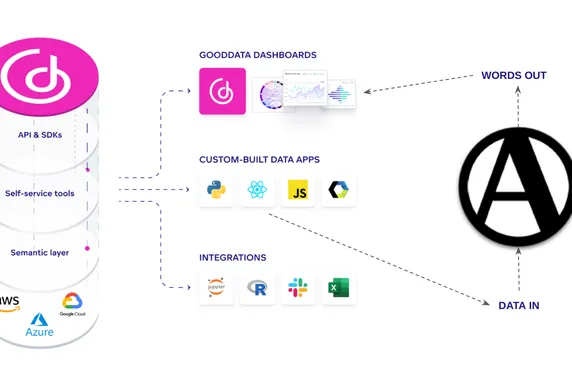
There is a connection between raw data and the different tools for users to analyze their data (such as BI and AI/ML tools, management tools, and business applications). Today, a universal semantic layer is often used to help AI tools understand the business context and avoid hallucinations. It doesn’t focus on a specific business use case, but needs to cover company-wide requirements.
Key Components of a Semantic Layer
In BI systems, the semantic layer comprises several components that enable easy data querying and scaling. The most crucial components are the physical data model, the logical data model, and metrics.
Physical data model and logical data model
A physical data model is the actual design and implementation of a database. It defines table structures, table column names, data types, primary and foreign keys, and other elements.
A logical data model (sometimes referred to as a semantic data model) sits on top of the physical data model and defines the relationships between individual data entities, attributes, and other objects in the physical data model. It allows data from different sources to be combined in a logical manner, based on a company’s use case.
The main difference between physical and logical data models is that the physical data model serves to design and build the actual database, while the logical data model helps to define the data elements and their relationships.

Physical Data Model vs. Logical Data Model
Metrics
Metrics are numerical values that can be created directly in the BI platform. They aggregate the data that already exists in the logical data model. It is possible to create metrics from attributes to count the number of individual values of the attribute. For example, counting the distinct attributes that describe the location of a sales department (which can then be reused in different visualizations).

A representation of components that comprise the semantic layer
How To Build a Semantic Layer
To create an easy-to-use analytics solution, the semantic layer needs to be designed with future updates and the end user in mind. The semantic layer collects huge amounts of data and provides analytics solutions for a wide user base, so providing clear information and not overwhelming the user with too many choices is paramount.
To ensure the layer is well-defined and implemented, follow some best practices on how to build semantic layers for massive-scale analytics. These include:
- Validating the semantic layer by testing it with different audiences and real users.
- Measuring the adoption of analytical features in your app to see which ones users find un/useful.
- Maintaining good governance and monitoring of the semantic layer by integrating insights into the standard product, ensuring it remains a "source of truth."
How AI, Machine Learning, and LLMs Cooperate with a Semantic Layer
AI and machine learning are now deeply embedded into day-to-day business operations, but these technologies are only as effective as the data they rely on. This is especially true for large language models (LLMs), which depend on well-structured, high-quality data to generate accurate, trustworthy insights.
A semantic layer provides a unified framework of consistent definitions, business context, and governed access to enterprise data. This ensures that machine learning models are trained on clean, reliable, and labeled datasets, helping prevent inaccurate predictions or biased outcomes. For LLMs and other generative AI tools, a semantic layer unlocks deeper understanding by exposing curated data through natural language interfaces and embedded applications, making AI outputs not just technically correct, but also aligned with business logic.
Ontology and Context Awareness
Modern semantic layers often include an ontology: a structured representation of relationships between data elements, metrics, and business concepts. This added context enables AI systems to interpret user intent more precisely. For instance, if someone asks, “What’s our revenue by region?”, the system can infer that “region” refers to a combination of fields like “state” and “country,” even if the term “region” isn’t explicitly stored in the data. This level of understanding comes from descriptions, relationships, and metadata defined in the semantic layer.
A semantic layer can also power more intelligent search experiences. Instead of relying solely on keyword matches, smart search leverages the semantic context to surface relevant metrics, dashboards, and visualizations. For example, a search for “total sales” might return all analytics assets related to that concept, even if those assets use different underlying labels or attributes.
How dbt Fits In
Tools like dbt (data build tool) are used upstream in the data pipeline to transform raw data into clean, structured models using SQL. These models lay the groundwork for a semantic layer by codifying data logic and definitions in a repeatable, transparent way.
When paired with a semantic layer, dbt ensures that this structured data flows through to BI tools, AI applications, and dashboards in a business-ready format. This combination not only standardizes data transformation but also aligns technical and business teams around shared definitions and trusted metrics.
Some modern analytics platforms even offer native dbt integrations that can automatically generate logical data models from dbt code, or import dbt-defined metrics and exposures for immediate use in analytics interfaces, accelerating time-to-insight and improving governance across the board.
Experience GoodData in Action
Discover how our platform brings data, analytics, and AI together — through interactive product walkthroughs.
Explore product toursWhat Are the Benefits of a Semantic Layer?
The benefits of a semantic layer can be differentiated in terms of technical and non-technical users, and the overall impact for an organization.
How a Semantic Layer Benefits Business Users and Data Scientists
Companies gather large amounts of unstructured data from different departments and functions. This can be hard for non-technical users to utilize without a semantic layer; BI analysts may need to intervene and query the data to provide insights.
A well-designed semantic layer allows data scientists and end users to interact with the data in the BI and analytics interface in easily understandable business terms (such as Revenue, Customer, and Product). BI and analytics solutions achieve this with a self-service approach that allows users to:
- Create visualizations in the analytics interface from provided metrics, facts, and attributes
- Change metrics and create new ones as needed
- Drill into the visualizations provided to obtain further data insights
- Easily create and manage all insights via drag-and-drop

Users can drag and drop datasets from the left panel
Data engineers and architects need to correctly link data in the LDM to ensure trustworthy results. This can be a challenge due to database loops, complex objects, and aggregate tables. Semantic layers help by tying data together to improve data consistency and veracity.

Data from the user's/company's chosen data source is displayed in the logical data model, providing trusted results to be used by different interfaces
How a Semantic Layer Benefits Companies
Business users need a consistent data structure to work with the data and build visualizations that answer their unique questions. The semantic layer provides this foundation but requires a BI or analytics platform to exist. Together, the two benefit companies by offering opportunities to scale:
- User base and multitenancy: Users can be grouped based on shared characteristics, such as data insights and dashboard needs. Each group has its own data within the same LDM. The semantic layer and multi-tenant architecture work together to increase data scalability and analytics availability, regardless of whether the user is inside or outside the company. Read our article on multitenancy to learn more about its benefits.

User groups in different workspaces share the same semantic layer
- Metrics management and a single source of metrics: The semantic layer provides reusability for data engineers and scientists by allowing for the creation of domain-specific semantic layers. This means you can set up the same metrics for different departments/user groups within one company that will display the same numbers. The semantic layer acts as a centralized repository for metric definitions and calculations, providing clarity and centralized rules for data definitions. This facilitates decision-making and the alignment of company goals.

Example of a reusable metric with a clear definition
- Data governance: The semantic layer makes it easier for data engineers to adjust underlying data sources without breaking anything, by, for example, disrupting the already created metrics or data insights and dashboards. This means less time and effort are required to maintain and manage the analytics solution.
- Security: A company collecting data from multiple sources and providing access to employees must balance data access freedom and restrictions. If access to data is overly restricted (i.e., users can only view the dashboards and are not allowed to create metrics and separate dashboards within their relevant workspaces), users might make copies of the data in other places. This makes it harder to keep track of the data and keep it secure. The semantic layer can help by allowing analysts to modify data at the LDM level, giving them both flexibility and control.
What Are the Disadvantages of a Semantic Layer?
The first drawback is that every BI vendor has its own semantic layer; each with the intention of simplifying data querying. This means each vendor has its own proprietary query language that a company’s data engineers will have to spend time learning.

SQL and MAQL comparison
Another aspect to consider is that even the best semantic layers require maintenance: ensuring they remain in sync with database changes requires some upkeep.
Finally, building a semantic layer with random underlying structures and a lack of understanding of the organization’s use case can defeat the purpose of the semantic layer and devalue the potential of the collected data. To avoid this, companies need to carefully evaluate potential BI solutions before they jump in, paying close attention to whether it is easy or difficult to build and maintain semantic layers.
Semantic Layer Use Cases
Streamlining reporting, securing data, and improving team collaboration are just some of the ways a business might employ semantic layers. Below we look at how companies use semantic layers across different industries.
E-commerce
E-commerce businesses can turn data into revenue by using a dedicated retail analytics solution to collect, process, and analyze data. As part of this setup, a semantic layer helps them to connect their data from multiple data sources (POS systems, customer service touch points, online stores), allowing them to plan campaigns effectively and increase customer loyalty by meeting their expectations.
Financial services
The finance industry is heavily regulated, so finance companies often find it difficult to obtain a comprehensive view of their financial processes. It can be difficult to access the relevant data located in various resources with limited access control and outdated systems. A semantic layer solves this by aggregating multiple data sources, helping finance companies to monetize their data and make accurate business decisions.
Insurance
The semantic layer helps to integrate data from various sources, such as policy administration systems, customer service touchpoints, claims processing systems, and external data sources. By aggregating this data, a semantic layer enables insurance companies to gain actionable insights about customer behavior, market trends, and risk assessment to improve their decision-making processes.
Get Started With GoodData
Interested in getting more hands-on? Start a free GoodData trial or request a demo to see how semantic layers work in our platform.
Learn More About the Semantic Layer
Check out some of our other resources to learn more about semantic layers, how they’re built, and what they can do for you:
GoodData Technical Architecture Series: What is a Semantic Layer?
How to Build Semantic Layers for Massive Scale Analytics
What are Semantic Layers and Why Should Product Managers Care?
Experience GoodData in Action
Discover how our platform brings data, analytics, and AI together — through interactive product walkthroughs.
Explore product toursFAQs About the Semantic Layer
A data lake stores raw, unstructured data from various sources, while a semantic layer sits on top of data systems to provide a consistent, business-friendly view of the data. The semantic layer makes data easier to query and understand, especially for non-technical users.
No. A data warehouse is a centralized repository that stores structured data, whereas a semantic layer is a logical layer that simplifies and standardizes how users interact with that data. The semantic layer often sits on top of a data warehouse.
An example of a semantic layer is the logical data model in a BI tool that defines business terms like "Revenue" or "Customer" and their relationships. It lets users create visualizations and metrics without needing to write complex queries.
A semantic model is a structured representation of data elements and their relationships, designed to reflect how a business understands and uses its data. It connects technical data structures to business concepts for easier analysis.
If your organization wants to enable self-service analytics, improve data consistency, and make insights more accessible across teams, then yes, a semantic layer is a valuable investment. It bridges the gap between complex data systems and business users.