eBooks
Sisense Alternative: Elevate Your Analytics Game with Dynamic Solutions
10 min read | Published

There are many tools to consider when evaluating BI and analytics solutions. Each brings its pros and cons, depending on the specific use case. The Sisense Fusion Analytics platform is a strong player in the embedded market and offers promising scalability, while GoodData excels in both embedding and the broader analytics/BI market. This guide provides an overview of the two platforms to help you choose between them.
First, let’s look at the must-haves of a modern analytics tool:
- Strong dashboard and visualization engine.
- Tooling for all key personas (consumers, business analysts, analytics developers).
- Ease of administration.
- Ability to handle large data volumes.
- Scalability and performance tuning.
- Embedding and white labeling capabilities.
- Developer tooling and integration features.
- AI and ML functionality for users, as well as toolkits for developers.
The above is a very broad checklist. To ensure a potential BI tool matches your specific goals, read How to evaluate BI tools to choose the best one. And if you’re interested in other tools, besides Sisense and GoodData, check out comparing the best BI tools.
Now, on with the comparison!
What is GoodData?
GoodData is a flexible embedded analytics solution that seamlessly integrates analytics for smooth operation. Prioritizing collaboration and data sharing, it is designed for scalability and high performance. GoodData caters to both enterprises and small businesses, including startups.
In October 2023, GoodData introduced its future vision, the Analytics Lake: an API-first, AI-powered analytics platform, which empowers engineers with APIs for data definition, optimization, and visualization.
What is Sisense?
Sisense empowers organizations to seamlessly integrate analytics across various applications. The platform, which fosters collaboration and sharing, supports self-service augmented analytics and embedded use cases in a hybrid cloud. Since late 2021, it has incorporated AI-powered analytics to provide valuable insights to users and accelerated its product innovation through advanced AI/ML capabilities.
General overview
Below is a high-level overview of the features and capabilities of GoodData and Sisense.
Deployment
GoodData
In cloud or on-premise - any public or private cloud, data center, or region - managed by GoodData or you
Sisense
On-premise, cloud
High support for Linux
Caching
GoodData
FlexCache for data processing by caching frequent computations and aggregations in dashboards, using Apache Arrow's efficient columnar format for large-scale analytics.
Sisense
Computations and aggregation tables for quick query retrieval are stored in ElastiCubes – updated at regular intervals.
Data source
GoodData
Native connections, connecting non-listed data sources through data source managers (Apache Drill, Dremio), or develop new connectors with FlexQuery.
Sisense
Native and non-native connections, connector plugins to apply custom logic to modify data sources.
Data modeling
GoodData
Create new SQL datasets in the connected model (changes provided and stored in the analytics without affecting the connected database).
Sisense
Clean and prepare data for analysis. Edit and modify the model.
Metrics
GoodData
Create metrics using MAQL (simplified SQL through all dimensions and tables) in Metrics Editor, via APIs or Python SDK.
Visualizations
GoodData
Create your own highly customized visualizations using React SDK or dashboard plugins, interactive visualizations.
Sisense
Create your own visuals, although these may be challenging to maintain/with limited setup, interactive visualizations.
Customizable appearance
GoodData
Without limitations: fully white-labeled apps, highly-customized appearance of charts and dashboards (even via code).
Sisense
Limited to specific tier: fully white-labeled apps on web and mobile versions, limited ability to customize charts and dashboards.
Multitenancy
GoodData
Ease of deployment by setting up separate organizations (domains), workspace hierarchy, and user groups.
Sisense
Supported in different ways (self-contained, multi-instance, internal capabilities).
Self-service
GoodData
Low code/no code for analysts and business users (semantic layer for using business expressions rather than technical names, user-friendly no-code UI, and AI-fueled features), integrated data science for developers.
Sisense
Steep learning curve for advanced features and customizations.
Git connection
GoodData
Integrate with CI/CD Pipeline using API and Python SDK.
Sisense
Native connection built within the analytics.
Developer experience
Sisense
API-first approach
Alerts and scheduling
GoodData
Schedule export by Python SDK via emails, or trigger email alerts using Zapier.
Sisense
Notification received via email, mobile, Slack, or Zapier.
AI and ML
GoodData
Ease of navigation in the platform, ML in dashboards, data profiling, model validation, AI assistant, and more.
Sisense
AI that automatically highlights insights, built-in predictive analytics, deeper data exploration, anomaly detection, allows users to ask questions in natural language, and more.
Pricing
GoodData
Different pricing models, specifically for small companies/startups and enterprises (per workspace pricing).
Sisense
Combinations of user licensing and server licensing; not ideal for small companies, the pricing model is not very transparent and may discourage widespread adoption.
Use cases
GoodData outshines the competition in four key areas: multitenancy that brings ease of administration, strong embedding capabilities, a robust developer experience, and cutting-edge AI and ML tooling.
Let’s dive into each of the above in turn:
Multitenancy
Both platforms are highly scalable and make it possible to scale analytics to align with internal (departments, internal teams) and external purposes (vendors, clients, customers). It is possible to achieve this via multitenancy, which can be set up in the UI or via APIs. The blueprints of each multi-tenant Sisense use case share the same purpose as GoodData:
Sisense:
Multi-instance: Separate installation for independent tenants
Self-contained: Separate application with dedicated servers set up for each independent tenant
Internal capabilities: Segregation between tenants using application features and user groups within the same dedicated environment
GoodData:
Separate organizations (domains): Separate domain set for each independent tenant
Workspaces: Separate analytics environment (workspace) for different tenants (or groups of tenants)
Multiple users and user groups per workspace: Same workspace containing multiple users and user groups with different permission levels
Option three is the most popular approach, especially among companies with a larger user base, both internal and external requirements, and who are aiming to cut costs. It allows companies to establish separate analytics environments for specific entities (such as different vendors) to maintain data privacy. Within these environments, there is the flexibility to invite an unlimited number of users and organize them into groups as needed.
Pros and cons of multitenancy
The following table introduces some issues Sisense users experience according to reviews (G2, TrustRadius, and more), and how GoodData resolves these within its platform.
Ease of provisioning / maintenance
GoodData
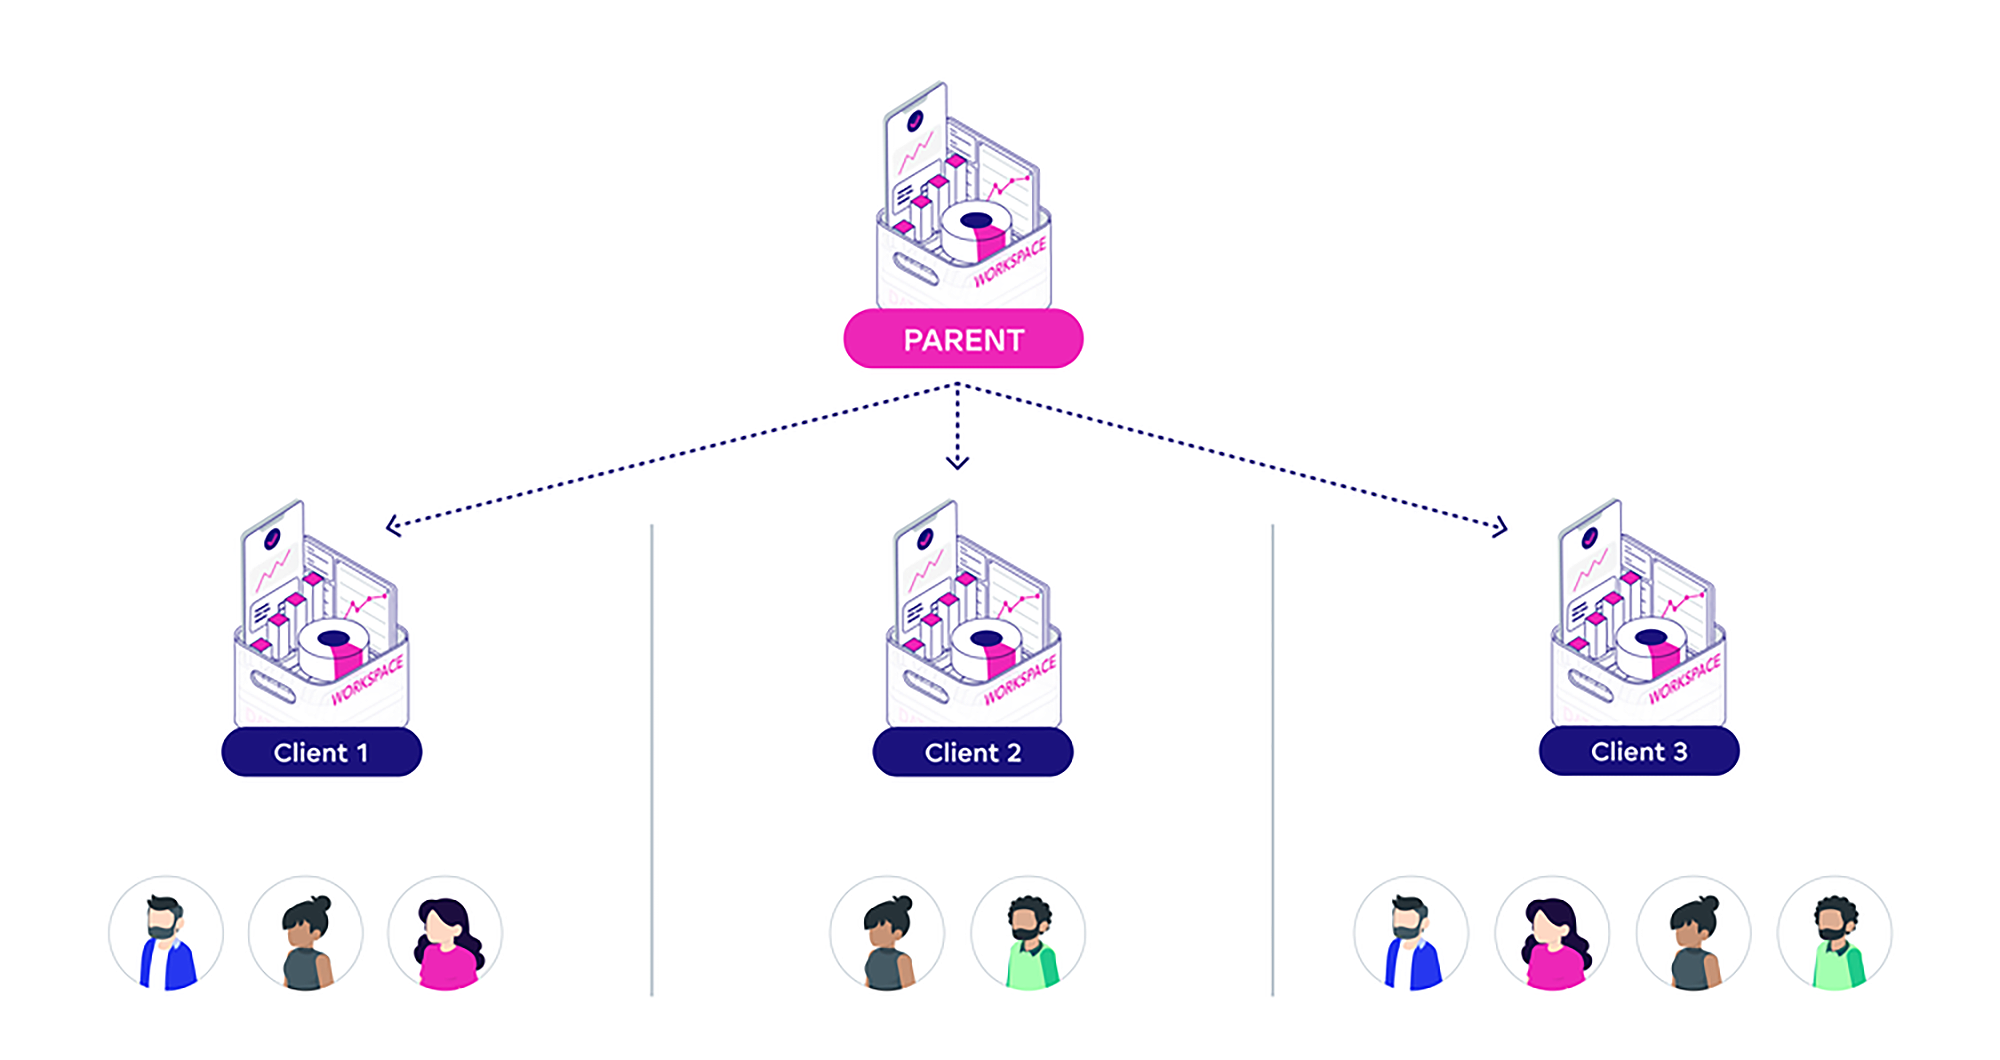
GoodData enables the provisioning of workspaces and users from a central point (the parent workspace). This allows for streamlined changes, with each child workspace inheriting modifications made at the parent level.
Sisense
Sisense's multitenancy doesn't work as it is presented. Instead of provisioning new environments and delivering changes automatically, companies often need to put additional effort into creating dashboards for customers.
Intuitive platform for self-service
GoodData
GoodData's intuitive interface, backed by a semantic layer for business expressions, and facilitated by MAQL's drag-and-drop metric creation, empowers users to effortlessly manage analytics without technical expertise.
Users can create personal dashboards in GoodData without impacting other dashboards or incurring extra costs. Individual or group dashboards remain unchanged, with the inherited dashboard locked for additional edits, allowing only filter application, drill down, and zoom in/out.
Sisense
Individual support is inefficient for many internal and external users who need analytics. An intuitive, user-friendly interface is a must-have to adapt to self-service – and this is what Sisense users miss. Its analytics interface is unattractive, challenging to customize, and has a steep learning curve – particularly for non-technical users.
Building dashboards in the Sisense analytics environment can feel challenging. Users access data and make changes through filters on dashboards. To create a personalized dashboard, a user needs their own workspace.
Pricing
GoodData
GoodData has a clear pricing structure, making it easy to predict the final costs.
Sisense
Scaling analytics with Sisense may result in higher costs for hundreds or thousands of users.
Documentation
GoodData
GoodData’s multitenancy is well-documented, covering every aspect and setup option. If additional customer concerns or issues arise, a professional support team is available.
Sisense
Sisense has insufficient multitenancy documentation. Users lack a detailed, step-by-step guide, and other multi-tenant options.
Embedding
Both Sisense and GoodData are highly competitive when it comes to embedding. (If embedding is important for your use case, you might like to read Comparing the best embedded analytics tools).
The two solutions offer various embedding methods with different levels of flexibility:
Less flexible
Sisense and GoodData offer the simplest way to embed dashboards and the analytical designer (UI) via IFrame.
Flexible
Sisense offers an embedding solution (especially for separate visuals) via Embed SDK, a Javascript library, which uses the IFrame in a more customized way. GoodData’s next level of flexibility uses web components: the Web components library makes embedding simple, and single visualizations can be embedded.
Very flexible
Sisense offers SisenseJS, a JavaScript library designed to embed individual dashboards, widgets, and filters into web apps without relying on IFrames. Additionally, there’s Compose SDK — a set of client-side libraries for composition, data visualization, and more. This allows the creation of new elements, including customized visualizations. Sisense's Compose SDK is similar to GoodData's React SDK.
GoodData uses a React-based JavaScript library for flexible embedding, enabling the construction of responsive analytical applications by embedding pre-built dashboards and visualizations. React SDK can also be used for programmatic embedding, allowing the creation of custom, interactive visualizations, directly embedded into web apps.
Pros and cons of embedding methods
The table below shows the advantages and disadvantages of the embedded analytics the two solutions offer.
What can be embedded
GoodData
Allows the embedding of separate insights, dashboards, or the entire Analytical Designer.
Sisense
Companies can embed visuals, dashboards, and even the whole UI into users' applications.
Customizing the experience
GoodData
Using programmatic embedding, GoodData enhances the customer experience with personalized analytics tailored to their specific needs.
Sisense
Sisense provides a range of customization levels to meet various business needs. Users can manage embedded components through code, allowing for extensive customization of visuals and dashboards.
Trial options
GoodData
Users can follow a step-by-step guide to embed partial or entire analytics into their applications, or request a demo to see how the embedding works.
Sisense
When evaluating the solution, customers can try the embedded options in the Sisense playground.
Level of upskilling
GoodData
GoodData boasts an intuitive UI. Users can embed the analytics interface directly into their applications and still use the same one.
Sisense
Some users are overwhelmed by the amount of features and find the app too complex. Embedding visuals into users' apps can be tricky as the user interface is not intuitive and requires technical knowledge.
Developer experience
Sisense is a robust analytics tool that caters more to analytical engineers. It supports code-based development and analytics management to empower users with a technical background. Meanwhile, GoodData caters for varying levels of expertise, from no code/low code users to analytical engineers and developers. GoodData’s "analytics as code" approach has strengthened its position in the analytics and business intelligence market.
Sisense for developers
- Leverages an API-first approach, using Sisense REST APIs to automate processes and workflows (user and security management, dashboard and widget control, branding, and administration settings).
- Effortlessly embed insights using the Embed SDK for quick setup, or use more enhanced programmatic embedding with SisenseJS to customize the embedded solution.
- Sisense BloX (plugin available on the marketplace) to build interactive pre-built or new widgets using React.
- Git integration, available in the Sisense application, can control all software elements, including code, libraries, APIs, and analytics without the need to switch to the Git environment.
GoodData for developers
- Applies an API-first approach, using GoodData APIs to access raw data, customize the user interface, integrate new features into the analytics, or explore data with any other applications.
- Uses Headless BI to provide consistent, real-time metrics through a unified semantic layer for applications that end users already use (AI/ML tools like Jupyter Notebook, BI tools like Tableau or Power BI).
- Build integrations with CI/CD pipelines thanks to GoodData Python SDK and the API-first approach. Write your own workflow in YAML files and push it through Git actions.
- Use pre-built Web Components for embedding, or build your own highly customized visuals using React SDK for a seamless user experience.
- Leverage “as code” to manage the entire analytics environment. Use only code in developer-friendly environments through VS Code extension (specifically developed by GoodData).
Pros and cons of developer experience
These are the pros and cons of Sisense and GoodData when it comes to the developer experience.
APIs
GoodData
Easily readable and manageable exported API codes can be used to provide further changes to the analytics and apply them.
Sisense
Exporting analytics via APIs generates non-human-readable data, mainly GUIDs. This makes it challenging to work with and can limit usability.
VS Code
GoodData
Everything is built and manageable via code in VS Code
Sisense
No similar option offered
SDK
GoodData
Headless BI decouples the backend and presentation layer, enabling shared metric definitions across various tools, ensuring consistent information for all users, regardless of the frontend.
Sisense
As a part of “embedding”, integration with other most used communication tools, such as Slack or MS Teams, or by using available integrations of non-analytics tools from the marketplace.
Marketplace
GoodData
No marketplace is currently available
Sisense
Sisense marketplace is available, with a range of add-ons, integrations, and data pipelines
AI-enhanced features
For GoodData, the core principle is "analytics as code," where everything is written in code with a defined structure. This is crucial for integrating AI-fueled features as it enables the use of Large Language Models (LLMs).
LLMs are used to understand data, summarize information, and make predictions. Despite analytics relying on code, LLMs can be challenging for non-technical users. GoodData's semantic layer addresses this issue, translating technical details into user-friendly terms for easy interaction and natural language requests.
Sisense also employs LLMs and a semantic layer. The company introduced Compose SDK to add generative AI-powered analytics to their solution, facilitating seamless integration into web applications, and simplifying the embedding of analytics into products, user experiences, and workflows.
Sisense and GoodData share some similar AI features (albeit with different names):
| Capability | Purpose | GoodData | Sisense |
|---|---|---|---|
| AI Assistant | Using natural query language to ask questions and provide answers with visualizations | AI Assistant | Simply Ask, |
| Recommendations | To suggest content based on user behavior, trends, and relevance | Recommendations | Exploration Paths |
| Data forecasting | To predict future trends | Forecasting is available under the Edit options in the One Click feature. Jupyter Notebook integration empowers engineers to customize models, enabling users to fetch data, modify algorithms, pre-process data, and visualize results — all within the same ecosystem. | Via an automl-like approach that runs forecast models using the weights assigned to each of them to return the most accurate forecasting |
*Sisense also offers some AI-enhanced features on its marketplace, for example, Sisense Quest, which contains out-of-the-box statical models, but also allows deployment of custom ML models through the upload of Python scripts.
What other AI features does GoodData have?
The platform utilizes ML and user behavior analytics within the analytics homepage to tailor offerings to individual user needs. This is achieved by asking simple questions in natural language, giving recommendations based on behaviors and trends, and streamlining analytics access for easy navigation of the most important content.
Why do companies choose GoodData over Sisense?
- Multitenancy: Companies can easily set up new clients/vendors with separate workspaces by enabling automatic deployment of changes from a central workspace.
- Embedding: Both GoodData and Sisense provide highly customizable embedding solutions, but GoodData's interface is easier for business users, while Sisense demands technical knowledge.
- Developer experience: Both platforms offer excellent support to developers (API-first approach, programmatic embedding, Git integrations). But GoodData has a built-in “as code” approach, and has also introduced VS Code extension which helps users to manage analytics in a developer-friendly environment.
- AI-enhanced features: Both Sisense and GoodData are incorporating AI into their products. However, GoodData offers more built-in features, and thanks to its future vision, there is more to come (e.g., intelligent caching, features for all kinds of users, including analytical engineers and developers).
Next steps with GoodData
Still hesitating between GoodData and Sisense? Try our free trial to get some first-hand experience. Have questions or want to see real-time use cases? Request a demo for a platform walkthrough.
Find Out How We Stack Up Against Our Other Competitors
Check out some of our other resources to learn more about how we compare to other GoodData alternatives:
AWS QuickSight Alternative: Choosing the Right BI Tool for Your Needs
Tableau Alternative: Addressing Challenges and Solutions for Modern Analytics
Qlik alternative: Which tool is better for your analytics?
Looker Alternative: Which BI Tool Better Fits Your Business Needs?
Domo Alternative: Discover the Right BI Tool for Your Needs
Power BI Alternative: Finding the Best Fit for Your Business
*Note: The above evaluation of features is based on our best understanding of publicly available information available at the time of publishing (Dec ‘23). To understand more specific details and feature differences readers are encouraged to perform their own research. All of the product names, logos, and brands used are for identification purposes only and remain the property of their respective owners. Use of them does not imply any affiliation with or endorsement by them.*
Enjoy this article as well as all of our content.
Trusted by


Does GoodData look like the better fit?
Get a demo now and see for yourself. It’s commitment-free.