White Papers
How to Evaluate BI Tools to Choose the Best One
All You Need to Know
11 min read | Published

About
Searching for a BI or analytics tool that will fit your needs in the long term — while considering possible ways your business and teams might develop in the near or more distant future — is no simple task. Factor in evaluating analytics platforms that you have never used, going through hard-to-read documentation, and talking with peers, often knowledgeable about only one specific platform and use case, and BI tool evaluation sounds even harder.
BI Tool Selection Criteria …
Armed with the hands-on knowledge of our specialists, we have put together a guide to help you understand the criteria you should be looking out for. Using their experience of numerous analytics implementations for local and global companies, we are here to help you smoothly navigate the choppy waters of BI software evaluation.
For experienced BI and analytics professionals, this guide might serve as a checklist of their expert knowledge, while for the less experienced it may prove invaluable in setting them on the right path to successfully evaluate BI tools. Once you’re clear on the criteria to look out for, you can head over to our Best BI Tool Comparison to help you decide which software is right for you.
Use Case, Purpose, Objective
When it comes to BI tool evaluation, the best place to start is with “use cases”. In simple words, the term “use case” refers to how the platform is going to be used and what will be required from it.
BI tool providers usually share “success stories”, describing how their existing customers have used their platform. In order to create a shortlist of what to ask potential providers and which success stories to look for, it is useful to start a level higher.
At the highest level, it is worth knowing that there are two major groups of use cases, which can then be broken down into more detailed use cases. We will only outline the differences between the two major ones because those are instrumental when it comes to the set of features you will need to pay the most attention to during your BI software evaluation.
These two main areas are internal analytics (B2C) and external analytics (B2B).
Internal Analytics (B2C)
In an internal use case, BI and analytics serve mostly internal teams and stakeholders.
The underlying objective is to give more internal stakeholders access to analytics in order for them to help drive your business forward via more informed decision making: based more on data analysis, facts, and insights and less on guesses.
Internal analytics is where we more often encounter both terms, business intelligence and analytics, and whereby a growing number of companies strive to build a data-driven culture within their organizations. It is important to note that in this case, the analytics platform is instrumental in driving business profits and decision alignment. It doesn’t, on the other hand, happen to be an instant profit generator due to the fact that it is used by internal teams and not customers.
External Analytics (B2B)
In an external use case, BI and analytics serve mostly customers and partners. You may also find this type of analytics referred to as “customerfacing analytics”.
The underlying objective is to build analytics and reporting for your external users. This group of use cases is especially complex and diverse as those customers or partners may or may not be paying for this service.
Another significant difference from B2C use cases is that the analytics interface (dashboards and visualizations) is presented to external users, therefore representing your company in the public domain.
The ability to provide dashboards and charts at a moment’s notice is also of higher importance here because the users are your customers and partners, and failing on that promise could have faster and more direct consequences for your company.
And why are we starting with all of this?
Because, depending on whether yours is a B2C or B2B use case, a specific set of features will rank higher in importance on your BI tool evaluation matrix.
Self-Service Visualizations
Internal Teams
Must-have
External Partners and Customers
Must-have
Interface white-labeling and theming options
Internal Teams
Nice-to-have
External Partners and Customers
Must-have
Full interface embedding and advanced interface customizations
Internal Teams
Nice-to-have
External Partners and Customers
Must-have
Scalability in terms of number of users, cost, and overall user and data management
Internal Teams
Nice-to-have, but without it is a
strong pain point to B2C companies
External Partners and Customers
Must-have
Architecture flexibility
Internal Teams
Nice-to-have
External Partners and Customers
Must-have
Advanced security
Internal Teams
Must-have, if you are a global company
or process sensitive data
External Partners and Customers
Must-have
Infrastructure, data-source connections
Internal Teams
Must-have
External Partners and Customers
Must-have
The flexibility of deployment options
Internal Teams
Nice-to-have
External Partners and Customers
Must-have (competitive advantage
to fit in customer’s environment)
This is only a simplified introduction as each use case needs detailed attention and deep-dive evaluations. To kick off your search you should gather information on what is your specific use case and also the specific business situation and IT setup within your organization.
BI Tool Evaluation Checklist: Factors and Features
In the previous chapter, we mentioned some of the areas to be evaluated during your search. For more details on this, check out our webinar: How to choose a BI tool. But for now, let’s briefly discuss the factors and features in turn.
1. Self-Service Visualizations
“Self-service” means that business teams — people without technical or data-related skills (e.g., account managers, financial specialists, etc.) — can compose their own (or manipulate pre-made) charts and dashboards.
Your business teams can simply create their own charts or work with those already provided, without having to send requests to specialized data analysts. In the past, these self-service features in BI tools weren’t commonly available, often undermining the popularity of analytics amongst business professionals. Presently, it is becoming a must-have feature as organizations strive to promote data culture across their teams.
Not every self-service analytics solution is the same, in terms of its visual attractiveness, ease of use (drag and drop, intuitive drilling path setup), and easiness to make changes (swapping metrics and dimensions, creating new metrics from predefined metrics). Those are the details you should pay attention to.
2. Interface Customizations and Embedding
Sometimes the platform’s default interface is sufficient but oftentimes it isn’t. There are different levels of interface customization that can be broken down into the following:
- Zero: not required. You just need an analytics tool for users to sign in to and create visualizations using data made available to them directly in the tool. In this case, you could imagine something like Google Data Studio or even Excel.
- White-labeling and theming
- Full interface customization and embedding
Level 1: White labeling and theming customizations
White labeling (i.e., aligning the analytics platform’s visual appearance with your brand logo, colors, and other brand details) is a must-have for B2B analytics. This is especially the case when organizations want to promote their own solutions and products and not the analytics provider’s brand. Despite this option being of less concern for internal teams, it is also a desirable feature for many B2C organizations.
Of course, you can also change the default analytics interface to other colors and details that do not necessarily reflect your brand, if so desired.
White labeling is a capability that is often already tightly woven into an embedded analytics solution, yet you do not have to embed an analytics interface and dashboards in order to customize their look and feel to your liking.
Level 2: Full interface embedding and customization: Integration with your application or web portal
One level on from white labeling is that of embedding an analytics platform into your application or web portal. This is carried out in a way that your end users cannot tell the difference between the two applications.
Embedding is especially important for companies searching for an analytics platform to integrate within their own solution and offer to customers or partners as one, packaged software product (application).
With the help of advanced developer tools, your organization can quickly build an application propelled by the provider’s analytics engine, which, on the surface, looks like anything you require. The interface can be easily and cost-efficiently customized to suit your needs.
For this case the advanced toolkit for developers should be part of the analytics platform. BI providers might refer to it as a composable, low-code/ no-code interface; meaning that your developers do not have to invest time and resources into creating and testing new elements from scratch. Instead, they can flexibly and quickly accommodate the interface from pre-built components and libraries.
Interactivity of embedded visualizations for end users
What’s important to note is that there are different types of embedding, and each one imparts a different level of interactivity of the embedded dashboards and visualizations for end users. While some types provide minimal to no interactivity for end users (typically, iFrame), others enable end users to drill into the embedded visualizations, or even change the type of chart and then remove metrics from it.
If you wish to customize or embed an analytics interface, then the quality of the toolkit will be very important for your teams. Therefore, your BI software evaluation should focus on evaluating the types of embedding and interface customization, and their interactivity for end users and easiness for developers.
3. Scalability Rules Them All
It is better to start to think of scalability before acquiring a new BI and analytics tool rather than later on in the process. This is because scalability significantly affects areas across the whole analytics solution. Before moving forward with your BI tool evaluation, ask yourself which situation your organization is in:
- You are searching for an ad-hoc, standalone tool that will work alongside other analytics tools already used in your organization.
- You are searching for an analytics tool that will unify data and analytics management across your organization, or for your own solution. In this case, the analytics platform is expected to flexibly expand across your user base.
For your BI software evaluation process, this is the most important takeaway on this topic:
Different BI and analytics platforms will have different architectural setups which will have a direct impact on the tool’s ability to scale. The ability to scale should not be overlooked because it directly relates to four main areas:
- The number of users you will be able to deliver analytics to
- The number of user groups (i.e., internal teams, customers, business partners, etc.) you will be able to manage, maintain, and to which you will roll out new versions
- The amount of data you will be able to move
- The cost of running an analytics solution on a larger scale
What will be important to understand is how the BI platform handles growth in these areas, in order to ensure none of the platform’s components will become a bottleneck to your BI and analytics strategy.
Two Main Questions Regarding Scalability
1. Scalability in terms of business cost: user base expectations
Pricing models impact the capability to provide analytics to more people within your organization or more of your customers and partners. Therefore, we always recommend organizations think about this question.
- No prediction: anything can happen in one year’s time.
- Stagnant: You need an analytics tool for a (more or less) stagnant number of users and volume of data. Your user base can be small or large but the point is that it’s at a certain level you can lean on when budgeting and implementing an analytics platform and strategy.
- Growth: You predict that at some point the number of users and data volume will start to grow significantly.
The analytics architecture should also be part of your BI tool selection criteria as this defines the platform's ability to efficiently deliver scalability.
2. Scalability in terms of technical feasibility: flexible architecture
The scope of questions on analytics architecture depends on your use case and it can trickle down to truly expert and technical definitions. Immersing ourselves in this topic is, therefore, not the aim of this introductory paper.
However, what is important to remember is that analytics architecture will define your capability to (1) efficiently scale and give analytics to various groups of users (teams, departments, customers, partners), and (2) to connect the analytics capabilities with any kind of application.
To ask the right questions and get the best answers you need to describe your use case first, and we hope that the points mentioned above will be a useful guide in your BI tool evaluation process.
Scalability: the advanced use case of headless BI
A headless BI use case describes the situation when the visualization of data is separated from the analytics engine. This gives your end users (business managers) the freedom to use multiple visualization tools (many heads), such as Excel, Tableau, PowerBI, or any other, while the data is integrated, powered, and aligned via a single analytics engine. Moreover, machine learning models, or any other software applications, can access the analytics engine via API.
Such a setup brings you various benefits: you can define metrics used across the organization just once for all data visualization tools and, as such, keep control of said metrics. This significantly improves the data and analytics management for your organization and the veracity of data presented in reporting and dashboards.
4. Infrastructure and Data Sources
To get data out in the form of visualizations, you have to first get them in. It is for this reason that data source connectors are one of the most frequently addressed areas when evaluating BI and analytics solutions. Organizations usually find themselves in one or other of the following situations:
- No specific needs: You are beginning to build your infrastructure or your organization has reached a point when IT and cloud restructuring is necessary. This situation gives you more freedom when evaluating BI and analytics tools, especially if analytics is going to be of high importance in your organization.
- Specific needs: You are confident about your existing infrastructure and any new tool has to work alongside it seamlessly. In this case, your list of selected analytics tools for detailed evaluation starts with those that fit your infrastructure.
Deployment Options
Bearing in mind deployment options is important especially if your organization needs to control where the data is stored at all times due to compliance stipulations. In order to successfully evaluate BI tools, be sure to consider which option works best for your use case and the kinds of questions you should be asking a potential analytics provider.
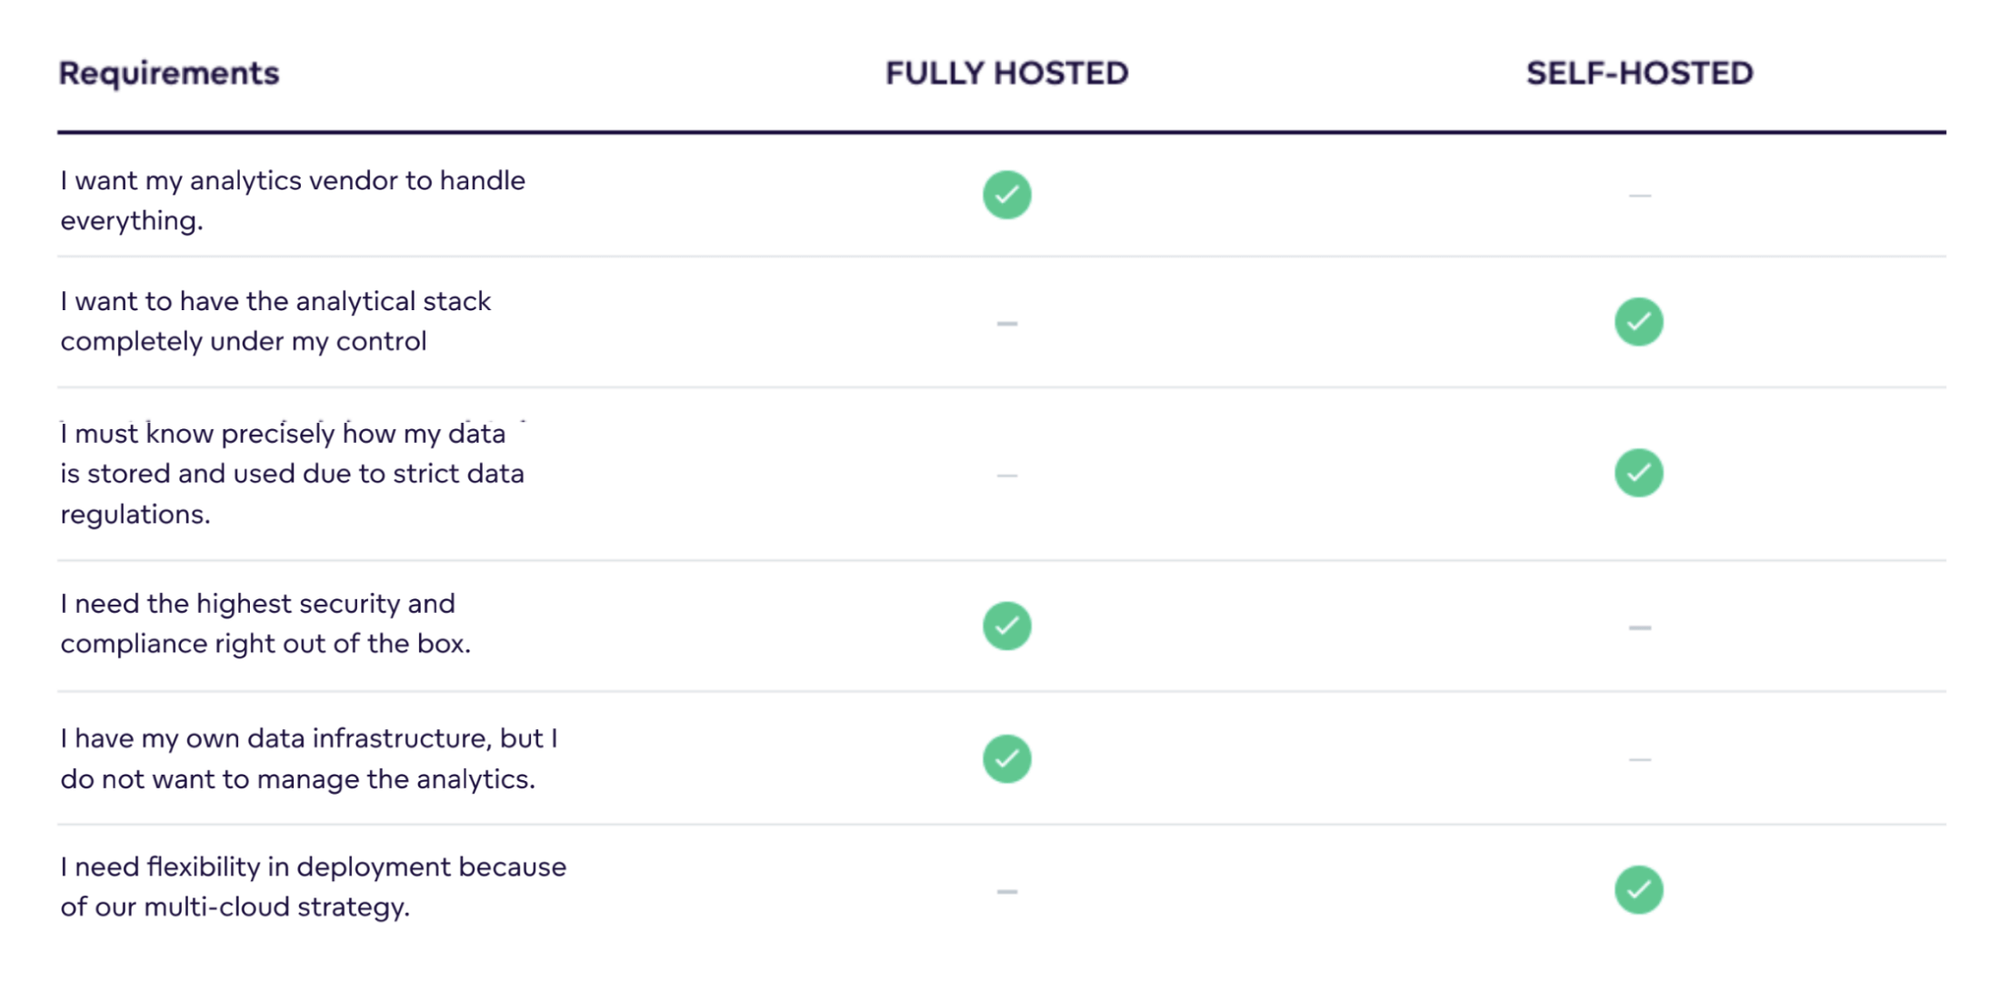
Security
Security requirements affect the business of almost every globally operating company. SOC 2 certificate, compliance with GDPR (inc. Article 9), CCPA, PII, HIPAA, and others should therefore be part of your BI tool selection criteria. As such, when choosing a new BI platform, the vendor should be able to detail how these areas are covered.

5. Other Factors to Consider During BI Software Evaluation
Future Maintenance Requirements
Closely related to scalability is the question of whether the BI software offers any set of automation tools that will help with the management and maintenance of individual users, user groups, and even changes to the data analytics itself. This will have an impact on the time and money it will take to manage the BI platform efficiently, which processes can be streamlined, and at what cost.
Such tools, often called lifecycle management, can automate the provisioning and de-provisioning of users, their access roles, new customer instances, or data. Moreover, these tools will help you to manage the roll-out of updates and new versions to your user base, while taking into account any user-made customizations that could be affected by these updates.
Lifecycle automation is especially important in large analytical environments when rolling out a single change to hundreds of customers manually (such as when using separate instances of the BI tool)in order to prevent endless manual work.
Speed of Implementation
Examining the speed with which your data analytics solution can be delivered will have an impact on your time-to-market and ability to deliver a minimum viable solution. Instead of having to wait for several months to have your end-to-end implementation ready (when provided by the BI software vendor), examine whether self-service implementation, carried out by your developers, is an option. This could make for a quicker MVP rollout.
Evaluators and Evaluation Process
Evaluators
Typically, your evaluators will be divided into three main categories: business users, data engineers, and developers.
Business Users
Business users are the ones for whom the BI tool user experience will be most important as they will likely need to find answers to their ad-hoc questions quickly without worrying about the underlying mathematical and statistical computations. For this audience, access to data analytics within their workflow, with an easy-to-use interface and drag-and-drop functionality, will be crucial.
Data Engineers and Analysts
These more tech-savvy evaluators will appreciate it if the platform provides access to a strong underlying query language that will ensure the results derived from data are reliable and consistent, and that new metrics can be easily composed and reused. Some other requirements may include access to open APIs and flexibility in terms of data connectivity.
Developers
Finally, the last group to mention is that of developers. To satisfy their requirements in the long term, the platform you select should offer a dedicated SDK with a set of low-code/no-code tools for the development of customized and interactive analytical applications. Applications that will be seamlessly integrated within your company’s existing ones.
Evaluation Process
Your BI software evaluation process should involve:
Discovery
Search for online comparisons, BI providers’ websites (with product information), and peer opinions in order to compose a list of BI tools that you would like to evaluate for your use case. That will bring you to a more select list, which leads to the next evaluation step.
Demo Calls
Contact your shortlisted BI providers so as to get to know their platforms in more detail. The first demo call will usually involve an expert sales representative giving you a guided tour of the tool as well as answering your questions.
The representative will likely ask you about your use case and the intended purpose of the solution. This will help them to better guide you; in terms of whether the BI tool could be a good fit. Assuming you both feel the platform has the potential to provide the right solution for your use case, then more demo calls will likely follow in order to cater for more in-depth evaluation and more technical questions. This is the most common process.
Proof of Concept
If your use case is more complex, the demo calls mentioned above may well lead to a proof of concept: a demonstration of the BI tool tailored specifically to your use case, working with your data and inputs. NDAs and more robust evaluations can also form part of this stage.
How To Choose a BI Tool: Additional Resources
If you have more questions, then you might find the following resources helpful:
- For a more detailed analysis of the specific benefits offered by key players in the market, check out our companion articles: Sisense Alternative, Tableau Alternative, Qlik Alternative, and AWS QuickSight Alternative.
- Looking to integrate analytics into your application or web portal? Read our “Starter Guide: Embedded Analytics in Your Software Product”
Alternatively, our team is always available to answer your questions and help you evaluate whether GoodData’s analytics solution could fit your specific needs. GoodData supports all the use cases mentioned in this e-book.
About GoodData
GoodData powers modern BI for the modern data stack. GoodData’s composable data and analytics platform provides a single source of truth across organizations and to their customers. To this day, GoodData has helped more than 140,000 of the world’s top businesses deliver on their analytics goals and scale their data use cases — from self-service and embeddable analytics, to machine learning and IoT.
GoodData has teams in the U.S., Europe, and Asia, with customers including leading software companies (SaaS), global financial and payment institutions, and multi-brand e-commerce platforms.
Enjoy this article as well as all of our content.
Trusted by


Does GoodData look like the better fit?
Get a demo now and see for yourself. It’s commitment-free.