


Deploy in GoodData Cloud
GoodData Cloud is a SaaS product operated and maintained by us. Customers receive continuous code updates and it can be deployed in AWS, Azure, and multi-region.
Self-service, reporting, embedding, and data modeling in one modular analytics platform.
Model, distribute, and visualize data.
Enable data visualization for all
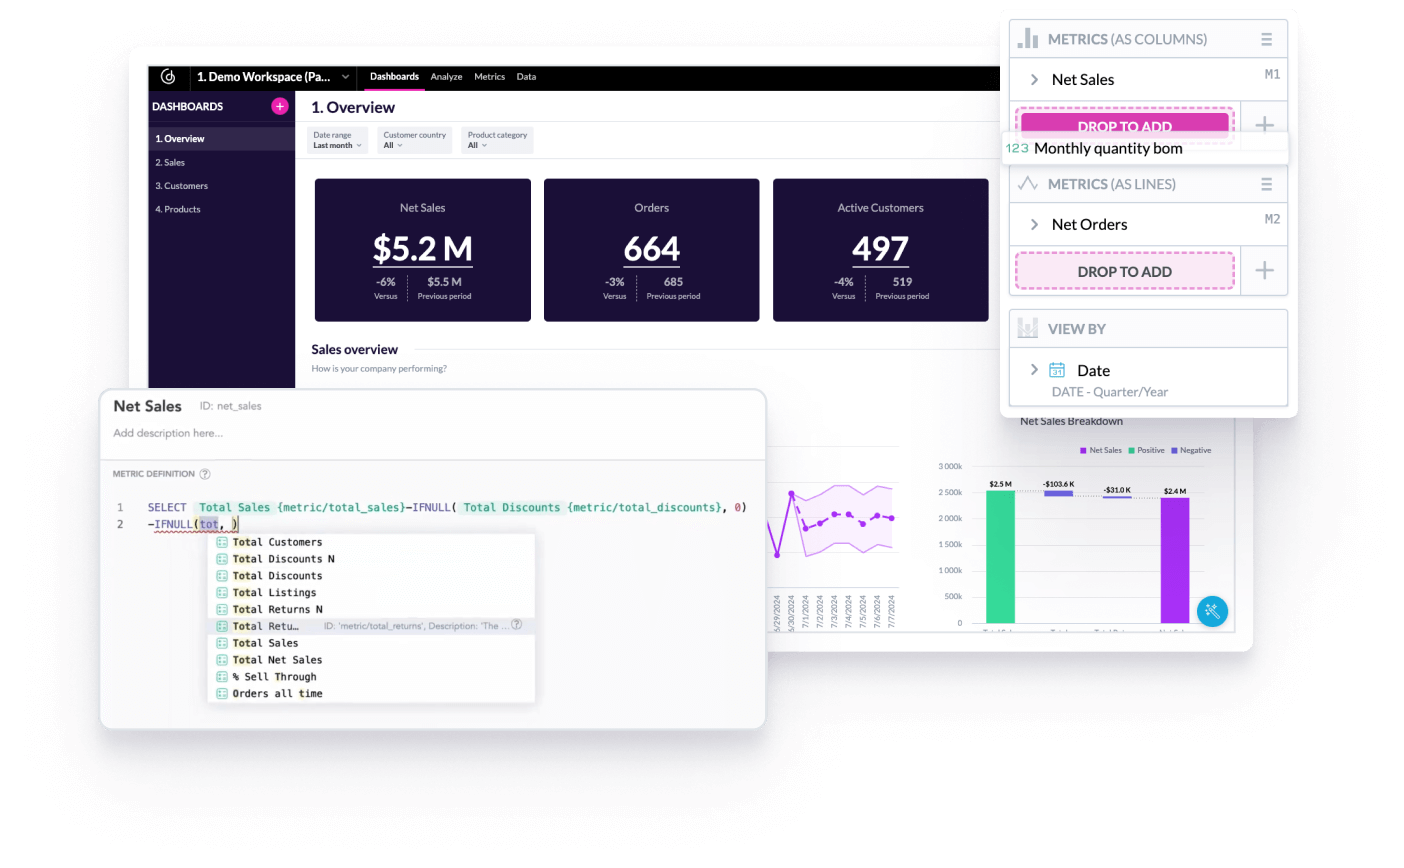
Tailor the content creation experience to the skills and interests of the user. Professional report authors to self-service users can create and customize with drag-and-drop or code-based UI.
Build once and scale infinitely
Centralize and customize data models, ensuring consistent metrics and seamless data governance across thousands of tenants.

Seamlessly integrate in your software
Deliver personalized, interactive analytics and integrate self-service capabilities directly in your application. Embed via React SDK, iFrame, or Web Components.
GoodData BI for data-driven decision-making


GoodData Cloud is a SaaS product operated and maintained by us. Customers receive continuous code updates and it can be deployed in AWS, Azure, and multi-region.



Self-hosted uses the same codebase as GoodData Cloud and is ideal for users needing enhanced security, governance, or control for data residency or regulatory compliance.



Open APIs and declarative SDKs — connect to code repositories and 3rd-party apps, embed anywhere.


Trusted analytics — certifications, inherited permissions, and cascading content changes for easy admin.


Accessible analytics — ensuring compliance and delivering inclusive experiences.








User-friendly drag-and-drop tool for creating custom visualizations and dashboards with real-time previews.
Empower business users to explore data, create reports, and uncover insights independently.
Centrally define reusable and governed metrics to ensure consistency across all reports and dashboards.
Effortlessly build customized data products for thousands of customers while ensuring secure data access, cascading changes, and easy administration.
Automate report delivery and set alerts for key metric thresholds to stay proactive with data insights.
Gain a snapshot of future predicted trends by incorporating a forecast to new or existing visualizations.
Combine data from multiple sources within reports for more comprehensive analysis without data movement.
Ready-to-tailor analytics solutions for specific use case.