Programmatic Embedding: Advanced Method of Embedded Analytics
4 min read | Published

Embedded analytics enables you to incorporate your data analytics into your application and web portal. The iframe used to be the go-to method for making charts and visuals part of your application, but over the years, technology has evolved to offer other options. One of these is programmatic embedding, an advanced embedding method that allows you to display analytics in any way you can imagine, and code features that previously only existed in your dreams.
Advanced Embedded Analytics vs. Traditional Methods
When embedding analytics, you have two options, depending on your use case.
- Use out-of-the-box charts to display your data.
- Create a custom-made visualization based on your requirements.
Most embedding methods offer the first option, where you need to sign in to the analytics platform before you start embedding and pre-build your dashboards and reports with drag-and-drop.
Programmatic embedding offers both options and manages the analytics via code. You can either use permanent components, choose a chart type and adjust it to your needs, or create your own custom visualization via code using raw data. In any case, there is no need to sign in to the analytics platform. To work with the data, you can use React SDK, Python, or REST APIs.
Custom Visualizations and Their Native Integration
What makes programmatic embedding interesting is that developers can code both the look and behavior of a visualization. You define how the visualization is going to render in the UI and define all the functionalities based on your requirements – without the limitations of the analytics platform. The visualization can take any shape you imagine and include any button you choose. It reflects the context of the application you're integrating it with; in terms of design, target audience, type of product, and more. The result? A dynamic and context-aware visualization.
Moreover, you can set the visualization to trigger an action in your application or web portal. Changes in the embedded visualization settings might affect the information displayed in the application, for example, after applying the filter setting, some parts of the website might hide or show. This functionality also works the other way around. An action applied in the application by the end user may be reflected in the embedded visualization, for example, when a button is clicked, or a different page is opened. Programmatic embedding offers unlimited options for configuring the communication between the visualization and the application.
With programmatic embedding, you use only SDK and API calls to communicate with your application/web portal and everything is built directly via code. The SDK provided by the analytics vendor will fetch pre-built code for visualizations that you can manipulate further. The pre-built code is used to shape the visualization: i.e., chart type, size, color, the variables you want to display, and more. In the code, you will also define the theme of your visualizations (background colors, fonts, etc.) and any other features.
From the perspective of interactivity for end-users, there are no standard features. End-users might interact with every feature that you, as a developer, code.
Experience GoodData in Action
Fully managed, embedded analytics platform. Get instant access — no installation or credit card required.
Explore product toursA Simple Example of How to Embed With Advanced Analytics
If you are curious about the most flexible embedding option, this section offers an example of how to manage visualizations as code. Note, that the process might differ depending on the desired behavior of the custom visualization.
- Set up an SDK package developed for the analytics platform you are working with. Choose the SDK that is native to the application or web portal you are embedding into. After you set it up, connect the SDK to your application.
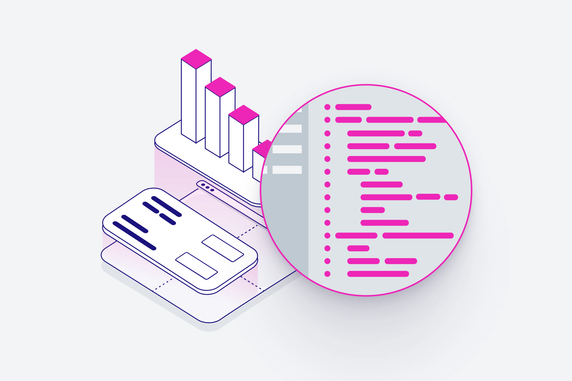
- The code snippet below demonstrates a generic example of what the code looks like when creating a custom visualization.
After connecting the SDK to your application, place the command in the code, asking for the data you want to display.
You first set a command asking for the data you are going to work with (see the section following “Execute” in the example below). In response, you get the data back (“Execution”). Once you have the data, you can specify how you want the visualization to be rendered. You can set a chart type, size, color, and whatever else you need (see the section following “Return”).

In general, with custom “Executions” you can build any chart you want and use any library you choose (not only the library provided by your analytics platform vendor). Click here to view an interactive code example of a custom visualization that you can build with SDK.

Custom visualization Save the adjusted code and your visualization will embed into your application, as shown below.

Embedded custom visualization Final Thoughts on Programmatic Embedding
Programmatic embedding is designed for skilled developers. It offers top-notch efficiency, seamless interactivity, and a high level of security. You can extend your visualization with the thousands of third-party controls and charting libraries available. If you have very specific requirements and need to create customized visualizations, this is the method for you.
Ready To Try Embedding Analytics for Yourself?
Are you planning on embedding analytics into an app or portal but unsure which embedding method is right for you? Check out our e-book or "How to embed with GoodData" video. Alternatively, sign up for a free trial to see first-hand what GoodData's embedded analytics platform can do!
Experience GoodData in Action
Fully managed, embedded analytics platform. Get instant access — no installation or credit card required.
Explore product tours