Embed Visualizations Using Iframes
An iframe is used to display a web content from one website inside another website. You can use iframes to embed your dashboards and Analytical Designer inside your web applications.
Embed Dashboards
To embed a dashboard into your web application, copy the following iframe snippet into your web app and subtitute your own values for <host_url>, <workspace_id> and <dashboard_id>:
<iframe
    title="My Embedded GoodData Dashboard"
    id="embedded-app-frame"
    src="<host_url>/dashboards/embedded/#/workspace/<workspace_id>/dashboard/<dashboard_id>"
    height="500px"
    width="100%"
    frameborder="0"
></iframe>
For more details on how to embed, configure, authenticate and control embedded dashboards, see Embed Dashboards Using Iframes.
Generate an Iframe Snippet Automatically
You can also generate an iframe code snippet automatically from your dashboard’s web UI.
Steps:
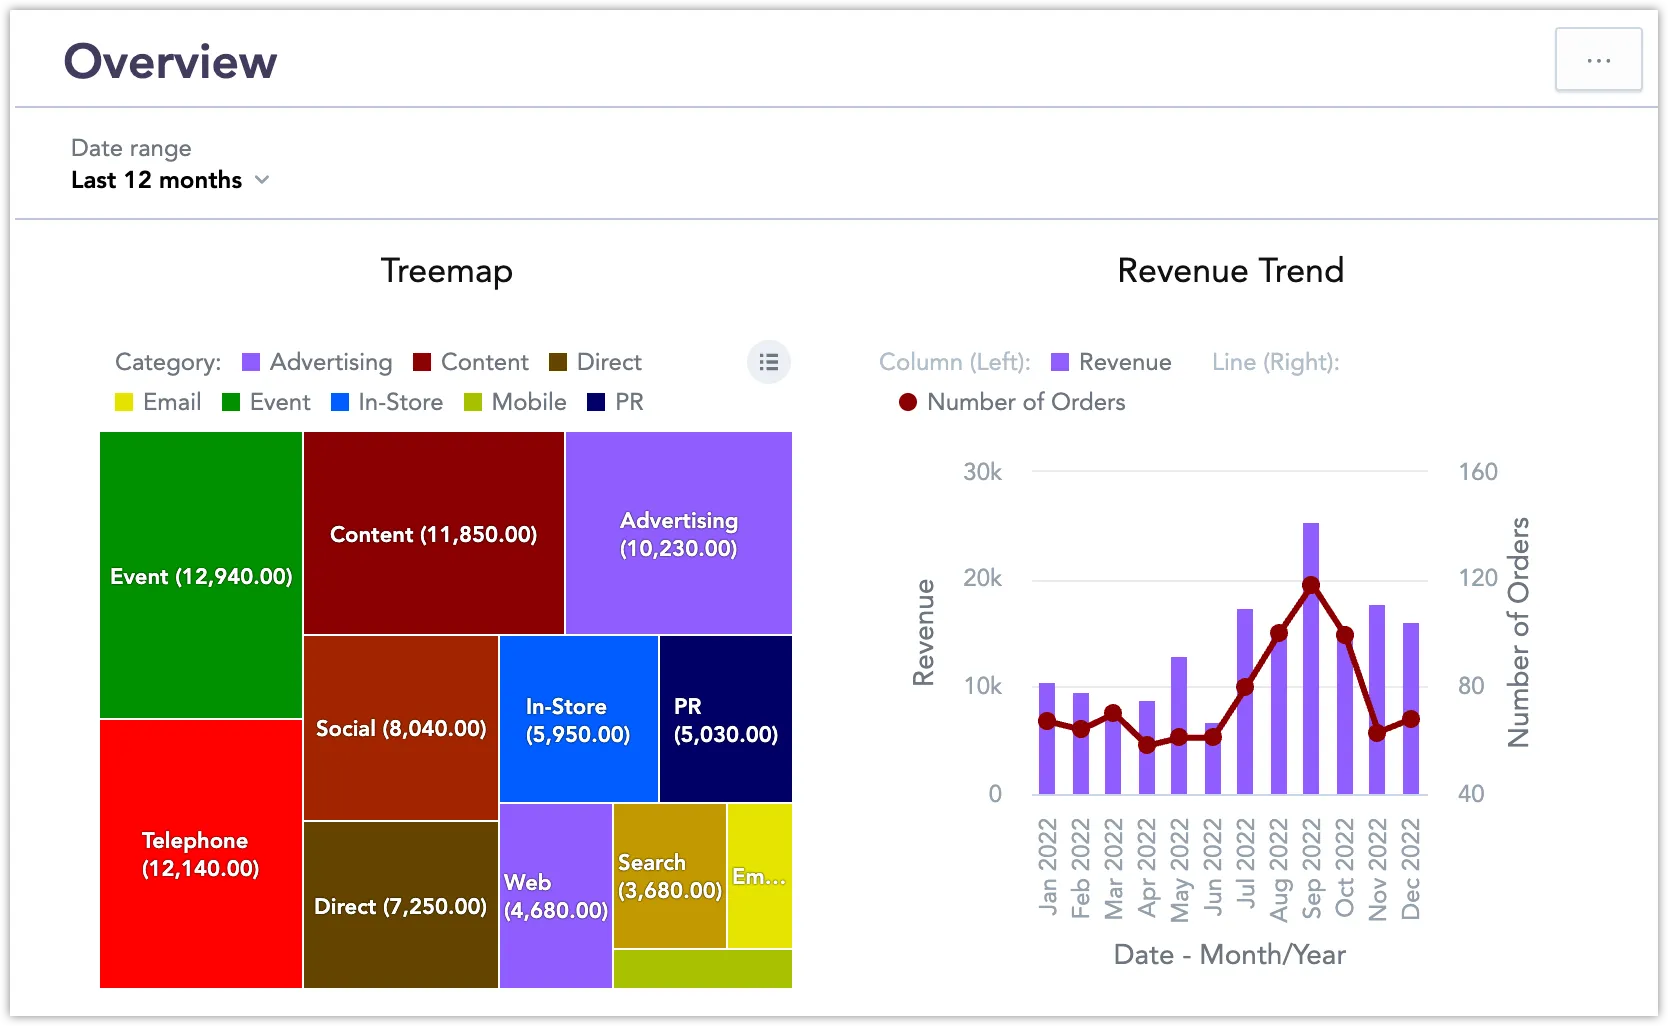
Open the dashboard you want to embed.
Click the </> button in the top right corner.
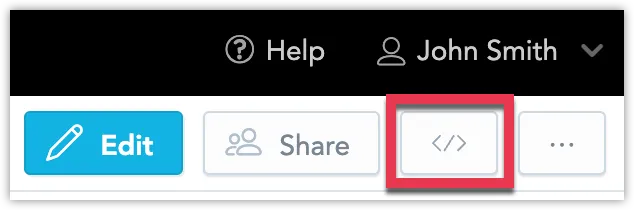
The embedding dialog opens.
Select Iframe.
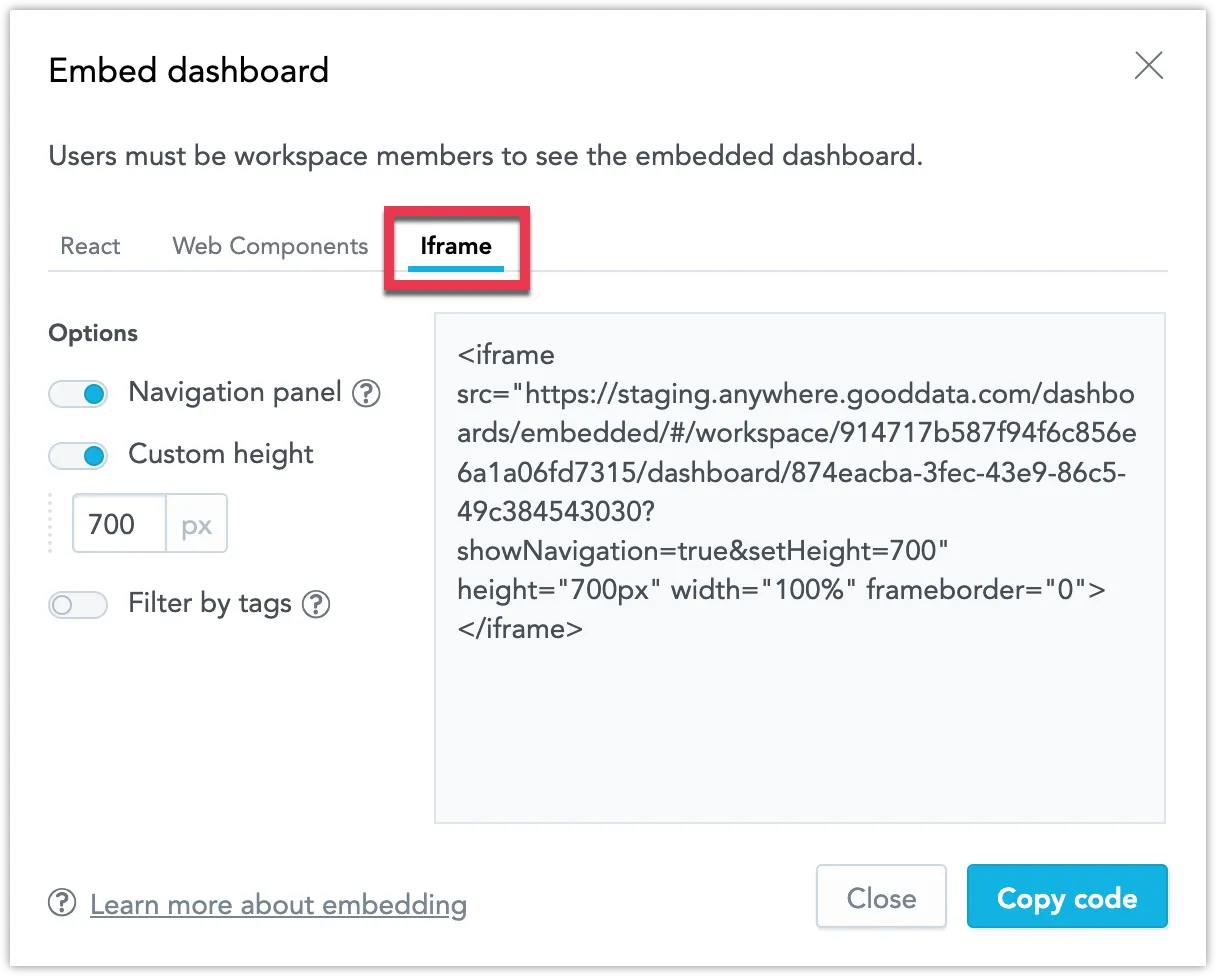
Click Copy code to copy the iframe code snippet to your clipboard.
You can now use the code snippet to embed the dashboard into your web application.
Embed Analytical Designer
To embed a Analytical Designer into your web application, copy the following iframe snippet into your web app and subtitute your own values for <host_url> and <workspace_id>:
<iframe
    title="My Embedded GoodData Analytical Designer"
    id="embedded-app-frame"
    src="<host_url>/analyze/embedded/#/<workspace_id>"
    height="500px"
    width="100%"
    frameborder="0"
></iframe>
For more details on how to embed, configure, authenticate and control embedded Analytical Designer, see Embed Analytical Designer Using Iframes.