How To Use AI for Data Visualizations and Dashboards
5 min read | Published

Summary
AI is changing the way teams interact with data by making visualizations and dashboards faster, smarter, and easier to use. Instead of relying on manual analysis, users can ask plain-language questions and instantly get charts, tables, or insights.
This article explores how AI features like natural language querying, smart search, anomaly detection, and automated insight generation are being built into modern analytics platforms. You’ll learn how these tools help teams move faster, reduce complexity, and make better decisions with less effort.
The fundamentals of AI data visualization and dashboards
We are entering a world where AI dashboards not only present information but anticipate your needs, talk back to you, and empower you to make decisions with unprecedented precision.
Harnessing machine learning algorithms, AI can identify relevant insights, recommend visualization types, and optimize your dashboard layout for maximum impact. This fusion of analytics and artificial intelligence ensures that your dashboards are not static entities but living, responsive tools that adapt to changing data landscapes.
To understand how to use AI in dashboards and data visualizations it is important to know some key terms. These may sound complicated, but when connected to their function they’re actually quite straightforward.
Natural Language Generation (NLG)
Natural Language Generation (NLG) is an AI-powered software process that creates written or spoken language from complex data. This means sprawling datasets can be automatically transformed into easy-to-read reports and summaries that anyone can understand.
A good analytics tool may go a step further than providing reports and summaries for non-tech users, offering written or spoken analysis of what’s driving the figures you’re seeing in your dashboards and visualizations. This is a game-changer when it comes to decision-making, as it means end users can quickly draw conclusions from the data without needing to be tech-savvy.
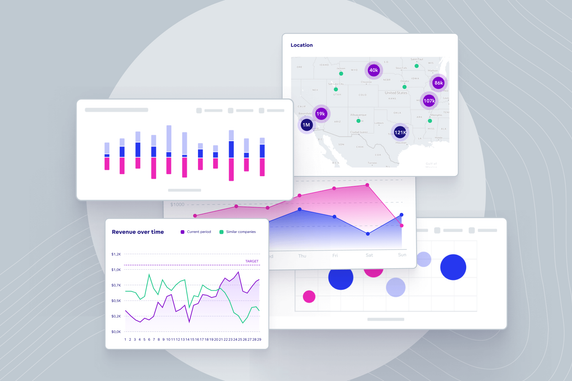
The GoodData platform provides AI-powered explanations of what is driving the values in your dashboards and visualizations. This is an example of Natural Language Generation (NLG).
Natural Language Querying (NLQ)
NLQ is closely connected to NLG. It refers to the process of translating your questions into database queries and providing answers in the relevant format. The most obvious example of NLQ is an AI chatbot, now becoming readily available in modern analytics tools.
An executive who wants to know how many sales they’ve made this month compared to last month no longer needs to create metrics and dashboards themselves. They simply type the question into the AI chatbot (“Give me a bar chart that shows how this month’s sales compare to last month’s sales”). And voila, the chatbot provides the answer.
This feature not only empowers non-tech users to explore and analyze their data but also allows them to request new visualizations or use AI to create great dashboards.
Together, NLG and NLQ spell the end of complicated query languages and database complexity. Gone are the days of staring at static visualizations. Users can now interact with and explore the data in ways they’ve never been able to before, which is why there is so much talk about how AI is spearheading the data analytics revolution.
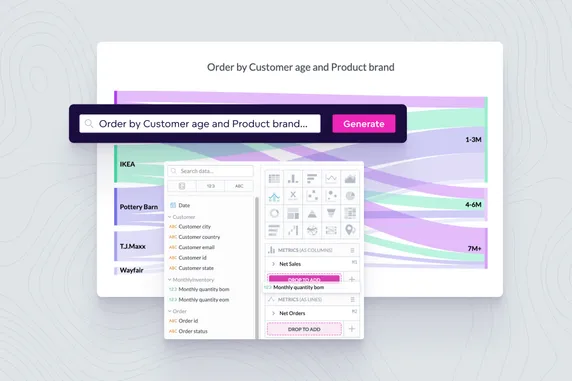
GoodData’s AI Assistant allows users to ask questions of their data, automatically create AI visualizations, and discover new insights using natural language.
Predictive analysis
Predictive analysis is another exciting development when it comes to using AI for data visualizations and dashboards. By analyzing historical data, AI can predict potential trends and patterns. For example, after comparing sales from this month to last month, a sales executive might ask the chatbot to analyze the data and report back on how many sales they can expect in the next quarter. These results can then be added to the current visualization to show where sales are headed at a glance. With AI, all of this is possible without the need to understand complex predictive modeling techniques like linear regressions or neural networks.
The impact of predictive analysis cannot be overstated. It allows you to see into the future, giving a whole new meaning to the phrase data-driven decision-making and making it easier than ever to introduce and instigate a true data culture.
GoodData’s forecasting tool allows users to predict trends for key business metrics for the next month, quarter, and year.
Anomaly detection
Anomaly detection is another example of how AI can provide a deeper analysis of your dashboard data. Think of this feature as your data's private detective. With the help of AI, it spots unusual stuff in your dashboard information. But it doesn't stop there — it goes Sherlock-Holmes-level detective and tells you why these oddities happen. So, instead of just knowing something's ‘off,’ you get the whole story. This AI-powered feature is like having a data sidekick that ensures that you really understand what's going on in your data. It's all about getting a clearer and more accurate picture so you can make smarter decisions.
AI anomaly detection in the GoodData platform.
Tools and platforms for AI data visualization and dashboards
Incorporating useful AI features into your dashboards and visualizations is not as simple as buying an AI dashboard generator. If you’re serious about getting the most out of your data (and want to be sure you can trust it), you’ll need a modern tool with AI capabilities.
So far, we’ve only discussed AI’s impact on the frontend, such as, how end users can benefit from the latest AI data visualization tools. However, we should also touch upon the technical requirements for accessing these features.
To understand, summarize, detect anomalies, and make predictions about your data, you’ll need a tool that integrates Large Language Models (LLMs). And, because LLMs cannot offer answers to non-tech users, it’s important that your solution has a robust semantic layer to help convert everything into user-friendly terms.
Tools and platforms with built-in AI capabilities can also help developers to design and configure analytics. This can make the initial setup (and maintenance) faster and more productive, and lead to greater cost savings and quicker time to value.
Want to see what GoodData can do for you?
Get a guided tour and ask us about GoodData’s features, implementation, and pricing.
Request a demoChallenges and considerations when using AI for data visualizations and dashboards
While the idea of AI-generated dashboards and automation is exciting, there are also significant challenges. A key hurdle is ensuring the accuracy and reliability of the AI algorithms powering these visualizations. As data is inherently dynamic, the models must adapt to evolving trends and patterns. Striking the right balance between responsiveness and stability will remain a constant challenge going forward.
Additionally, there's the issue of interpretability. As AI systems become more complex, explaining the rationale behind visual insights becomes crucial for user trust. The potential for bias in AI algorithms demands constant vigilance to prevent unintentional discrimination.
Lastly, there is the possibility for AI to ‘hallucinate’ — that is, produce results that are not accurate or understandable to the user. Mitigating this risk is possible by limiting the context being fed to the LLM to the most relevant context available. Using a data stack with a strong semantic model, for example, is one way to provide the right context to the AI engine and manage this risk.
For these reasons, embracing AI in data visualizations and dashboards demands a thoughtful and measured approach, where the benefits are maximized, and the risks are mitigated through robust testing and transparent communication.
Concluding thoughts on using AI for data visualizations and dashboards
The integration of AI into data visualizations and dashboards opens the door to a transformative era in analytics. The fundamentals of NLG and NLQ democratize data access, allowing users without technical expertise to dynamically interact with and explore data. Predictive analysis offers a glimpse into the future, and tools like anomaly detection provide a deeper understanding of data.
However, these advancements are not without challenges. Ensuring the accuracy and interpretability of AI algorithms, addressing potential biases, and maintaining user trust are crucial considerations. And, while the technology is exciting, we should remember the basic best practices for creating data visualizations and dashboards remain.
Feel free to request a demo to discover how the GoodData analytics platform is navigating this evolving landscape and equipping users and analytics builders with AI-powered tools.
Want to go a step further and test out these features yourself? Sign up for GoodData Labs, a space where you can test and experience advanced analytics ideas and features that are currently in development.
Want to see what GoodData can do for you?
Get a guided tour and ask us about GoodData’s features, implementation, and pricing.
Request a demoFAQs About Using AI for Data Visualizations and Dashboards
AI analyzes the structure and content of your dataset and recommends appropriate chart types or layouts, ensuring the visuals communicate insights effectively without manual guesswork.
Natural language querying allows users to type or say questions in everyday language. The system converts this into data queries and returns visuals, making data interaction intuitive even for non-technical users.
AI monitors your data streams for unusual patterns or outliers and automatically flags them within visualizations, helping users spot issues or trends that may require deeper investigation.
Yes. Natural Language Generation (NLG) produces plain-language summaries of key drivers and trends in your data, making interpretation accessible and actionable for all users.
Smart search helps users quickly locate dashboards, metrics, and reports using synonyms or fuzzy matching. It aligns search results with your business terminology and data model, improving discoverability and usability.
If not trained or configured properly, AI models may introduce biased or misleading results. Ensuring transparency, explainability, and governance is essential for trustworthy insights.