What Is AI in Data Analytics?
10 min read | Published

Summary
The article explains how artificial intelligence (AI) is being integrated into analytics to move beyond simply reporting what has happened. It shows how AI can uncover why something happened, predict what will happen, and automate insights for faster, more accurate decision-making. The discussion covers how AI enhances both user and developer experiences by enabling natural language interactions, simplifying analytics setup, and building intelligence directly into analytics systems to create a competitive advantage.
The Challenge Facing Modern Analytics
Data serves as a driving force for businesses, helping to guide their future decisions based on current performance. First, this data must be appropriately transformed into the correct format for users to create various visualizations and meaningful dashboards. Then, as the business grows, companies need the capability to deal with the increased data volume and extended user base. It’s crucial that they find ways to quickly extract important information from all this data and give customers the analytics they need. Achieving this can be a challenge because the tools they rely on struggle to keep up, making it difficult to get the right information at the right time.
In response to this challenge, software developers are seeking smart solutions to resolve analytics weaknesses. Today, all industries are figuring out how artificial intelligence (AI) can be adapted to suit their needs in the most efficient way — and analytics and BI providers are no different.
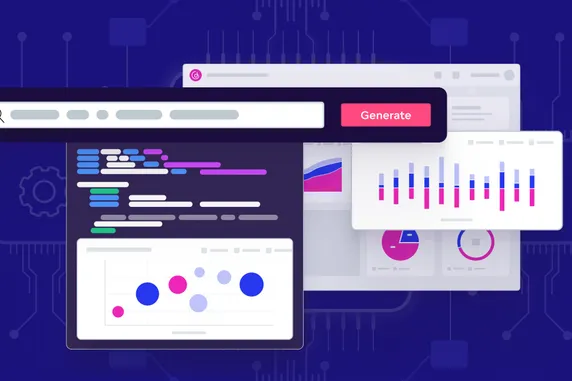
Employing AI in analytics is a revolutionary step as it brings simplicity and automation to data analysis. It not only aids business users, allowing them to use AI for dashboards and visualizations, but supports developers in managing their analytics interfaces and processes.
What Is AI in Data Analytics?
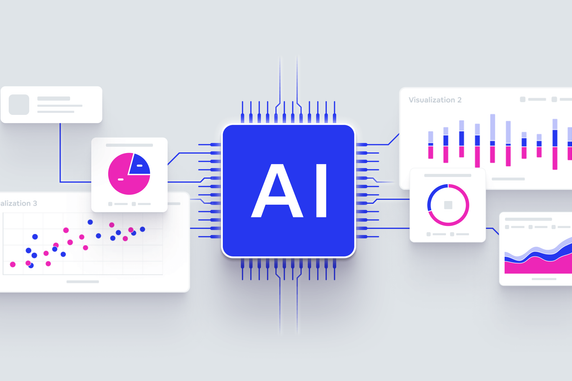
AI is used to enhance current analytics solutions, from analyzing raw data to gaining valuable information for decision-making. It enables the generation of actionable insights, the automation of processes, and alignment with predictive analytics — and is ushering in a whole new set of capabilities that will revolutionize data exploration and how analytics are set up. AI in analytics doesn’t just find answers to "what happened," it investigates further to understand "why it happened." With more sophisticated algorithms it can then predict “what will happen” in the future, rather than just using the end user's knowledge to identify and explain insights.
Why Is AI in Data Analytics Important?
AI in analytics makes analytics-related processes faster and more automated for consumers and builders. Let’s look at why this is so important:
Better decision-making
With AI-driven analytics, users can make their decisions faster than before. They can type in their demands using natural language to get answers immediately, rather than creating insights or complex dashboards and drilling down into them.
The AI-powered responses carry hidden insights, such as discovering data relationships and patterns, and detecting anomalies. Businesses can use these insights to improve operations, optimize supply chains, enhance stakeholder relationships, elevate customer experiences, and more.
Simplified analytics solution development
AI simplifies the platform setup for developers and analytics engineers. It provides natural language instructions for tasks such as configuring the user interface, managing user permissions, and customization. This eliminates the need for manual configuration based on documentation or writing, and debugging complex structures of code.
Competitive advantage
Integrating AI into analytics can increase an analytics team’s productivity, as well as make the experience more comfortable for end users. A good AI-fueled analytics solution offers a competitive edge in all areas, providing support in managing the analytics setup (creating workspaces, making changes to logical data models, etc.), rather than simply helping users to extract detailed results from dashboards.
Components of AI in Data Analytics
When searching for a definition of AI in analytics, you might also bump into the term ‘augmented analytics’. Augmented analytics utilize technologies like machine learning and AI to assist in tasks such as data preparation and generating and explaining insights.
AI in analytics (as a subfield of augmented analytics) specifically focuses on using AI algorithms and machine learning models to improve various aspects of the analytics process. This comprises uncovering patterns, making predictions, and providing insights with the help of its commonly used parts:
- Machine learning (ML) uses algorithms and statistical models to analyze data. It makes predictions or decisions without any additional inputs on how to deal with specific tasks. In analytics, ML is trained on large datasets to identify hidden patterns, enabling it to make predictions about customer preferences, financial resources, and more. It then reuses and applies this knowledge to new data.
- Deep learning is a subset of machine learning. It focuses on neural networks with three or more layers. While these networks do not precisely replicate human brain behavior, they learn from vast data. Deep learning automates analytics tasks and enhances overall analytical capabilities.
- Natural language processing (NLP) is based on AI that uses technology to understand and work with human language. It helps machines to understand, interpret, and respond to human language patterns, allowing for more effective data analysis and communication by leveraging its subfields, such as Natural Language Generation (NLG), Natural Language Understanding (NLU), and Natural Language Querying (NLQ).

Most used subfields of AI in analytics
Users of AI in Data Analytics
An AI-powered analytics platform helps analytics builders to easily and quickly prepare an analytics interface. This is then delivered to the analytics consumers so that they can create metrics and insights — allowing them to make the best business decisions.
Who builds the analytics solution?
From a product perspective, the individuals responsible for configuring the analytics environment include builders such as developers, analytics engineers, BI analysts, and even product managers. These professionals manage crucial tasks to establish a robust and user-friendly analytics interface and make it possible for consumers to use the analytics.
The tasks of builders may include:
- Configuring and continuously managing the analytics environment
- Connecting data sources with the analytics
- Creating separate environments and mapping users to these interfaces
- Organizing users into user groups and managing their permissions
- Customizing the appearance of analytics environments, including branding, custom themes, and logos
- Implementing security measures to ensure data integrity, prevent unauthorized access, and maintain compliance with data protection regulations and policies
- Developing and managing new analytics features to meet users' demands via out-of-the-box solutions
- Integrating the analytics environments, dashboards, or insights within users' applications
Who consumes the analytics?
From the user perspective, consumers are the end users who actually benefit from the analytics. They rely on the insights and information generated by the analytics process to make informed decisions. These kinds of users usually:
- Create metrics, build visualizations, and assemble dashboards for real-time business performance tracking
- Customize dashboard views, apply filters for focused data analysis, and drill down as needed
- Interpret dashboards to identify strengths, weaknesses, and data connections
- Predict future outcomes and company performance
- Share dashboards and insights for improved interdepartmental collaboration
- Continuously monitor business results, identifying opportunities and threats
- Align business strategies with current performance to achieve desired outcomes
Foundations of AI in Data Analytics
To implement AI, an analytics platform must be built on some key foundations. An ‘as code approach’ is the most efficient, elegant, and developer-friendly way to achieve this.
Analytics as Code
Analytics as code allows users to create and manage analytics objects and functions using programming code. Instead of the traditional UI-based approach, ‘as code’ uses open APIs, Python SDK libraries (and other libraries), and various human-readable languages (YAML or JSON) to build and manage data analytics. As developers and engineers are familiar with programming languages they can achieve the desired outcomes. Thanks to a ‘built-on code’ approach, teams can easily collaborate using GitHub or GitLab, helping them to manage changes and versions, merge contributions, and track how analytics projects evolve over time.
This ‘as code’ concept of analytics architecture (also referred to as headless BI) is intended to facilitate seamless interaction and data consumption through various technologies. This includes interfaces like Jupyter and Dataiku for AI/ML purposes, as well as APIs, SDKs, and standard protocols. The approach is most important for developing AI within the analytics: when the whole platform is built “as code” it allows LLMs to be used on them.
Large Language Models
Large Language Models (LLMs) are advanced AI tools that utilize deep learning to understand extensive datasets, summarize information, generate content, and make predictions.
Analytics relies on a code-based structure, and while LLMs can work with this, they cannot provide answers to non-technical users. This is where the semantic layer comes in, converting technical expressions and metadata within the data model and metrics into user-friendly business terms, ensuring accessibility for non-technical users.

The position of the semantic layer
Since LLMs can understand various programming languages and different code structures, they are capable of interpreting natural language by converting it into structured commands or codes the analytics platform can understand. They assist in generating a code snippet for analytics builders (or modifying an existing one) to perform the desired operation, and provide an explanation or response to what users want to do in natural language.
How To Use AI in Data Analytics
AI can be implemented in various ways to enhance data analysis, generate insights, improve decision-making, and simplify the delivery of analytics to end users. Examples of how AI can be used include:
Natural Language Processing
Natural Language Processing (NLP) focuses on using computers to understand and work with human language. NLP is comprised of two main phases:
- Cleaning and preparing the data so it’s well organized and ready for analysis.
- Using algorithms to make sense of that data, i.e., training models to understand and process the text.
NLP covers a wide range of tasks, such as understanding what text means (NLU), generating text (NLG), and allowing people to ask questions in natural language (NLQ). It enables AI to understand human language, generate meaningful responses, and provide insights from text data.

NLP and its subfields
Natural Language Understanding
Natural Language Understanding (NLU) is a mechanism for understanding human language. In analytics, it is used to mine insights from unstructured text data, such as customer reviews and social media posts. By analyzing how language is structured and what it means, NLU helps to reveal feelings, subjects, and viewpoints.
Natural Language Generation
Natural Language Generation (NLG) acts as a data translator, transforming complex datasets into easy-to-read reports and summaries that anyone can understand. NLG is like having a skilled storyteller for your data: it generates plain-language explanations, tables, charts, and graphs to make the results accessible to a broader audience.
Tools like Arria can assist with this process by providing different ways to use NLG, such as summarizing and organizing information, identifying data trends, or accessing insights and further details via natural language.
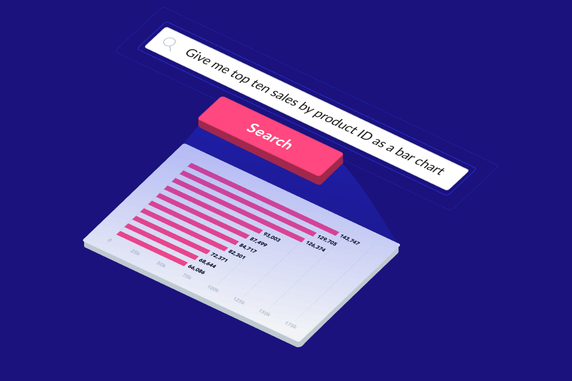
Natural Language Querying
Natural language querying (NLQ) is a layer of NLP that is also part of both NLU and NLG. NLQ refers to a process that translates questions in human language into database queries or data processing commands (for example, SQL queries, Python code, and more). It begins by understanding the users' demands, transforms these into a specific query, and finally provides clear results.
With NLQ, a user who wants to know how their business is performing needn’t create metrics individually, turn these into insights, and combine them into complex dashboards. It is enough to simply provide demands like “What is my current overall revenue?”, or “Give me revenue for each region in a bar chart” (or other relevant chart or graph).
NLQ empowers users without technical expertise to explore and analyze their data. It provides the information they require to make decisions, without the need to deal with complicated query languages or database complexity.

NLQ example
AI-enhanced predictive analytics
Predictive analytics involves analyzing historical data to make predictions about future events or outcomes. AI-powered predictive analytics takes this a step further. It incorporates AI algorithms and machine learning models to provide users with insights about potential future trends, behaviors, and patterns, and allows them to set up anomaly detection alerts. This enables users to make more informed decisions and take proactive action.
There are two options when using AI for predictive analytics:
- A standalone tool: This refers to a separate AI tool designed to complement existing analytics platforms. Users can integrate this tool into their workflow to enhance predictive capabilities with specific AI algorithms and models.
- A built-in feature: Some modern analytics platforms integrate AI and machine learning directly. They make AI-powered predictive analytics an integral part of the platform. Users can seamlessly access and use AI features within the platform interface, eliminating the need for external tool integration.
AI-enhanced analytics development
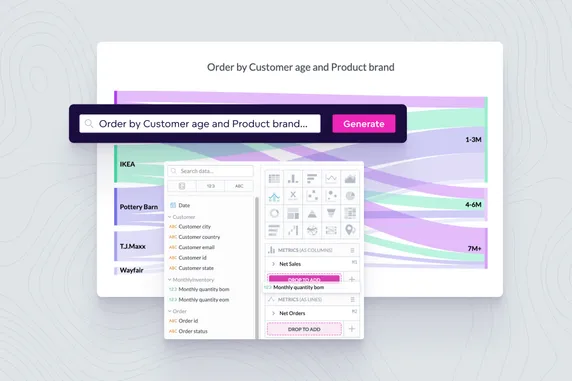
AI-enhanced analytics development represents a revolutionary step in setting up analytics. With built-in AI capabilities, developers can streamline processes using expressions in natural language, while creating the proper configuration by generating a code snippet that is ready for developers to use (or automatically executed).
This simplifies the initial setup process in relation to tasks such as connecting data sources, modifying logical data models, and managing users/user groups. It also provides basic customization configurations, such as changing the interface themes, color pallet, adding different insights, or even the logo.
So, AI-enhanced analytics doesn’t only simplify and speed up the initial analytics configuration, it also provides a more focused and personalized configuration experience.
Benefits of AI in Data Analytics
The main benefits of AI in analytics include:
Simplicity
Integrating AI into analytics streamlines the process of acquiring deep explanations of dashboard data, anomaly detection (and explanations for why these anomalies occur), and finding relationships between data. It enables users to express their requirements in natural language and makes the analytics easily scalable to end users. Technical expertise is not required, eliminating the need to consult technical experts or learning the fundamentals of analytics.
Productivity
For analytics consumers, AI speeds up results from large datasets without the need for expertise or user intervention. For analytics builders, AI streamlines processes, automates repetitive tasks (with minimal errors using AI-generated code snippets), and accelerates the development and delivery of analytics to end users.
These tasks no longer require time and effort in the initial setup and error detection phase. An "as code" approach makes it simple to manage the current version, including reverting to a previous one, making changes, and facilitates transparent team collaboration. The time saved can be spent improving the analytics and creating solutions that go beyond what analytics alone can achieve: while AI can be used for a basic analytics setup, it may not fulfill specific users' demands.
Improved decision-making
AI-driven analytics provides users with a more complete understanding of their data and business. It offers insights into data changes, relationships, and future predictions, including various internal and external factors.
AI enables anomaly detection and automatic alerts, helping companies to respond to opportunities and threats in advance. Areas for improvement and cost optimization are identified, supporting business growth.
Enhanced user experience
AI plays a crucial role in improving customer interactions. It facilitates predictive analytics, NLP, and AI-enhanced development to meet both consumer and developer needs. AI helps companies to understand customer preferences and behaviors, enabling them to create customized products and services.
AI in Data Analytics Use Cases
Today, all industries use data for their decision-making. To access the right data, they use AI-powered analytics in various forms.
E-commerce
AI helps retail companies gain valuable insights about their customers, as well as analyze inventory, market trends, and competitors to improve their operations and strategies.
More specifically, this can mean:
- Optimizing inventory by analyzing product sales frequency (to determine when to restock), and selecting vendors.
- Utilizing customer data for product promotion, discount strategies, and catering to customer preferences.
- Staying updated on market shifts and competitor offerings to refine product ranges.
Finance
AI in analytics can be used in the financial industry to provide tailored services and products. By analyzing vast amounts of financial data, AI helps to identify investment opportunities and trends that may not be obvious through traditional analysis methods. In addition, AI-driven automation can streamline various financial processes, reduce operational costs, and improve overall efficiency.
Insurance
AI-powered analytics helps insurance companies to detect and prevent fraud. These firms work with huge amounts of data gathered from various applications and Internet of Things (IOT) devices (sensors, gadgets, machines, and more). Traditional analytics technologies may not uncover the hidden patterns that can be important to mitigate risks. This AI-enhanced technology equips insurers with the necessary tools to stay one step ahead in securing their operations and ensures the integrity of their services.
Healthcare
AI-driven analytics enhances decision-making for healthcare providers in two key areas:
- Personalized treatment plans. Among other things, such plans consider a patient’s current condition, genetics, and medical history. Once this data has been collected, traditional analytics will find it hard to analyze: important patterns and hidden relationships can be easily missed. ML technologies, NLG, deep learning, and other AI methods can be used to reveal patterns and make deeper analysis and predictions.
- Disease detection. AI-enhanced predictive analytics, deep learning, and other methods can be used on large volumes of anonymized patient health data to recognize patterns. This can lead to the early identification of disease symptoms.
Learn More About AI in Data Analytics
Check out some of our other resources to learn more about AI in analytics and how it can benefit you:
Data Analytics and Machine Learning Integration
Enhancing GoodData’s Semantic Layer With Natural Language
How To Integrate Analytics To Slack With the Help of ChatGPT
AI in Data Analytics FAQs
AI algorithms can detect patterns and anomalies in data, making it easier to identify the underlying causes rather than only presenting the results.
Machine learning models analyze historical data to identify trends that can forecast likely results, allowing organizations to prepare for future scenarios.
AI tools allow users to ask questions in everyday language and receive instant answers or visualizations, removing the need for complex queries or manual dashboard creation.
It can automate tasks such as setting up interfaces, configuring permissions, and customizing features, which speeds up development and reduces manual work.
AI accelerates insight generation, improves the clarity of findings, and helps businesses adapt quickly to new challenges or opportunities.
When AI is guided by clear business objectives, it delivers insights that are relevant and actionable, leading to better decisions.