eBooks
The Best Embedded Analytics Tools in 2025: A Comparison of the Top Platforms and Solutions
19 min read | Published

About
Summary
The leading embedded analytics tools include GoodData, Tableau, Sisense, Looker, Microsoft Power BI, and Domo. These platforms enable organizations, SaaS providers, and product teams to embed business intelligence directly into their applications using APIs, customizable dashboards, and integrated data connections. In this ebook, we compare the top embedded analytics platforms, highlighting their features, scalability, and integration capabilities to help you find the best fit.
Click here to go directly to our comparison table of the top 12 solutions.
Key Benefits of an Embedded Analytics Solution
According to Explo, the key benefit of an embedded analytics solution is its ability to integrate real-time data insights directly into business applications and workflows. This allows users to make informed decisions without leaving the tools they already use.
Embedding dashboards, reports, and visualizations into existing applications:
- Improves decision-making with real-time, contextual insights.
- Boosts user adoption and engagement by keeping analytics within familiar workflows.
- Increases product value by making data a core part of the user experience.
From a business perspective, embedded analytics platforms:
- Differentiate products and improve customer retention by embedding insights directly into the user journey.
- Transform complex data into clear, actionable visuals that help teams track KPIs, identify trends, and uncover opportunities.
- Integrate seamlessly with APIs, cloud data warehouses, and on-premises systems to deliver a unified, reliable view of information.
This flexibility enables better collaboration, more advanced analysis, and faster, data-driven decisions across the organization.
How to Choose the Best Embedded Analytics Platform
Choosing the best embedded analytics platform means aligning technology, scalability, and user experience with your product strategy. Start by checking how well each solution integrates with your data architecture, then assess scalability, multitenancy, and deployment flexibility. Next, evaluate usability, customization, AI features, and security to ensure the platform meets both customer and compliance needs. Finally, review pricing and vendor support to confirm long-term sustainability.
A platform that combines strong performance, flexibility, and ease of use will deliver lasting value, turning analytics into a core strength of your product.
Key Capabilities to Look Out For
1. Ease of Integration
Integration determines how easily the analytics platform connects to your existing data and software. A good solution should fit into your current environment without heavy re-engineering.
What to look for:
- APIs and SDKs: Allow your developers to pull data or embed dashboards directly into your product.
- Prebuilt connectors: Speed up setup by linking to popular data sources such as Snowflake, BigQuery, Oracle, or Salesforce.
- Flexible data pipelines: Ensure your analytics can handle both live and scheduled data refreshes.
Fourth, for example, uses embedded analytics to integrate data from both its own systems and third-party sources like NCR and Oracle, achieving a unified analytics experience without needing to rebuild its infrastructure.
2. Scalability and Performance
Scalability means the platform can grow as your users, data, and workloads increase, without slowing down or crashing.
A scalable analytics platform should:
- Handle many users running reports or dashboards at once.
- Support large data volumes and real-time updates.
- Offer features like elastic scaling (automatically adjusting resources as needed) and in-memory processing for faster performance.
Read our ebook on Build vs. Buy Analytics Solutions for a closer look at how embedding vs. building affects scalability and maintenance.
3. Multitenancy
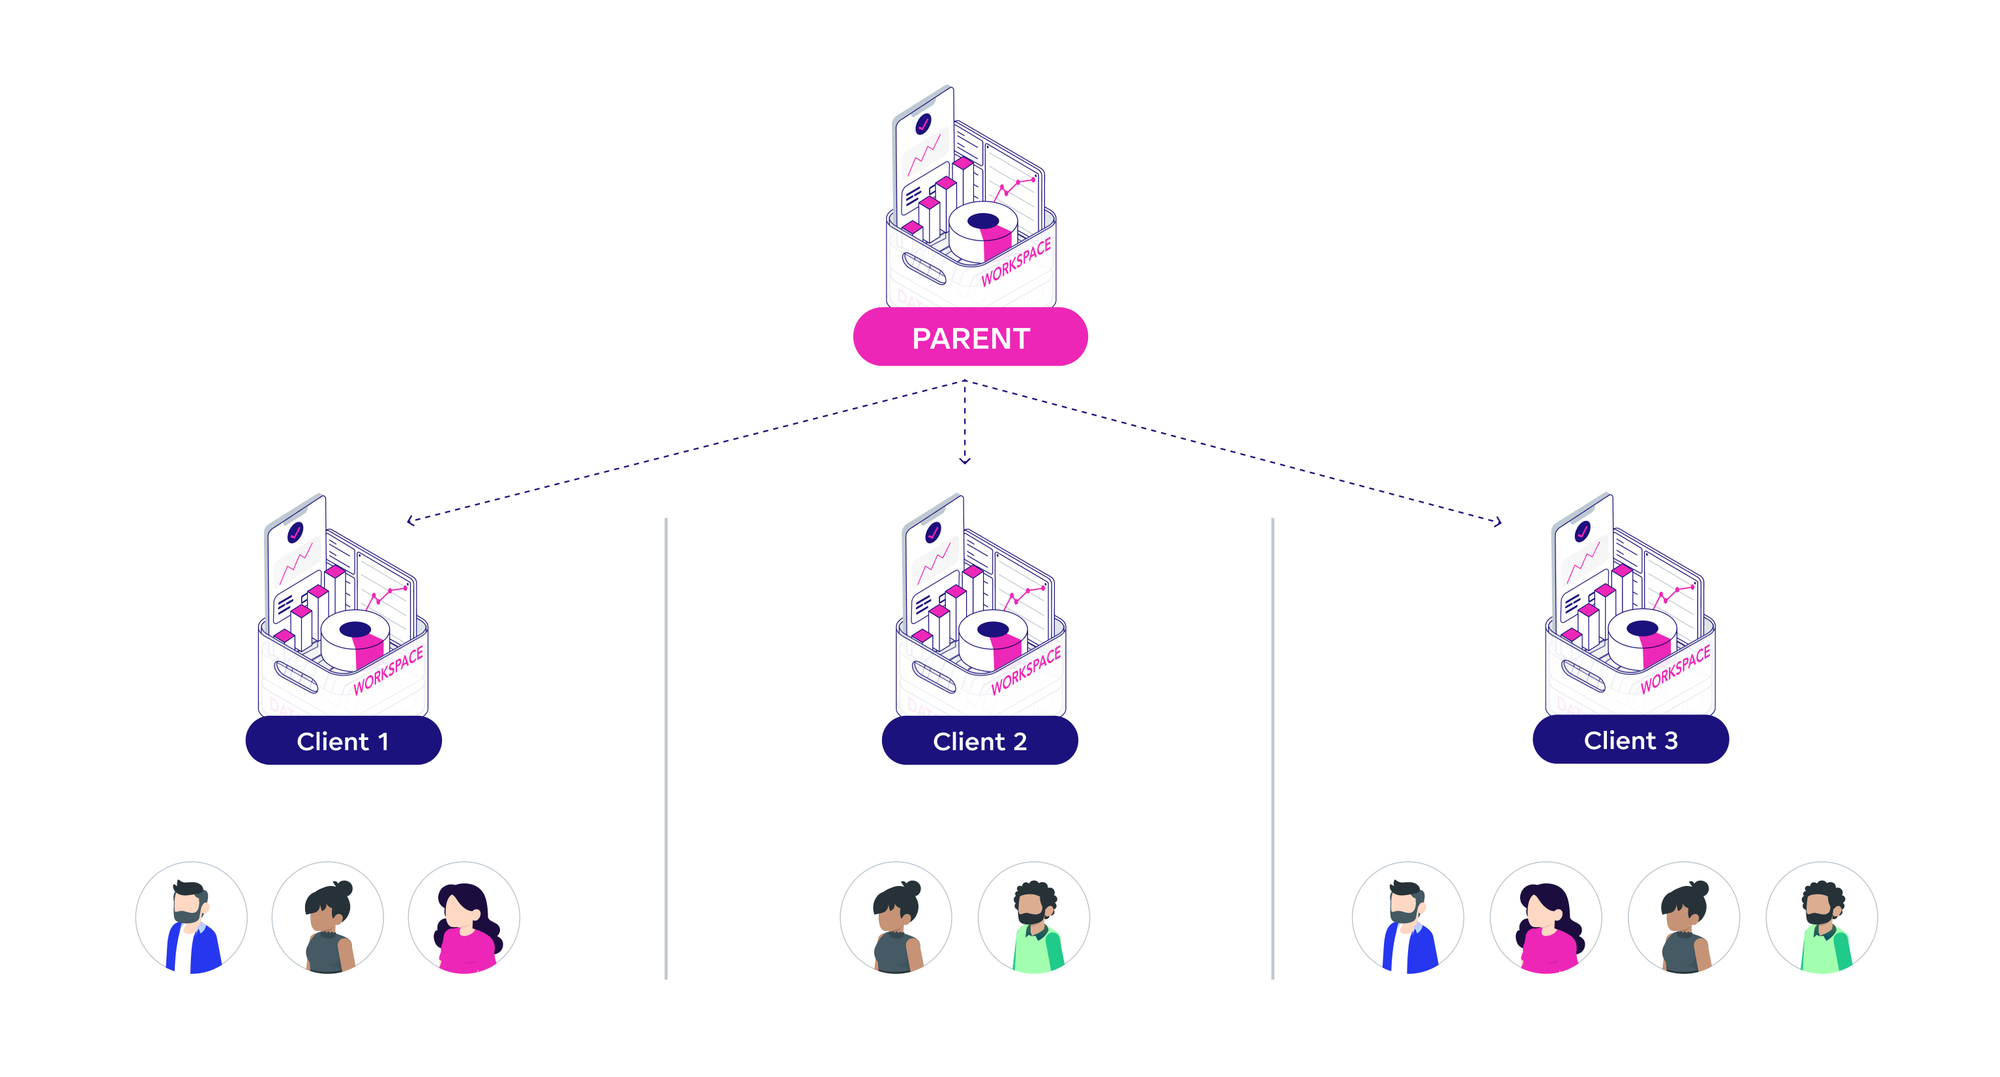
Multitenancy refers to a system that serves multiple customers (tenants) from a single platform, while keeping each tenant’s data private and secure.
Why it matters:
- Ideal for SaaS products serving many customers.
- Simplifies updates and maintenance since one deployment can support all tenants.
- Reduces infrastructure costs compared to managing separate instances for each client.
Look for platforms that offer automated tenant provisioning, data isolation, and usage tracking to help you scale efficiently.
4. Deployment Models
When choosing an embedded analytics platform, it’s important to understand how deployment models affect data control, performance, and compliance. Most vendors support one or more of three main options: cloud-native, on-premise, and hybrid deployments.
- Cloud-native deployment: The analytics platform is hosted and managed by the vendor in the cloud. This model offers the fastest setup, automatic updates, and effortless scalability without the need for internal infrastructure management. It’s ideal for teams that want to launch quickly and focus on product innovation rather than server maintenance. Cloud-native platforms also make it easier to roll out new features and scale analytics for SaaS products as usage grows.
- On-premise deployment: The analytics software is installed on your organization’s own servers or private cloud environment. This model provides maximum control over data, configuration, and security, but requires more internal IT resources to maintain. It’s often preferred in regulated industries such as finance or healthcare, where strict compliance, data residency, and audit requirements make full data control essential.
- Hybrid deployment: A hybrid model combines both approaches, allowing sensitive or regulated data to remain on-premise while using the cloud for visualization, collaboration, or performance scaling. This setup offers flexibility for organizations that need to meet security or residency standards while still benefiting from the agility and efficiency of cloud-based analytics.
When evaluating solutions, confirm that the platform’s deployment options align with your IT architecture, data governance requirements, and scalability goals. A flexible platform that supports both on-premise and cloud-native environments ensures you can meet compliance needs today while adapting easily to future growth.
5. Embedding Options
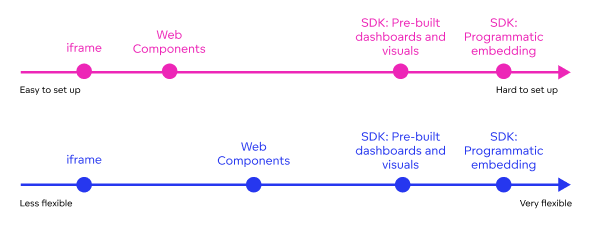
When evaluating an embedded analytics solution, the range and quality of its embedding options determine how seamlessly it can integrate analytics into your product. A strong platform provides choice and flexibility, allowing you to start with simple setups and expand toward fully customized, interactive experiences as your product evolves.
Main approaches:
- iFrames: The easiest to set up — you embed an existing dashboard in your app, much like embedding a YouTube video. This option offers limited customization but enables fast deployment.
- Web components: Provide a more native look and feel while reducing development effort. They’re a strong middle ground for teams that want a polished experience without heavy coding.
- SDKs and APIs: Offer the highest level of control, allowing you to embed analytics deeply into your product’s interface and design custom, context-aware experiences. These require more development but deliver the most seamless results.
When comparing platforms, choose a solution that supports multiple embedding methods so you can adapt to different products, customers, and use cases over time. A flexible platform ensures you can start small, integrate quickly, and later scale to richer, branded analytics experiences without rebuilding your architecture. For a detailed breakdown of embedding types and their trade-offs, check out our guide to embedding approaches.
6. White-Labeling and Customization
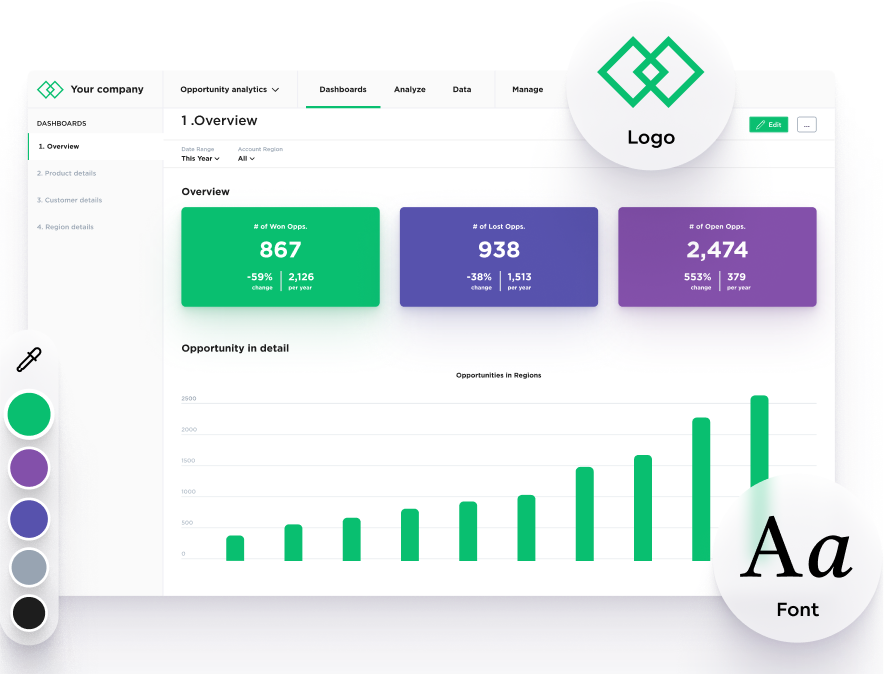
When comparing embedded analytics solutions, look for white-labeling and customization options that make analytics feel like a native part of your product. A strong platform should allow you to align every element of the analytics experience with your brand identity, creating a seamless user experience that builds trust and reinforces your product’s value.
Key capabilities to evaluate:
- Ability to change colors, fonts, and logos so dashboards match your product’s design system.
- Tools to adjust layouts, interactivity, and navigation to fit your user experience.
- Options to customize access, metrics, or reports by user, client, or region.
Real-world examples show how powerful good white-labeling can be. Take Sharry, for instance. They deliver analytics through 60 customized workspaces, each designed to match a client’s own brand and look. This approach lets them offer a consistent product while still giving every client something that feels uniquely theirs.
7. User Friendliness
An embedded analytics platform should be intuitive for both your developers and your end users. Ease of use directly affects how quickly your team can deploy analytics and how readily customers adopt them.
When assessing platforms, ask:
- Is the interface simple to navigate and visually clear?
- Can non-technical users build dashboards and explore the data without help from IT?
- Does the platform include drag-and-drop design tools or natural language search for faster insight discovery?
Select a solution that minimizes complexity while maximizing accessibility. User-friendly platforms shorten onboarding, reduce training costs, and help ensure that embedded analytics actually drive everyday decision-making.
8. AI Features
Modern embedded analytics platforms are evolving into agentic analytics platforms that let organizations build and deploy safe, autonomous analytics agents. These agents are AI-driven assistants that can interpret data, generate insights, create visualizations, or even trigger actions automatically within an application.
Beyond agentic capabilities, your embedded tool should offer a wide range of AI-powered features designed to make analytics more accessible and efficient:
- Natural language querying: Lets users ask questions in plain English (e.g., “What products are driving the most revenue this quarter?”) and get instant, visual answers.
- Automated insights: Detects patterns, correlations, and anomalies automatically, saving time and reducing human bias.
- Predictive analytics: Uses machine learning models to forecast trends and performance based on historical data.
When choosing an embedded analytics solution, prioritize platforms that offer agentic functionality alongside traditional AI features.
9. Security
Security is a core requirement when embedding analytics into customer-facing products. The right platform should protect user data, maintain compliance, and scale securely across environments.
What to verify before choosing:
- Support for single sign-on (SSO) and role-based access control to manage who sees what.
- Built-in data encryption, masking, and audit logging for compliance.
- Adherence to certifications such as SOC 2, GDPR, HIPAA, or ISO 27001, depending on your industry.
If your product serves multiple customers, ensure the platform can isolate data by tenant and manage permissions at scale. A secure architecture not only protects sensitive data but also strengthens trust with enterprise clients.
Check out our guide to building data products to deepen your understanding of designing secure, data-driven applications.
10. Pricing Models
When selecting an embedded analytics platform, understand how the pricing structure aligns with your growth model and usage patterns. The right plan should scale predictably as your user base expands.
If you plan to monetize analytics, such as by offering premium insights, customer dashboards, or white-labeled reporting, choose a platform with flexible licensing and transparent usage tracking. This will make it easier to measure, bill for, and scale your data services profitably.
Common pricing approaches:
- Per-user pricing: Simple for small internal teams but expensive at high customer volumes.
- Usage-based pricing: Charges by data queries, volume, or activity — ideal for SaaS products that scale dynamically.
- Capacity-based pricing: Based on processing power or storage; suited for large data workloads.
Before committing, ask vendors about API limits, dashboard refresh frequencies, or feature tiers that might incur extra costs. Transparent, scalable pricing ensures your analytics investment stays sustainable as your product grows.
11. Support and Developer Resources
A platform’s success often depends on the quality of support and developer resources available. Even the most advanced features are only valuable if your team can implement them efficiently.
Evaluate each vendor’s:
- Documentation quality — clear API references, SDK guides, and tutorials.
- Developer community activity — forums, examples, and peer support.
- Professional services — help with implementation, customization, and scaling.
Prioritize solutions with responsive technical teams and rich documentation. Reliable support accelerates time-to-market, reduces troubleshooting effort, and helps ensure long-term stability as your analytics evolve.
Side-by-Side Comparison of the Top Embedded Analytics Tools
The table below provides a detailed comparison of 12 leading embedded analytics platforms based on key criteria. These include embedding methods, self-service capabilities, customization options, scalability, and pricing.
Use the drop-down menu to select alternative solutions.
Comparison table
Comprehensive Review of the 12 Best Embedded Analytics & BI Platforms
This section provides detailed reviews of twelve leading embedded analytics and business intelligence platforms. Each review outlines what the platform is best suited for, its core features, and a balanced assessment of its advantages and limitations.
1. GoodData Agentic AI Embedded Platform
Best For
GoodData’s Agentic AI Embedded Platform is best for providing multitenant, agentic analytics, and data monetization that scale seamlessly across customers and products.
Core Features
GoodData is an embedded analytics platform that enables organizations to safely build and deploy AI-powered analytics agents. These agentic capabilities allow teams to automate insights, streamline decision-making, and enhance user experiences — all within a secure, governed environment.
Built on a composable, cloud-native architecture, GoodData offers flexibility, scalability, and modern data governance. At its core is a powerful semantic layer that centralizes metrics, business logic, and data relationships, ensuring consistent analytics across dashboards and applications.
The platform supports analytics-as-code, so developers can manage analytics with familiar tools like Git, CI/CD pipelines, and modular configuration. Its multi-tenant architecture makes it easy to manage analytics for multiple customers, departments, or products with shared governance and inherited configurations.
GoodData also provides transparent, predictable pricing without per-user fees, and uses advanced caching and query acceleration to deliver high performance at scale. With flexible embedding options — including React, Web Components, and iFrames — it integrates seamlessly into SaaS products and enterprise workflows.
An integrated analytics lake enables smooth connectivity with cloud data warehouses and lakehouses, while GoodData’s professional services team partners closely with organizations to support implementation and long-term success.
Pros and Cons of GoodData
AI assistant, AI Lake, and the ability to build custom analytics agents
Cons
Some advanced styling requires developer involvement
Centralized semantic layer for consistent, governed metrics across the organization or clients
Cons
Visualization library is less extensive than design-focused tools; more visualizations require plugins
Composable architecture with analytics-as-code support
Cons
Limited out-of-the-box customization for visual layouts; deeper customization via React SDK requires developer skills
Transparent, predictable pricing for easy scaling
Cons
UI appearance is more functional than aesthetic
Strong professional services and partner-style support
Cons
Smaller native visualization catalog than some competitors
2. Tableau Embedded Analytics
Best For
Tableau has become best known for its industry-leading data visualization capabilities, enabling users to create interactive, visually rich dashboards.
Core Features
Tableau is one of the most established embedded analytics platforms, recognized for its powerful visual exploration. Through an intuitive drag-and-drop interface, it offers an extensive library of charts, maps, and advanced visualizations. Users can connect to a wide range of data sources ( including databases, data warehouses, spreadsheets, APIs, and cloud services), and choose between live connections or cached extracts for optimized performance.
To unlock Tableau’s full capabilities, organizations often integrate multiple Tableau products, such as Tableau Prep for data preparation, Einstein AI for predictive analytics, and Tableau Pulse for personalized, AI-driven insights. The platform also supports natural language queries for conversational analytics.
Dashboards can be embedded via APIs or iFrames, shared securely through Tableau Server or Tableau Cloud, and accessed across devices through dedicated iOS and Android apps.
*See how Tableau stacks up against GoodData in this comparison guide.
Pros and Cons of Tableau
Industry-leading data visualization with intuitive drag-and-drop design
Cons
No native multitenancy; requires workarounds for scaling
Broad data connectivity and flexible live/extract options
Cons
No centralized semantic layer, leading to inconsistent metrics
Backed by Salesforce with a large, skilled user community
Cons
Governance can become complex at scale
Beginner-friendly setup and easy dashboard creation
Cons
Limited developer collaboration and automation tools
Mobile apps and embedded analytics support
Cons
Performance can rely heavily on extracts
3. Power BI Embedded
Best For
Power BI Embedded is best suited for organizations within the Microsoft ecosystem that need intuitive, governed analytics tightly integrated with Azure services and other Microsoft products.
Core Features
Power BI Embedded combines robust data modeling, governance, and flexible deployment options. Its modeling engine, powered by DAX, allows users to build complex calculated measures and relationships. For data preparation, Power Query provides a no-code interface for cleaning, transforming, and shaping data before analysis.
Organizations can use Power BI in several ways: Power BI Desktop for individual report building, Power BI Service for cloud-based collaboration, or Power BI Report Server for on-premises deployments. The platform supports embedding analytics into external applications through APIs and SDKs, with strong enterprise-grade security and governance features such as row-level security, role-based access, and Azure Active Directory integration.
*See how Power BI stacks up against GoodData in this comparison guide.
Pros and Cons of Power BI
Deep integration with Microsoft tools (Excel, Teams, Azure, Fabric)
Cons
Limited native multitenancy; governance at scale can be complex
User-friendly dashboards with drag-and-drop interface
Cons
Premium licensing required for large-scale or advanced features
Flexible data preparation through Power Query
Cons
DAX modeling can be difficult for non-technical users
AI-powered features (CoPilot, forecasting, anomaly detection)
Cons
Embedding and white-labeling options are limited without extra cost
Affordable entry-level pricing and free desktop version
Cons
Performance can depend on dataset size and configuration
4. Looker Embedded Analytics
Best For
Looker is best suited for organizations that need governed, consistent metrics delivered through a centralized semantic layer, along with deep integration into the Google Cloud ecosystem.
Core Features
Looker Embedded Analytics integrates seamlessly with Google Cloud services such as BigQuery, Vertex AI, and Gemini AI, enabling advanced AI and machine learning capabilities, including predictive analytics and natural language querying. The platform supports embedding and extensibility through REST and Embed APIs, SDKs, and iFrame integrations, allowing teams to build analytics directly into applications, portals, or business workflows.
For developers, Looker offers Git-based version control, supporting collaborative development, structured governance, and CI/CD pipelines for analytics-as-code workflows.
Deployment options include a fully managed Google Cloud service, self-hosted installations, or operation in private cloud environments, providing flexibility to meet varied security and compliance needs.
*See how Looker stacks up against GoodData in this comparison guide.
Pros and Cons of Looker
Centralized semantic layer (LookML) ensures consistent metrics and governance
Cons
Limited native multitenancy; relies on user data filters for separation
Deep integration with Google Cloud (BigQuery, Vertex AI, Gemini AI)
Cons
Performance depends on database efficiency and query complexity
Real-time querying with no extracts or data duplication
Cons
Pricing can be high for enterprise or embedded deployments
Git-based version control enables collaborative, analytics-as-code workflows
Cons
Steep learning curve for LookML; less accessible for non-technical users
Flexible deployment options (cloud, private, or self-hosted)
Cons
Best suited for Google Cloud environments
5. Sisense Fusion Embed
Best For
Sisense is best suited for organizations that need to embed highly customizable analytics into customer-facing products or applications, with full control over the user experience and data architecture.
Core Features
Sisense Fusion Embed offers exceptional deployment flexibility; it can run in the cloud, on-premises, or in hybrid environments using Kubernetes. Its ElastiCube engine delivers high-performance, in-memory analytics on imported data, while Live Models enable real-time queries directly from data warehouses, ensuring up-to-date insights without data extracts.
For developers and product teams, Sisense provides robust embedding and customization tools, including REST APIs, a JavaScript SDK, and the Blox framework, which allows embedding of custom interactive components.
The platform also includes AI and augmented analytics capabilities, such as natural language querying and automated narrative generation through Sisense Narratives.
*See how Sisense stacks up against GoodData in this comparison guide.
Pros and Cons of Sisense
Strong embedding and white-labeling options via REST API, SDK, and Blox framework
Cons
No centralized semantic layer; inconsistent metric governance
High-performance ElastiCube engine with real-time Live Models
Cons
Limited developer tooling and automation
Flexible deployment (cloud, on-prem, hybrid via Docker/Kubernetes)
Cons
Scaling across many tenants adds operational complexity
Built-in multi-tenancy via roles, groups, and row-level security
Cons
Weaker governance support compared to Looker or GoodData
AI-assisted insights and narrative summaries for data storytelling
Cons
Higher cost and DevOps overhead at both SMB and enterprise scale
6. Amazon QuickSight Embedded Analytics
Best For
Amazon QuickSight is best suited for AWS customers who need fast, scalable, and machine learning–powered analytics fully integrated within the AWS ecosystem, without the overhead of managing infrastructure.
Core Features
Amazon QuickSight is a cloud-native BI and embedded analytics service built for speed, scalability, and cost efficiency. It integrates seamlessly with AWS data sources and services such as Redshift, Athena, and S3, making it ideal for organizations already using AWS.
QuickSight includes machine learning–driven features such as anomaly detection, forecasting, and predictive insights, as well as QuickSight Q, which enables users to ask questions in natural language and receive instant visual answers.
The platform provides strong security and governance through AWS Identity and Access Management (IAM), with built-in encryption, compliance, and fine-grained access controls.
Dashboards and visualizations can be embedded into web applications or portals via APIs and SDKs, allowing developers to deliver fully interactive, branded analytics experiences to end users.
*See how AWS Quicksight stacks up against GoodData in this comparison guide.
Pros and Cons of Amazon Quicksight
Deep integration with AWS data services (S3, Redshift, Athena, RDS, Glue)
Cons
Limited visualization flexibility and fewer customization options
Serverless, auto-scaling architecture with no infrastructure to manage
Cons
Performance can lag with large or complex datasets
SPICE in-memory engine improves query performance
Cons
Costs can increase significantly with heavy usage or frequent refreshes
Built-in ML and natural language features (QuickSight Q)
Cons
Limited real-time and data transformation capabilities
Easy onboarding for AWS users with IAM-based security
Cons
UI quirks, slower support response, and less maturity than leading BI tools
7. Domo Everywhere
Best For:
Domo Everywhere is best suited for organizations that need an all-in-one cloud platform combining data integration, preparation, visualization, and embedded analytics.
Core Features
Domo Everywhere is part of the broader Domo Data Experience Platform. It simplifies analytics workflows by eliminating the need for separate tools for data prep, warehousing, and dashboarding. Its Magic ETL tool provides a visual, drag-and-drop interface for transforming data without code, while Adrenaline DataFlows and live caching deliver high-speed processing and sub-second query performance.
Domo connects to a wide range of data sources, including SaaS applications, databases, APIs, and IoT systems. Dashboards are built using Cards and organized through Domo Stories, offering flexible, interactive layouts for clear data storytelling.
The platform also includes Buzz, an integrated collaboration tool for real-time communication, and an App Framework that lets teams build custom low-code business apps and workflows.
Domo Everywhere supports mobile analytics for on-the-go access and includes robust governance controls, such as row-level security, custom roles, and granular sharing permissions.
*See how Domo stacks up against GoodData in this comparison guide.
Pros and Cons of Domo
Unified all-in-one cloud platform combining ETL, storage, and analytics
Cons
High and non-transparent pricing; expensive for SMBs
1,000+ pre-built connectors with strong data integration tools
Cons
Weak semantic layer; metric definitions often siloed
Easy-to-use drag-and-drop dashboards with real-time updates
Cons
Inconsistent customer support and communication
Mobile apps and built-in collaboration via Buzz chat
Cons
Dated UI and limited visualization customization
Low-code App Framework for custom workflows and apps
Cons
Governance and scalability challenges at large scale
8. Qlik Embedded Analytics
Best For
Qlik is best suited for organizations that need exploratory analytics combined with integrated data pipelines and governed, enterprise-grade data management.
Core Features
Qlik Embedded Analytics is part of the Qlik Cloud platform and brings Qlik’s analytics and data integration capabilities to embedded environments. At its core is the Qlik Associative Engine, which allows users to explore data freely, without being constrained by predefined hierarchies or query paths. The engine performs in-memory recalculations instantly as filters or selections change, enabling fast, ad-hoc discovery and deep exploratory analysis.
The platform integrates AI and augmented analytics features such as the Insight Advisor, AutoML, and natural language querying, supporting guided analytics, anomaly detection, and predictive forecasting.
For developers, Qlik Cloud Embed offers robust embedding and extensibility tools, including REST and JavaScript APIs and Nebula.js. These allow Qlik dashboards and visualizations to be embedded directly into external applications or workflows.
Additional components like the Qlik Catalog simplify data lineage and metadata management, while Qlik Staige integrates proprietary and open AI models to power conversational and augmented intelligence experiences.
*See how Qlik stacks up against GoodData in this comparison guide.
Pros and Cons of Qlik
Associative data model allows dynamic, ad-hoc exploration without predefined joins
Cons
In-memory processing can be resource-intensive at large scale
Integrated data pipeline (ETL, CDC, real-time streaming) via Qlik Data Integration
Cons
No centralized semantic layer; metric consistency depends on governance
Strong ecosystem, open APIs (REST, Nebula.js), and extensibility for embedding
Cons
Complex administration in large or multi-tenant environments
Governed self-service model balances freedom with control
Cons
Load scripting introduces a learning curve for new users
Robust mobile apps with offline support
Cons
Limited hierarchical multitenancy for B2B distribution
9. ThoughtSpot Embedded
Best For
ThoughtSpot Embedded is best suited for organizations that want AI-driven analytics and instant insights from live cloud data, empowering business users to explore data without technical expertise.
Core Features
ThoughtSpot Embedded enables users to analyze data through a natural language search interface, allowing them to ask questions and instantly generate interactive visualizations. Its SpotIQ engine automatically identifies trends, anomalies, and correlations, providing AI-powered insights with minimal setup.
Sage, ThoughtSpot’s generative AI assistant, adds conversational analytics, enabling users to interact with data in plain language and uncover deeper insights using large language models (LLMs). The platform supports live querying against leading cloud data warehouses such as Snowflake, Redshift, BigQuery, and Databricks, ensuring near real-time analysis without data movement.
For modeling and version control, ThoughtSpot uses TML (ThoughtSpot Modeling Language), a YAML-based format that supports easy export, import, and sharing of data models.
Pros and Cons of ThoughtSpot
AI and LLM-powered features through SpotIQ and Sage
Cons
No true semantic layer; metrics and logic not centrally governed
Natural language querying for easy data access
Cons
LLM querying may expose schema and create compliance risks
Direct live connections to most of the popular data sources
Cons
SaaS-only; no hybrid or on-prem deployment
Embedding SDK for integrating analytics into external apps
Cons
Manual Git integration; limited automation and CI/CD support
Fast time-to-value with minimal upfront modeling
Cons
Premium pricing that scales with usage and embedding
10. Luzmo Embedded Analytics
Best For
Luzmo is best suited for software companies that need lightweight, highly customizable embedded analytics with fast, developer-friendly integration.
Core Features
Luzmo Embedded Analytics is a developer-centric platform purpose-built for embedding interactive dashboards into customer applications with minimal complexity. Its modern architecture is optimized for SaaS environments, enabling seamless analytics integration without heavy infrastructure or deployment overhead.
The platform offers SDKs and APIs for popular frameworks to embed into different applications. Luzmo connects to a variety of data sources— including databases, data warehouses, and APIs — and supports both live and cached data modes for performance flexibility.
Luzmo provides extensive white-labeling and customization options, including CSS overrides and theming, allowing dashboards to fully match the look and feel of the host application.
Pricing is designed for scalable SaaS deployment, with workspace-based and usage-based models that align with customer-facing analytics use cases.
Pros and Cons of Luzmo
Purpose-built for embedded analytics with SDKs and APIs
Cons
Lacks advanced analytics features and a semantic layer
Lightweight, fast setup, and low maintenance
Cons
Limited scalability for complex enterprise use cases
Easy white-labeling and generic customization
Cons
Smaller visualization library; custom visuals need coding
Clean UI with interactive features
Cons
Narrower ecosystem and fewer integrations than larger BI tools
Pricing designed for SaaS distribution (workspace or usage-based)
Cons
Performance depends on data setup; no in-memory acceleration
11. Omni Embedded Analytics
Best For
Omni is best suited for organizations that need to balance governed, consistent metrics with flexible, ad hoc exploration and dbt-integrated analytics workflows.
Core Features
Omni Embedded Analytics combines governed data modeling with the agility of self-service analysis. The platform features dual modeling layers — a shared semantic model for consistent, governed metrics, and a workbook layer for experimentation and iterative analysis. Users can prototype new calculations within workbooks, then promote validated logic to the shared model, maintaining both data integrity and analyst flexibility.
Omni provides multiple interfaces to accommodate different skill levels, including a point-and-click builder, spreadsheet-style formulas, a SQL editor, and AI-assisted query generation.
Performance is optimized through hybrid caching, combining in-database and in-memory compute for fast, scalable query responses. Omni also delivers robust security and governance, including row- and column-level permissions, SSO, and granular user roles. Dashboards and analyses can be embedded into external applications or shared securely via iFrames, URLs, or scheduled reports.
Pros and Cons of Omni
Blends governed semantic modeling with workbook-level flexibility
Cons
Still relatively young; some features and UI workflows less mature
Multiple user interfaces (point-and-click, formulas, SQL, AI-assisted)
Cons
Visualization options less advanced than larger BI suites
dbt integration keeps analytics aligned with data models
Cons
Learning curve for advanced modeling and governance workflows
Strong security features (row/column-level permissions, SSO)
Cons
Lacks mobile and offline capabilities
Rapid updates and responsive support
Cons
Some semantic modeling features still early-stage
12. Holistics Embedded Analytics
Best For
Holistics is best suited for data teams and business users that need governed, consistent analytics supported by a strong semantic modeling layer and Git-based version control.
Core Features
Holistics Embedded Analytics centers around a semantic layer that serves as a single source of truth for key metrics, business logic, and relationships.
The platform supports self-service BI, enabling business users to explore data and build reports without depending on data teams, while maintaining governance through centrally defined models. It also offers automation and scheduling tools for data refreshes, report delivery, and workflow orchestration, helping teams streamline recurring analytics processes.
Holistics integrates with Git version control, allowing developers and analysts to track, review, and collaborate on model changes through familiar software development workflows.
Pros and Cons of Holistics
Strong semantic modeling and governance with analytics-as-code
Cons
Limited customization and advanced visualization options
Git integration for version control and collaboration
Cons
Performance challenges on large or complex dashboards
Embedded analytics support for SaaS and B2B use cases
Cons
Less granular access control and governance flexibility
Self-service BI reduces dependency on data teams
Cons
Some onboarding complexity for as-code setup
Good price-to-value ratio and responsive product support
Cons
Occasional UI or usability friction
Concluding Thoughts on the Best Embedded Analytics Software
Choosing the best embedded analytics software means balancing flexibility, governance, scalability, and integration depth. The right platform really depends on how analytics fits into your product strategy, user experience, and technical setup.
It’s not just about meeting today’s reporting needs; it’s about staying competitive as your product and users evolve. The embedded analytics market is moving fast, with vendors standing out through AI-assisted insights, self-service options, deep customization, and scalable cloud performance.
As AI, automation, and seamless data connections become the norm, companies that successfully weave analytics and AI capabilities directly into their products will see clear gains in user engagement, retention, and faster, smarter decision-making.
*Still wondering which tools truly shine? See how customers rate the top embedded analytics platforms on G2.
Get First-Hand Experience with a Top Embedded Analytics Tool
Embedded BI delivers the greatest value when your analytics platform grows with your business, fits naturally into existing workflows, and aligns with your product’s design. GoodData does exactly that, providing secure, flexible insights that make your product more engaging and intuitive to use. Ready to see it in action? Request a demo today.
**Note: The above evaluation of features is based on our best understanding of publicly available information available at the time of publishing (October ‘25). To understand more specific details and feature differences, readers are encouraged to perform their own research. All of the product names, logos, and brands used are for identification purposes only and remain the property of their respective owners. Use of them does not imply any affiliation with or endorsement by them.**
FAQs About the Best Embedded Analytics Tools
What are the best embedded analytics tools?
The best embedded BI tools combine scalability, flexible embedding options, strong security, and white-label customization. Leading platforms such as GoodData, Tableau, Power BI, Looker, and Sisense are often compared as top embedded analytics software choices. The right fit depends on your product requirements, budget, and user experience goals.
What is embedded BI, and how is it different from traditional BI?
Embedded BI (business intelligence) brings dashboards, reports, and advanced analytics directly into a software application or data product. Traditional BI tools require users to log into a separate platform, but embedded BI software integrates insights into the environment where people already work, improving adoption and reducing friction.
What are the key features of the best embedded BI software?
The top embedded BI platforms typically include self-service analytics, customizable dashboards, AI-powered insights, and strong security controls. Other embedded analytics features to look for are multi-tenant management, flexible embedding methods (API, SDK, iFrame, or web components), and white-labeling for a seamless user experience.
What are the benefits of embedded analytics solutions?
The benefits of embedded analytics include faster decision-making, improved customer engagement, and new opportunities for data monetization. By turning raw data into insights inside the product, embedded analytics applications reduce the need for separate BI tools and make data-driven workflows more intuitive.
What are examples of embedded analytics use cases?
Examples of embedded analytics include a SaaS application that gives customers real-time dashboards, a healthcare app that integrates patient outcome reporting, or a fintech platform that provides personalized financial insights. These embedded analytics examples show how analytics features can drive adoption and create business value.
How do I choose the best embedded BI platform for my business?
When comparing the best embedded BI tools, consider scalability, deployment flexibility (cloud, on-premises, or hybrid), pricing models, and support for white-label customization. Evaluating whether a platform offers advanced AI-powered analytics tools or strong developer resources can also help identify the best embedded analytics solution for your needs.
What is the difference between embedded analytics tools and embedded BI solutions?
The terms are often used interchangeably. “Embedded analytics” usually emphasizes visualizations, dashboards, and reporting inside an app, while “embedded BI” highlights the broader business intelligence capabilities, such as data modeling, governance, and advanced analysis. In practice, the best embedded BI software and embedded analytics solutions aim to achieve the same outcome: actionable insights within the product experience.
Trusted by


Does GoodData look like the better fit?
Get a demo now and see for yourself. It’s commitment-free.