Top 11 Must-Have Features for Your Modern BI Tool


Summary
Selecting a business intelligence tool is about more than just reporting dashboards. This article outlines the must-have features that modern BI platforms need, from user-friendly self-service options to powerful data models and scalable performance. You will learn which capabilities matter most when evaluating tools and how these features can help your teams make better use of their data.
The 11 must-have features for your modern BI tool
Choosing the right business intelligence (BI) solution can feel complicated. Features that were once highly prized (such as drag-and-drop functionality and engaging visualizations) are now considered standard and carry less weight in the decision-making process. If you're currently evaluating today’s analytics software, check out How To Evaluate BI Tools to Choose the Best One. For now, let's explore some crucial features to look for in a modern BI solution.
1. Multitenancy: enabling the sharing of analytics across multiple customers
When distributing and potentially selling your data product to customers, it’s essential that each customer can only see and access their own data. The best modern BI tools offer straightforward and painless sharing of personalized data for multiple, different tenants.
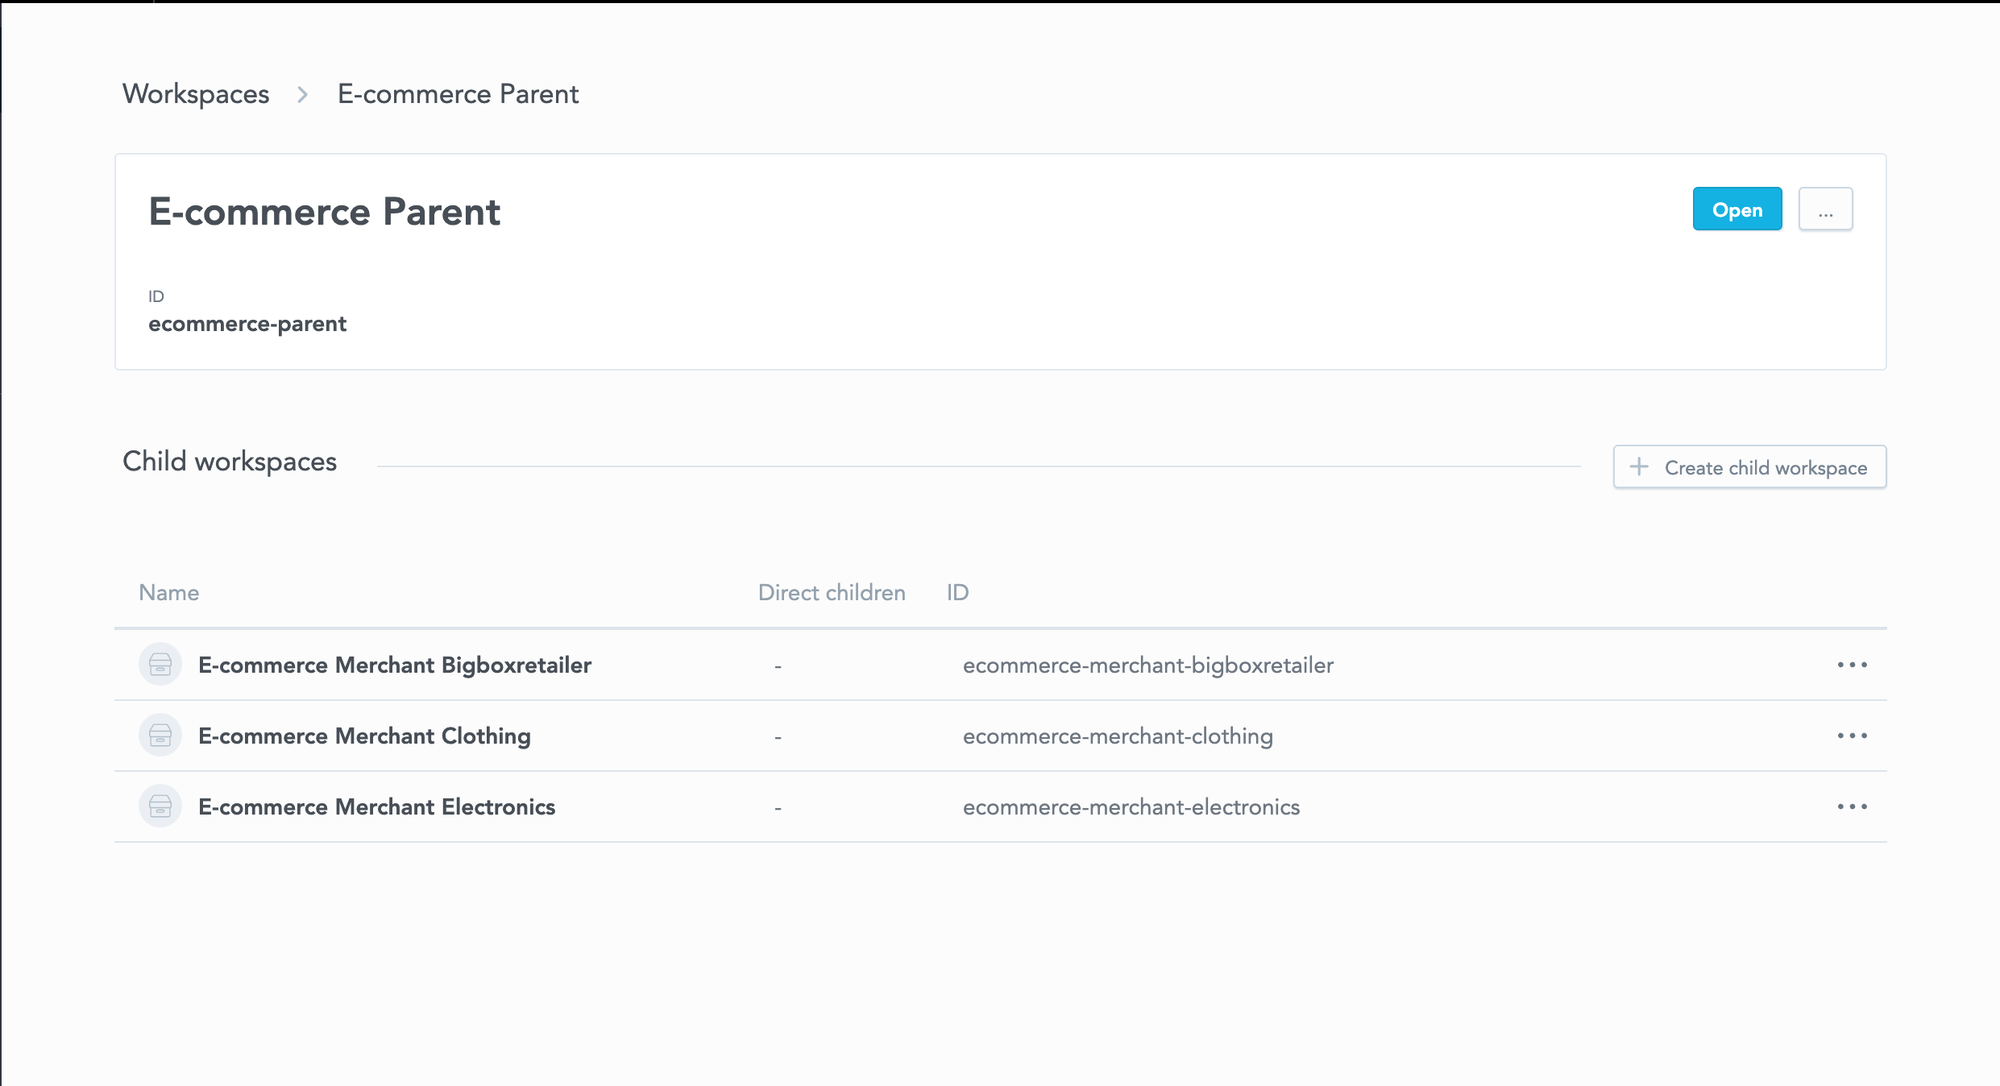
A multi-tenant configuration allows you to segment the desired information into multiple workspaces. For instance, if you have e-commerce data, the different workspaces can be used for individual product categories, or if you have multiple customers, these can also be separated via different workspaces.

Workspaces can be used for individual product categories in e-commerce.
2. A logical data model that speaks the business language
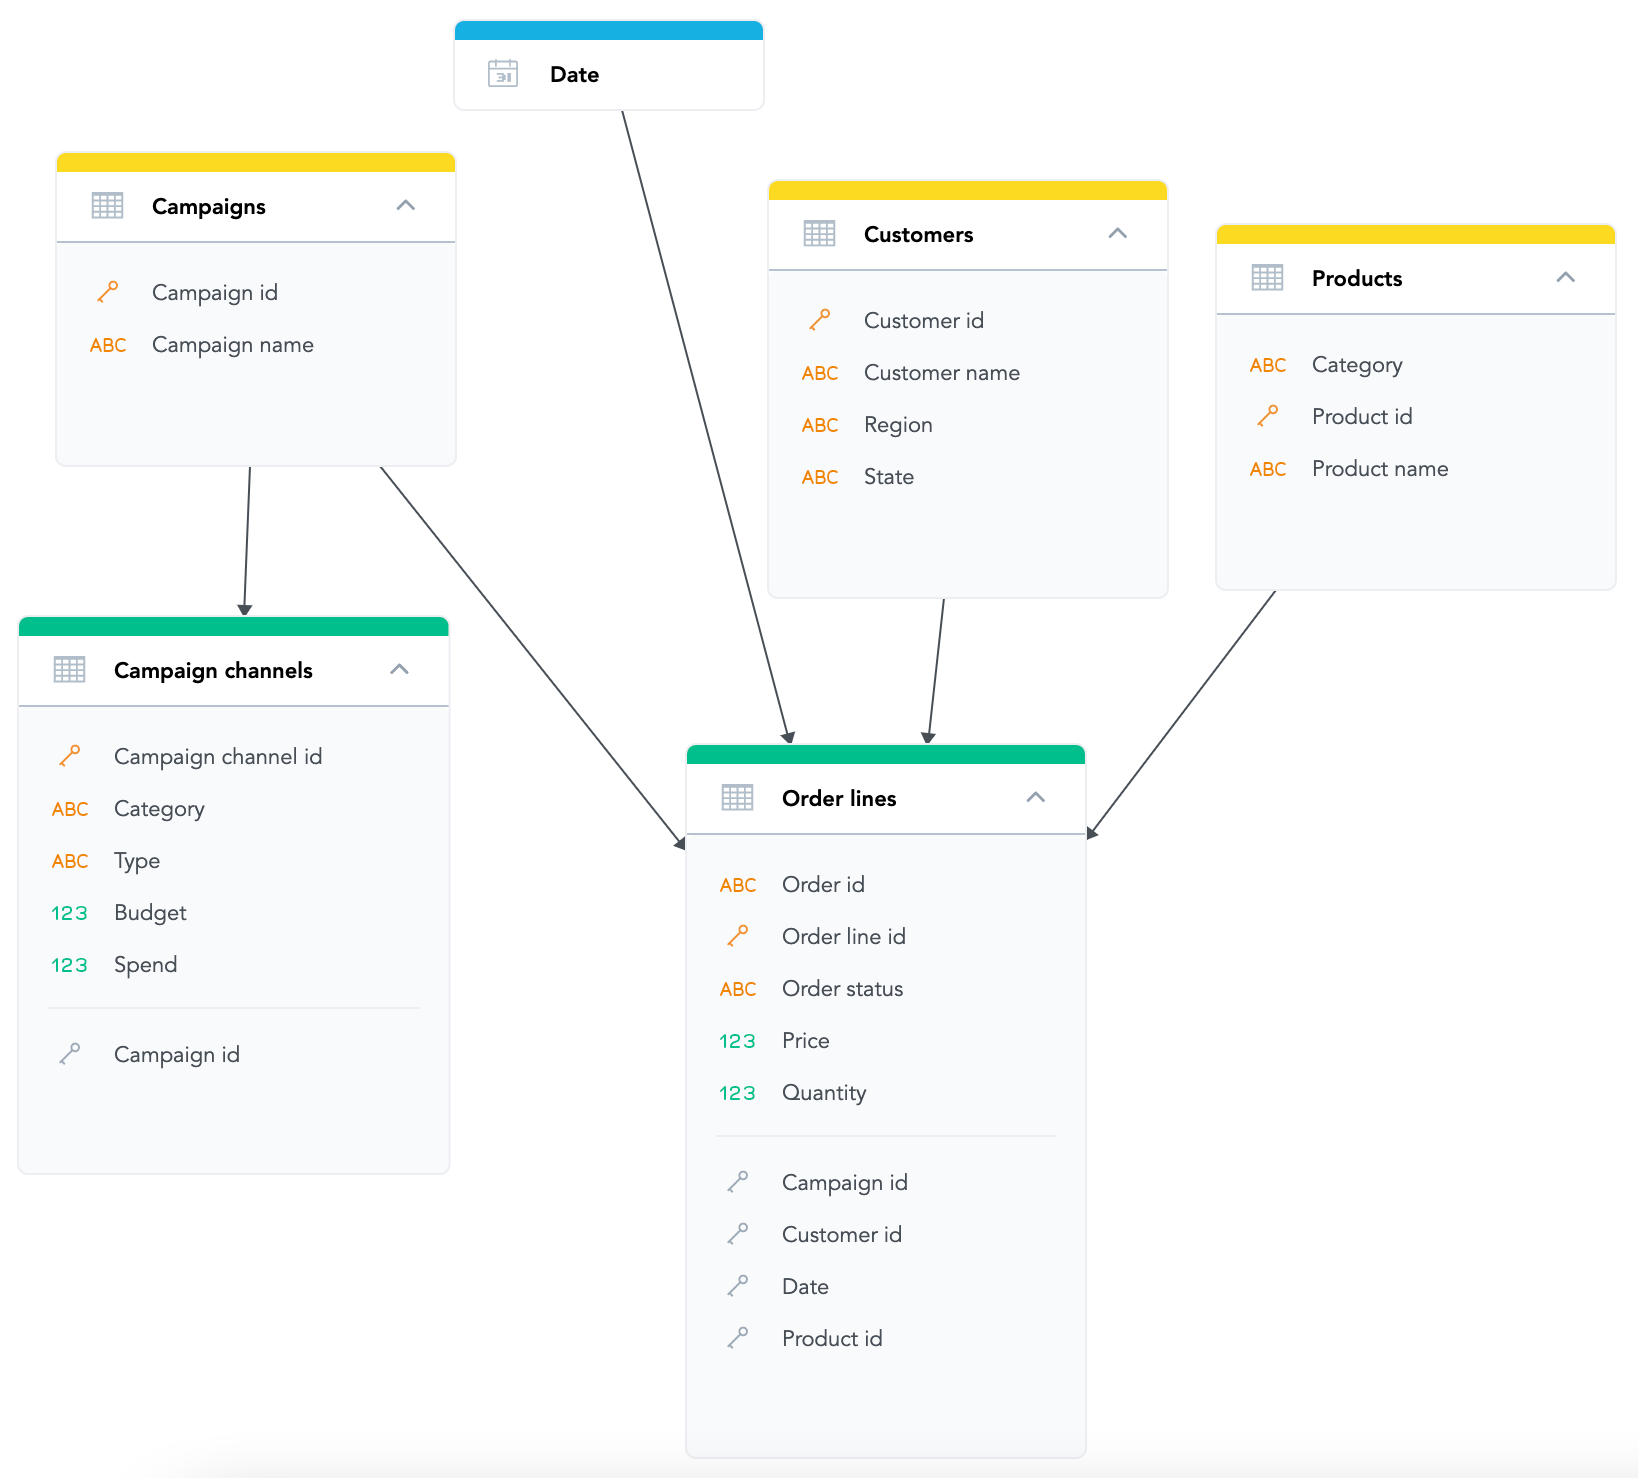
When comparing the best BI tools on the market, look for data modeling capabilities. The option to visualize and easily decide the relationships between designated entities is essential. A logical data model describes sets of data in a meaningful (aka logical) way, creating the necessary relationships to provide meaningful analytics. A properly configured LDM enables the easy creation of new metrics, reports, and insights, making it a crucial BI software feature. Your analytics platform should allow you to independently connect the model to a source database, establishing a foundation for components of the semantic layer in data management systems.

An example of an LDM
3. Analytics as Code: bringing software best practices to your analytics
Using code instead of manually managing data models, calculations, reports, and dashboards is fast becoming a must-have functionality of modern business intelligence tools.
The analytics-as-code approach offers several benefits:
- Integrations and automation: Use code to automate repetitive tasks, such as provisioning access and creating visualizations.
- Version control and collaboration: Integrate your analytics with versioning systems to centralize changes and enhance collaboration across teams.
- Easier maintenance of your analytics: Quickly scale, test, and propagate updates without breaking your dashboards.
A modern BI tool treats everything as code and should allow you to easily implement the AaC approach with out-of-the-box developer tools (such as declarative APIs and Python SDK).
4. A metric editor with intelligent query completion: allowing end users to create custom metrics
Any modern BI tool must be able to perform complex calculations and aggregations. A metric editor allows the end user to create custom metrics for reporting. Ideally, the Multi-Dimension Analytical Query Language (MAQL) is the machine's engine.
The key advantages of MAQL include:
- No joins or sub-joins as MAQL works on top of LDMs and its queries are context-aware.
- Any metric can be immediately used for reporting, reused again, or deployed to assemble other metrics.
- MAQL simplifies multidimensional analysis by abstracting any data complexities. You do not have to specify the fact or attribute origin as it is done automatically for you.
After creating a set metric, the ability to format appropriately is key. Modern BI software ought to provide out-of-the-box features that allow you to select whether your metric should be a currency, a number with several decimal points, or any other format you like.
5. AI built on top of a semantic layer for more reliable results
The semantic layer lives between the database and the applications. It defines all of the rules and relationships between the data elements and provides a common vocabulary for the data in business terms. Thanks to the semantic layer, users can easily interact with the data without requiring technical knowledge of their data sources.
Recently, business intelligence tools have begun to combine this semantic layer with AI to streamline the delivery of more consistent data and enhance data quality. For instance, when using Chatbot assistants, a semantic layer can lead to more accurate data and help to avoid hallucinations.
6. Interactive dashboards for deeper analysis
For many users, static dashboards are no longer sufficient. They want interactive tools that allow them to engage with the data and extract specific insights. BI features like filtering and drill-down capabilities have become essential to meet these demands.
A modern BI solution should provide users with various ways to independently explore the data, including:
- Drill into visualizations: Users can click on a visualization and be prompted with a new, more detailed visualization.
- Drill into dashboards: A drill-across operation that directs users to a new dashboard tab, which may present a different set of metrics and attributes.
- Drill into URL: Opens a new URL in a browser tab, enabling dynamic links to external resources outside of the BI tool.
- Drill down (drilling into hierarchy): Opens the same visualization but displays a more granular view filtered by the parent attribute.
- Cross-filtering: filters out data seen in dashboards based on a click on any data point within a visualization.
Above is an example of drilling into a visualization in the GoodData platform.
7. Different KPIs affected by different dates
When creating a new dashboard, the reports are likely to be filtered by multiple different date dimensions. Hence a modern BI solution should allow the user to easily select the date dimension that will affect the filtering’s end result.
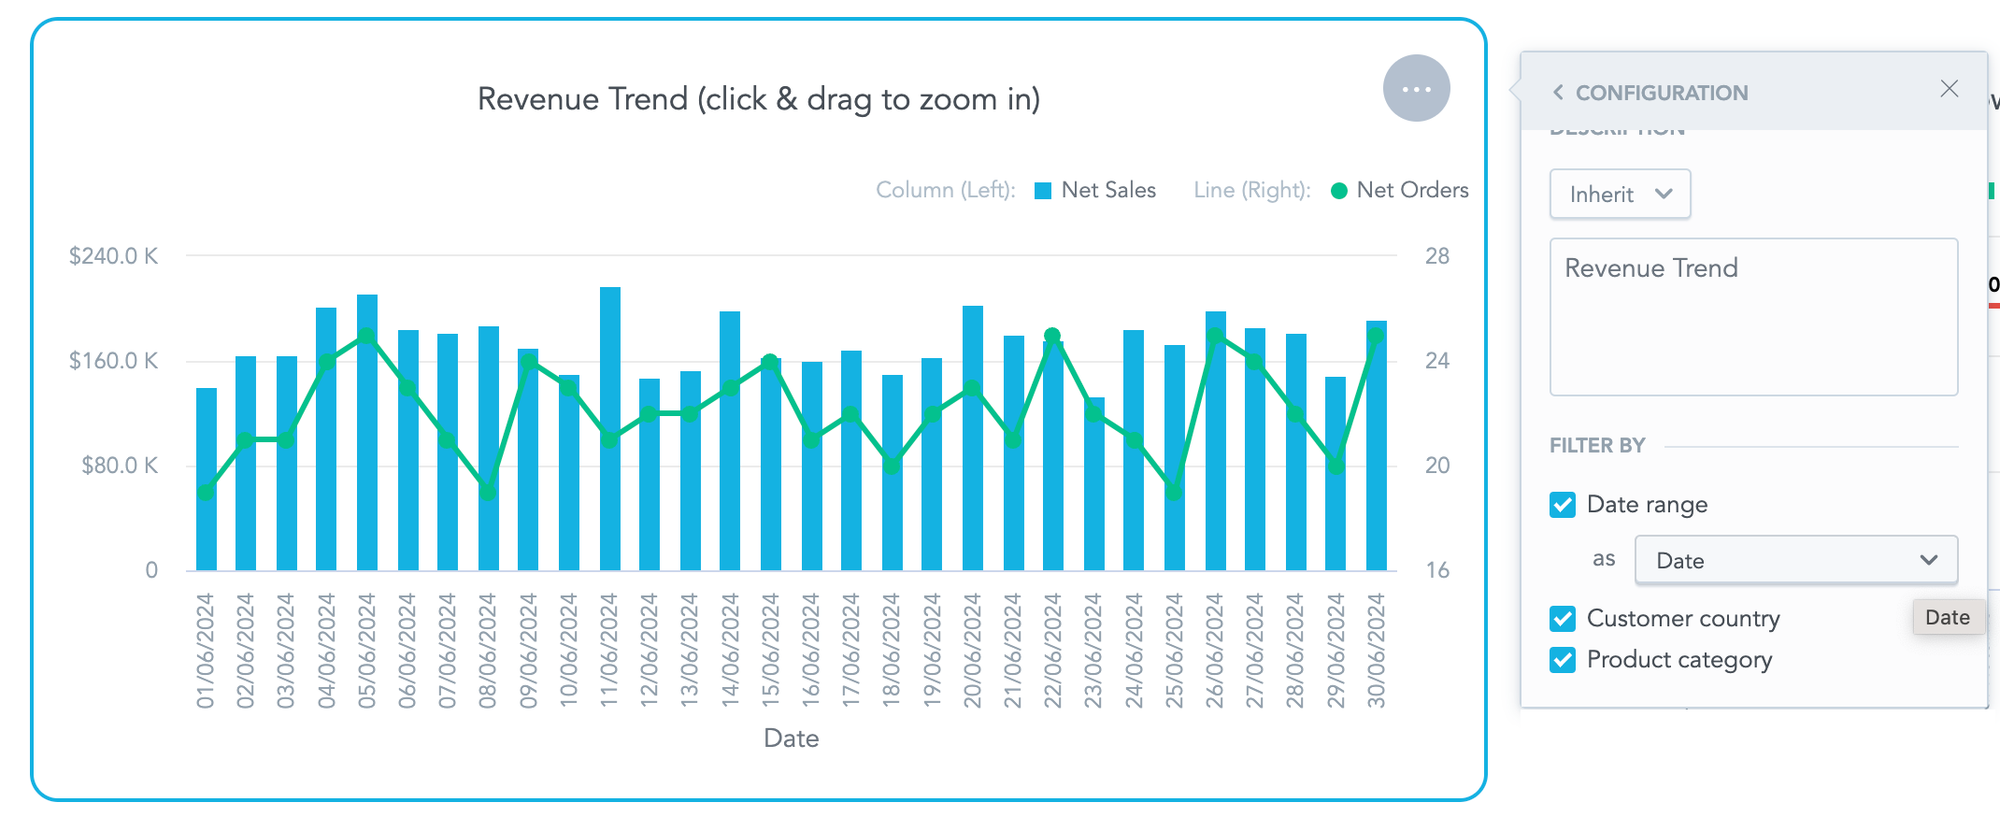
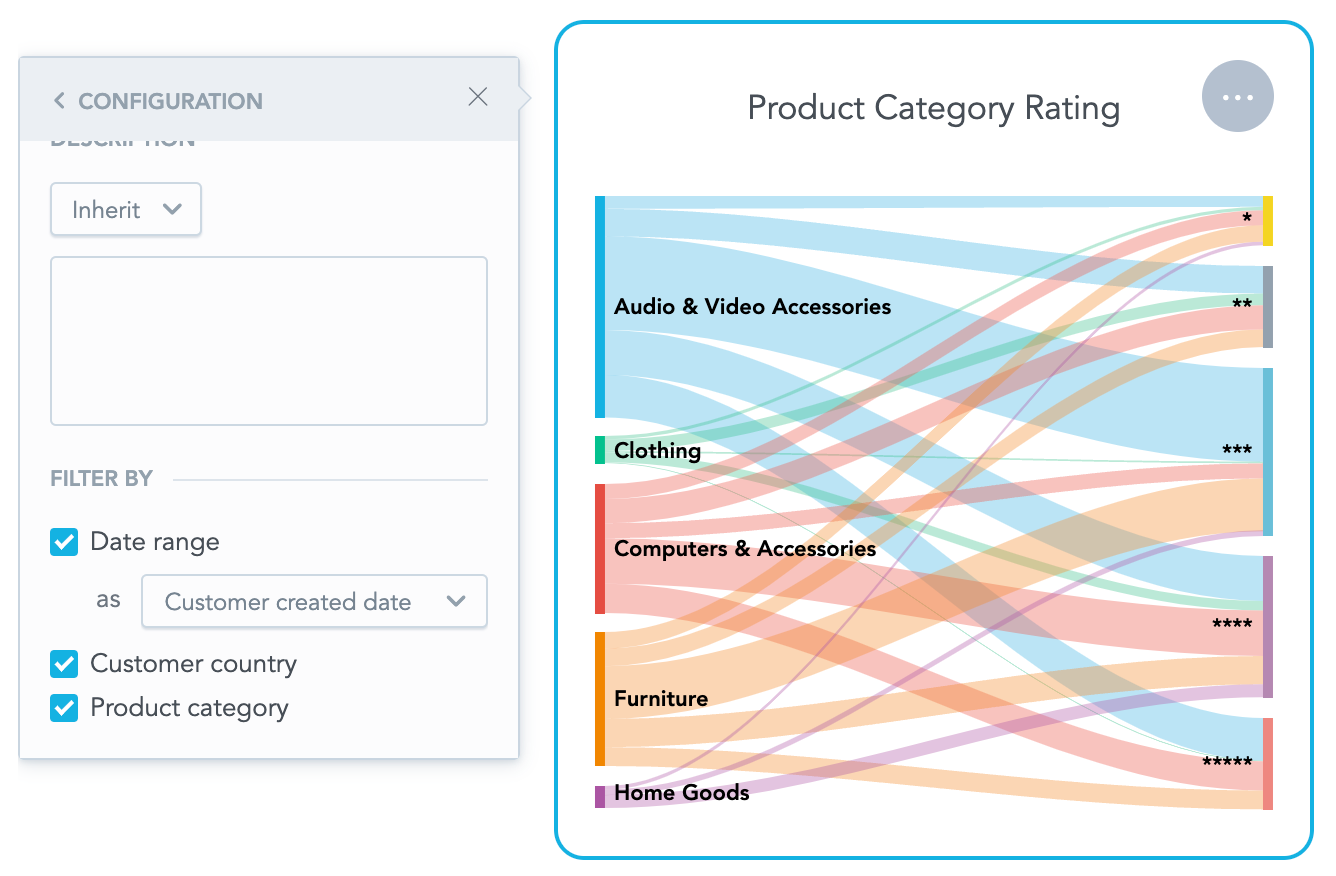
Below we have a report that shows revenue trends over time and a second report that demonstrates orders by status. Optimal business intelligence software will enable you to present these next to each other on the same dashboard, each with a different date dimension.

A report that shows the total revenue broken down by date.

A second report that demonstrates the total number of orders by their status.
8. Augmented analytics for automated insights and advanced data analysis
If your analytics solution integrates machine learning models, it greatly improves the customer experience. A modern BI tool will offer intuitive and AI-supported discovery for non-technical users, with features such as Q&A chatbots, auto-forecasting, clustering, and data cataloging. Meanwhile, technical users will benefit from tools that automate and develop ML models, seamlessly integrating them with BI analysis.
AI assistants (such as the one above) are fast becoming a must-have modern analytics feature.
9. Self-service BI: enabling independent data discovery
Self-service capabilities allow all types of end users to access their data and perform custom analyses tailored to their needs. As well as multitenancy and interactive functionality, other features you should look for in modern BI software to ensure it is truly self-service include:
- Intuitive UI: An easy-to-use UI with drag-and-drop features, plus a guided experience for users setting up their dashboards and visualizations.
- Documentation: Comprehensive resources and documentation are essential to delivering a smooth self-service experience.
- Alerts: Users should be able to receive periodic updates on their data and dashboards to keep them informed.
10. Advanced data management for scalability and performance
Today’s top BI tools feature a robust backend designed to handle data complexity, scalability, and speed. Look out for key components like an analytics lake, a composable data service layer, and advanced caching. Not sure what these terms mean? Here’s a quick overview:
Analytics lake
An analytics lake acts as a central repository for all your structured and unstructured data, offering flexibility in how data is accessed and analyzed. It enables seamless integration of diverse data sources, making it easier to deliver comprehensive insights. For businesses managing high volumes of data or dealing with diverse formats, an analytics lake ensures that no data is left behind.
Composable data service layer
With the increasing need for adaptability in BI solutions, a composable data service layer — such as FlexQuery — offers unparalleled flexibility. Built on popular open-source technologies, this layer allows you to query and consume data dynamically, enabling a more tailored approach to analytics. By decoupling the data service layer, organizations can innovate without being restricted by rigid infrastructures.
Advanced caching
Performance is critical in delivering actionable insights. Advanced caching, such as FlexCache, ensures smooth and fast data delivery by intelligently caching frequently accessed data. This minimizes the load on backend systems, saves money, and guarantees a seamless user experience, even with complex queries or large datasets.
11. Flexible deployment options: In the cloud or on your premises
Cloud solutions provide a quick time-to-market experience as the service provider handles all operations and maintenance, allowing users to focus solely on developing their analytics. However, there are potential drawbacks, such as data residency restrictions or custom security requirements. Meanwhile, a self-hosted version grants you complete control over your deployment, enabling stricter security and customized infrastructure requirements. This approach, however, comes with additional costs, including licenses and potentially the need for a specialized team experienced with the relevant technologies. It also increases the complexity of maintenance and scalability.
An optimal BI solution will offer both cloud and self-hosted options, allowing you to choose the deployment that best suits your use case.
Why does GoodData rank among the best modern BI platforms?
GoodData offers a multinenant, AI-accelerated platform with flexible deployment options, making it a strong competitor in today’s BI software market. Check out how its features compare to other popular platforms such as Tableau and Sisense, or request a personalized demo to see what the tool can do for you.
FAQs about modern BI tool features
When a BI platform lacks intuitive features such as guided onboarding or accessible self-service, business users often avoid it. Adoption suffers because the tool feels too technical or inconvenient, no matter how powerful it is behind the scenes.
A tool that struggles with larger data volumes may require expensive upgrades, custom engineering, or even replacement. Choosing a platform with proven scalability avoids these surprise costs as usage grows.
A BI tool that embeds into CRM, ERP, or productivity apps brings insights directly into daily decisions. Without this, employees may ignore dashboards that sit outside of their core workflows.
When teams can share dashboards, annotate results, and set alerts within the platform, decisions happen faster. Without collaboration, insights often get lost in email threads or static reports.
Weak governance can lead to multiple versions of the truth, where teams use inconsistent metrics. It also raises compliance and security risks, making leadership less likely to trust the analytics.
AI can suggest relevant metrics, highlight anomalies, and even answer natural language questions. This allows non-technical staff to engage directly with data instead of relying only on analysts for every request.
Strong vendor support includes training resources, community forums, and responsive technical help. These extras can make a big difference in how quickly teams adopt and get value from the tool.


