
Author
Tom Czaban
Sr. Content Writer
About
As Senior Content Writer at GoodData, Tom brings more than 20 years of experience in writing and editing across a variety of formats. He oversees all kinds of marketing assets — from landing pages to e-books and everything in between. He's also heavily involved in customer marketing, helping turn customer stories into compelling content.

Latest from Tom
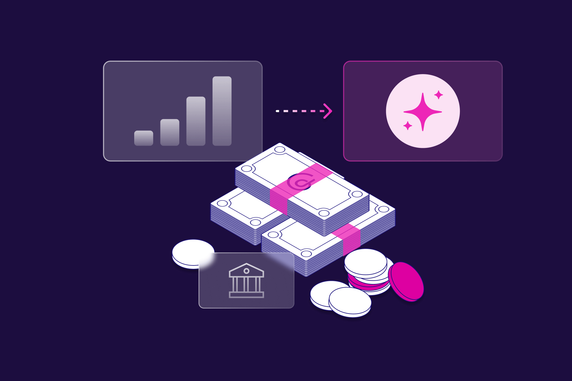
AI in Financial Services and Banking: How Organizations Progress from Analytics to Agents
Summary Financial institutions are under pressure to deliver faster, more personalized service at scale. That pressure has moved AI in banking and financial services out of innovation labs and into production. This article categorizes AI adoption into...
How to Build an AI Agent for Your Organization (Step-by-Step Guide)
Summary This tutorial breaks down the process of building an AI agent into ten clear steps. Follow these to move from an initial idea to an agent that understands your data, reasons through decisions, and automates your workflow: Define the purpose of...

AI Agent Workflows: Everything You Need to Know
Summary Agentic workflows represent the next stage of automation, where systems can interpret goals, adjust to context, and complete multi-step tasks without relying on rigid rules. This shift is supported by agentic analytics, which gives agents the data...

Security and AI in Financial Services: Balancing Innovation with Risk Management
Summary This article breaks down AI security for banks, fintechs, and payment providers. It covers common threats, compliance requirements, and the guardrails that prevent data leaks and untraceable decisions across AI agent workflows. You’ll also learn...

Agentic Analytics: The Complete Guide to AI-Driven Data Intelligence in 2026
Summary Agentic analytics is a new way of analyzing data that uses smart, autonomous agents to explore information, create insights, and take action independently. Instead of relying on traditional dashboards that react to data, the agentic approach...

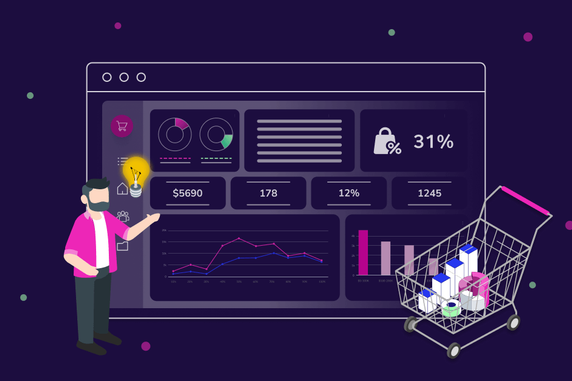
E-commerce and Retail Dashboard Examples: Transform Your Data into Actionable Insights
Summary This article highlights key dashboard examples for e-commerce and retail, showing how they bring clarity to sales, marketing, customers, inventory, and operations. Each dashboard offers practical ways to track performance and uncover insights that...
The Best Cloud Native Embedded BI Tools: How to Pick the Right Platform for Your Business
Summary This article explores what embedded cloud native BI is, how it differs from traditional tools, and why it's essential for modern applications. It highlights key features to look for, common pitfalls to avoid, real-world use cases across...
Embedded Analytics: All You Need To Know
Summary This article defines embedded analytics and explains why it has become a critical capability for modern software products and internal business tools. It describes how embedding analytics changes the way users interact with data, outlines the...

The Best Business Analytics Tools: What to Look For Before You Buy
Key Takeaways Top business analytics tools help your company make faster and smarter decisions. When choosing a tool, look for real-time dashboards, predictive analytics, scalability, and ease of integration. Understanding trends like AI and embedded...
Data Federation: What It Is and Why Your Business Needs It
Summary Getting fast, reliable answers from your data isn’t easy when it’s scattered across different tools, systems, and cloud platforms. That’s where data federation comes in. Instead of moving or copying data, federation lets you access and analyze it...

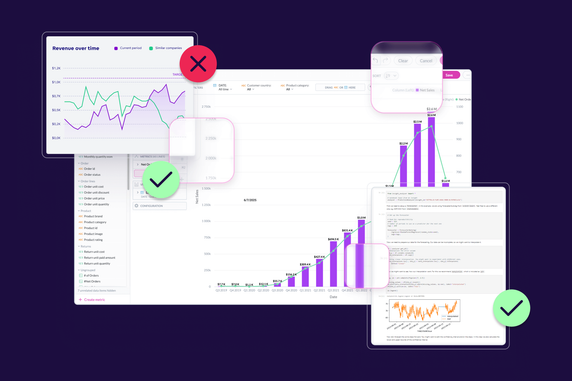
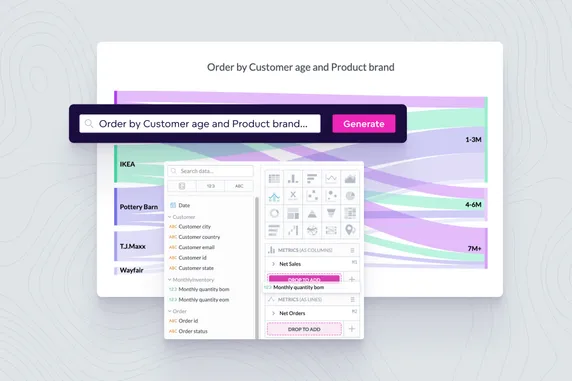
How To Use AI for Data Visualizations and Dashboards
Summary AI is changing the way teams interact with data by making visualizations and dashboards faster, smarter, and easier to use. Instead of relying on manual analysis, users can ask plain-language questions and instantly get charts, tables, or...
Financial Forecasting That Works: Everything You Need to Know
What Is Financial Forecasting? Financial forecasting is the practice of using data to estimate future financial conditions. It helps institutions anticipate changes in cash flow, balance sheets, revenue, and profitability based on internal performance and...

From Chaos to Clarity: 10 Essential Dashboards for Your Marketing Team
Marketing without measurement is like driving with your eyes closed. In today’s digital-first world, where performance metrics drive growth, marketing dashboards (powered by advanced analytics software) are essential. Whether you're a CMO tracking ROI or...
Sales Forecasting: A Complete Guide for Businesses
What Is Sales Forecasting and Why It Matters Sales forecasting is the process of estimating future revenue based on past data, current trends, and market conditions. At its core, it helps you answer a crucial question: How much are we likely to sell in...

Supply Chain Forecasting: How to Win with Data and AI
Supply chains are under pressure. Unpredictable demand. Shipping delays. Market shocks. These disruptions are more than operational setbacks. They are costly. A recent report found that disruptions cost companies an average of 6 to 10 percent of annual...

HR Dashboard Examples: The Ultimate Guide for Modern HR Teams
Summary Modern HR teams face pressure to hire faster, retain top talent, and demonstrate measurable impact. This guide explores how specialized HR dashboards transform people data into actionable insights. From tracking time-to-hire and pinpointing causes...
8 Real Estate Dashboard Examples That Drive Smarter Decisions
Summary The article highlights eight types of real estate dashboards and explains how each supports smarter decision-making across different roles. It shows how visualizing metrics such as portfolio value, rental income, occupancy rates, agent...
Predictive Analytics in Manufacturing: What It Means for the Future of Production
Summary This article examines how predictive analytics is transforming the future of manufacturing. As production lines become more complex and customer expectations rise, traditional methods are no longer enough to keep pace. By using manufacturing...

8 Essential Sales Dashboard Examples for Revenue Growth
Summary This article includes key sales dashboard examples and shows how they support various roles within a sales organization. You'll see how well-structured dashboards offer executives a high-level overview, give managers valuable team insights, and...
Predictive Analytics in Healthcare: How AI is Transforming Patient Care
Summary Predictive analytics is transforming healthcare by harnessing healthcare data to anticipate risks before symptoms appear. By detecting patterns in patient records, wearables, and other data sources, providers can intervene earlier, improve...
7 Key Supply Chain Dashboard Examples
Summary Supply chain dashboards give teams a clear view of operations by tracking the metrics that matter most. This article highlights key types of dashboards used across the supply chain, from inventory and logistics to supplier performance and demand...
Business Intelligence vs. Data Analytics: Which Do You Need?
People tend to use the terms business intelligence (BI) and data analytics interchangeably, thinking they’re the same thing. However, there are some important differences. Once you understand them, you realize the real question isn’t just “What are...
Manufacturing Dashboard Examples for Effective Optimization of Your Processes
Summary This article explores a variety of manufacturing dashboards that help improve operational performance and support better decision making. It provides examples that focus on production efficiency, inventory management, quality control, financial...
Top 11 Must-Have Features for Your Modern BI Tool
Summary Selecting a business intelligence tool is about more than just reporting dashboards. This article outlines the must-have features that modern BI platforms need, from user-friendly self-service options to powerful data models and scalable...

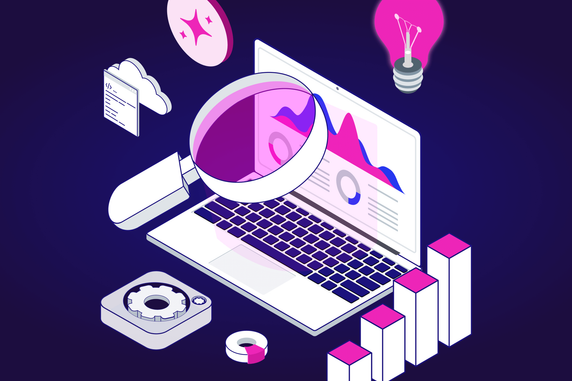
Turn Data Into Actionable Insights: 5 Steps To Apply Today
Summary In the modern business environment, having access to vast amounts of information is no longer enough; what truly drives success is the ability to transform raw data into actionable insights. But how do you go from endless rows of numbers and...

Healthcare Dashboard Examples: Different Use Cases and Their Benefits
Summary In healthcare, timely access to the right information can improve outcomes, reduce delays, and enhance coordination. Dashboards make this possible by transforming complex data into clear insights that support fast, confident decisions. This...
9 Bad Data Visualization Examples That You Can Learn From
Summary Data visualization is powerful, but when done poorly, it can confuse more than clarify. Common mistakes like misleading scales, cluttered layouts, and awkward color choices often result in visuals that misrepresent the data or distract from the...

How To Create the Best Dashboards in 6 Easy Steps
Summary Great dashboards do more than display data; they help people make faster and better decisions. But getting there requires more than just choosing the right visuals. It begins with understanding what users actually need and how those needs connect...
User-Centered Design Vs. Design Thinking: Which is Best for Building Data Products?
When designing data products, prioritizing innovation and user-friendliness is crucial. Two key methodologies that facilitate this are User-Centered Design (UCD) and Design Thinking (DT). In our webinar, Designing Successful Products with User-Centered...

Data Storytelling: 6 Tips To Help You Tell Effective Data Stories
Summary With more and more data to analyze and statistics to present, helping people make sense of it all becomes all the more challenging. Enter data storytelling, a way to turn raw data into compelling narratives that resonate with audiences. This...