7 Key Supply Chain Dashboard Examples


The supply chain industry relies on dashboards to deliver real-time insights across various operations. There are three primary types of supply chain dashboards: logistics and transportation, inventory and warehouse management, and supplier performance. From optimizing distribution networks to improving demand forecasting, these leverage data and analytics software to provide supply chain professionals with valuable benefits.
Building supply chain dashboards requires an analytics solution that can integrate data from transportation management systems, warehouse management systems, enterprise resource planning software, and IoT devices. That way, businesses have the KPIs they need to enhance efficiency, reduce costs, and mitigate disruptions.
This article explores key examples of supply chain dashboards, highlighting how they streamline operations and support strategic decision-making.
Most Common Types of Supply Chain Dashboards
1. Inventory Management Dashboard
This provides real-time visibility into stock levels, helping businesses optimize storage, reduce waste, and improve order fulfillment. Key metrics such as Inventory turnover indicate how frequently stock is sold and replaced over a period, while Days of inventory outstanding (DIO) measures how long inventory sits before being sold. Stock levels track current quantities across warehouses, ensuring businesses don’t overstock or run out of key items. Days in stock helps assess how long specific products remain in storage, helping to improve cash flow and lower storage costs. The Inventory value metric quantifies the total worth of stocked goods, helping with financial planning and cost control. Finally, Obsolete stock percentage shows how much inventory is aging or unlikely to sell, helping businesses clear it out early and cut losses. Tracking these metrics improves operations and ensures a balanced, data-driven approach to inventory control.
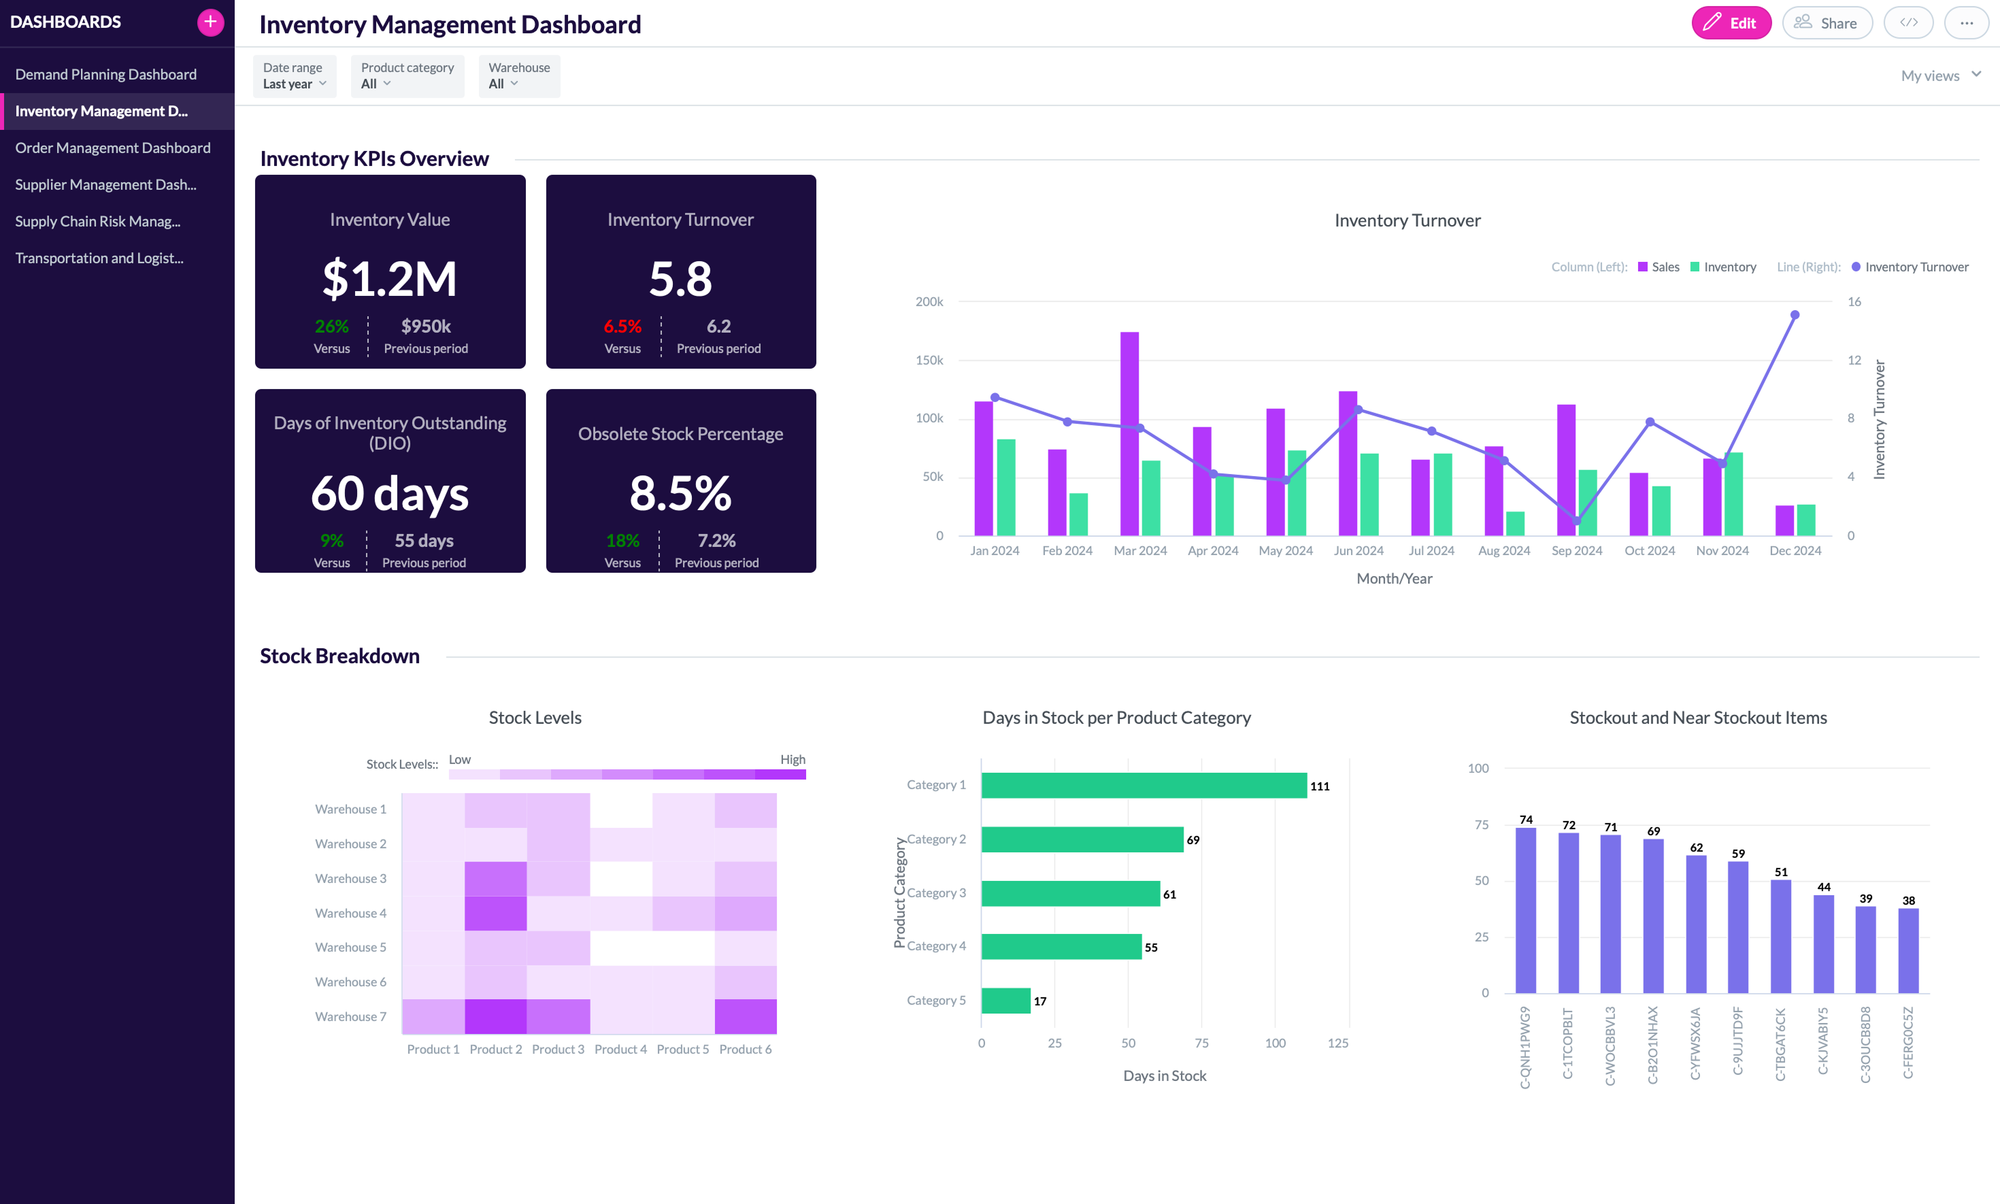
Inventory management dashboard (click image to enlarge)
2. Transportation and Logistics Dashboard
This dashboard provides a centralized view of shipping performance, costs, and efficiency, enabling businesses to streamline operations and optimize resource utilization. Transportation cost per unit helps assess the cost-effectiveness of moving goods, while On-time shipment percentage tracks delivery reliability and customer satisfaction. Freight capacity utilization measures how efficiently available shipping space is used, ensuring cost-effective logistics. Monitoring Delayed shipments helps identify bottlenecks and improve delivery timelines, while Shipments per route offers insights into route efficiency and potential optimization opportunities. Additionally, Fuel costs play a crucial role in controlling transportation expenses, making it essential to track fluctuations and improve fleet management.
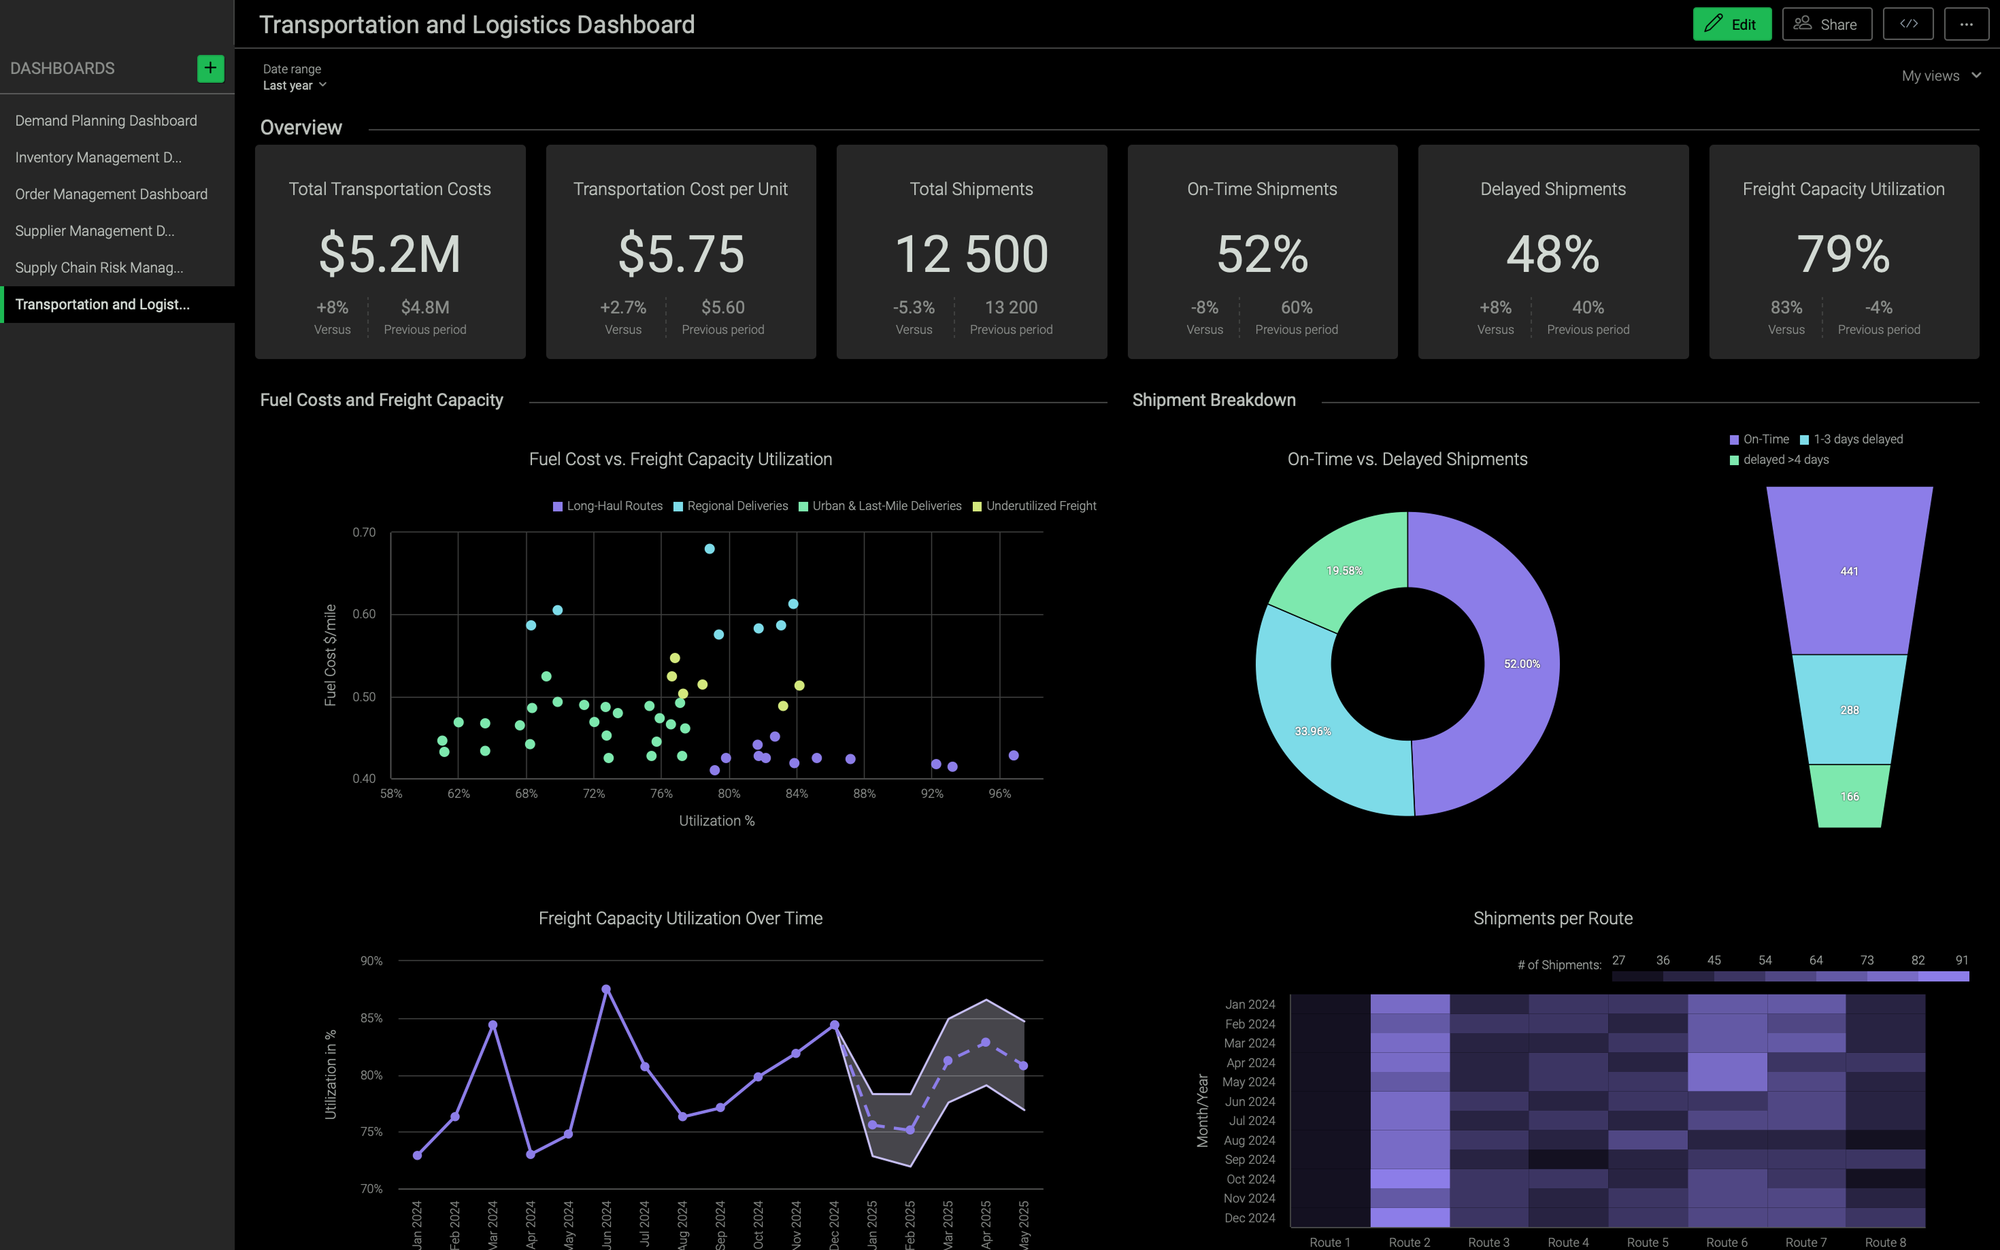
Transportation and logistics dashboard (click image to enlarge)
3. Order Management Dashboard
This provides real-time visibility into order processing, fulfillment, and delivery performance, helping businesses optimize efficiency and customer satisfaction. It tracks key metrics such as On-time delivery (OTD) to measure reliability, Order error rate to identify inaccuracies, and Order cycle time to monitor the speed of fulfillment. It also highlights Backorders, ensuring businesses can proactively address inventory shortages. Meanwhile, Total orders processed offers insights into overall demand and operational capacity, and Order fulfillment accuracy ensures customers receive the products they expected. Analyzing these metrics helps to streamline workflows and reduce delays.
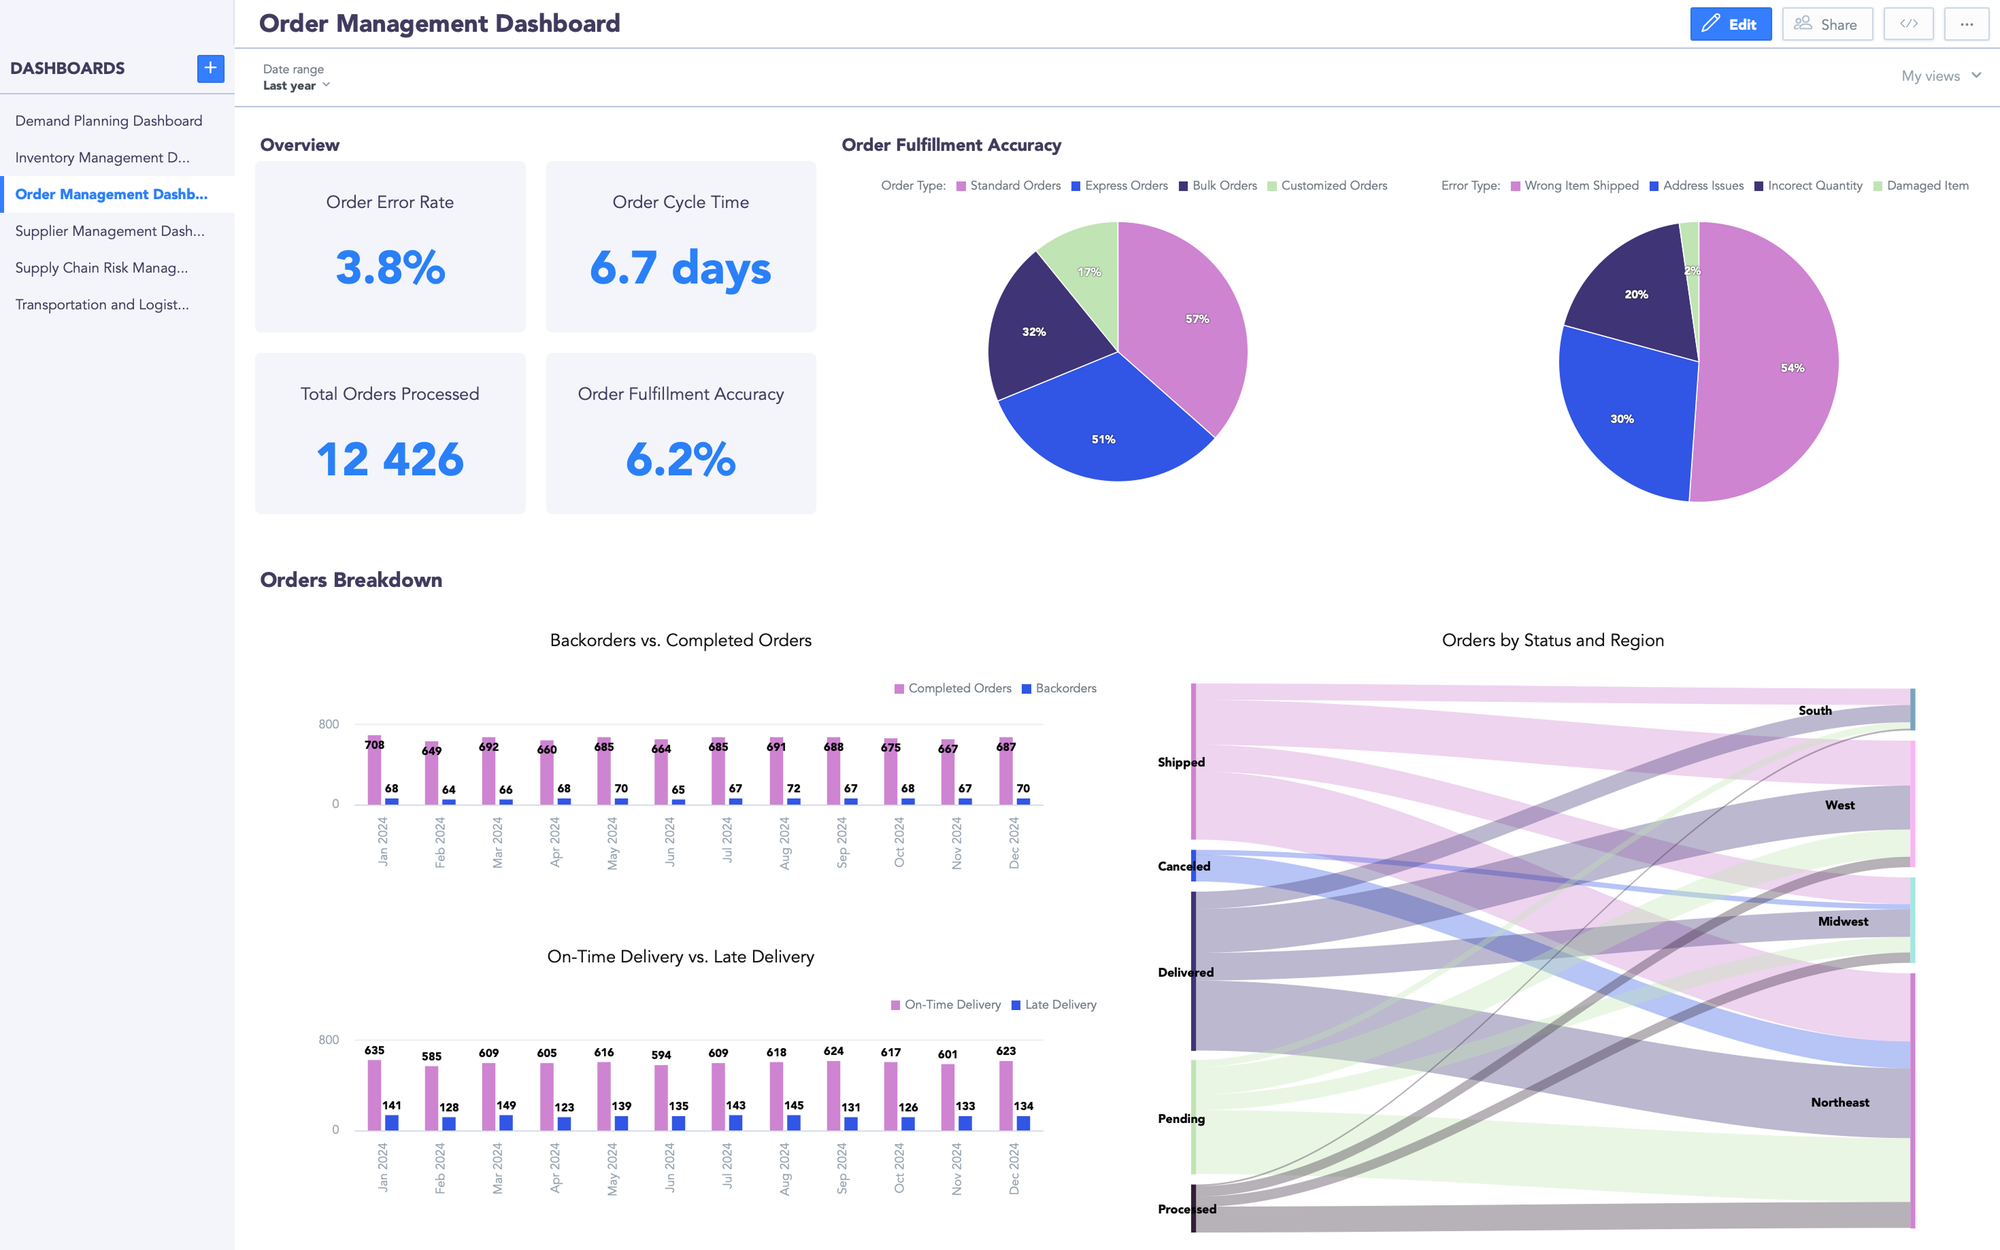
Order management dashboard (click image to enlarge)
4. Demand Planning Dashboard
This dashboard helps businesses anticipate customer needs, optimize inventory, and align supply chain operations with market demand by leveraging advanced forecasting functionality. It tracks key metrics such as Forecast accuracy to measure the reliability of demand predictions, Demand variance to identify fluctuations, and Planned vs. actual demand to check there is alignment between projections and real-world trends. With predictive analytics, businesses can adjust inventory and production levels to prevent shortages or overstocking. Cost of lost demand shows missed revenue opportunities due to stockouts, while Fill rate ensures that a high percentage of demand is met in relation to available inventory. By integrating forecasting capabilities, a demand planning dashboard also enhances supply chain agility.
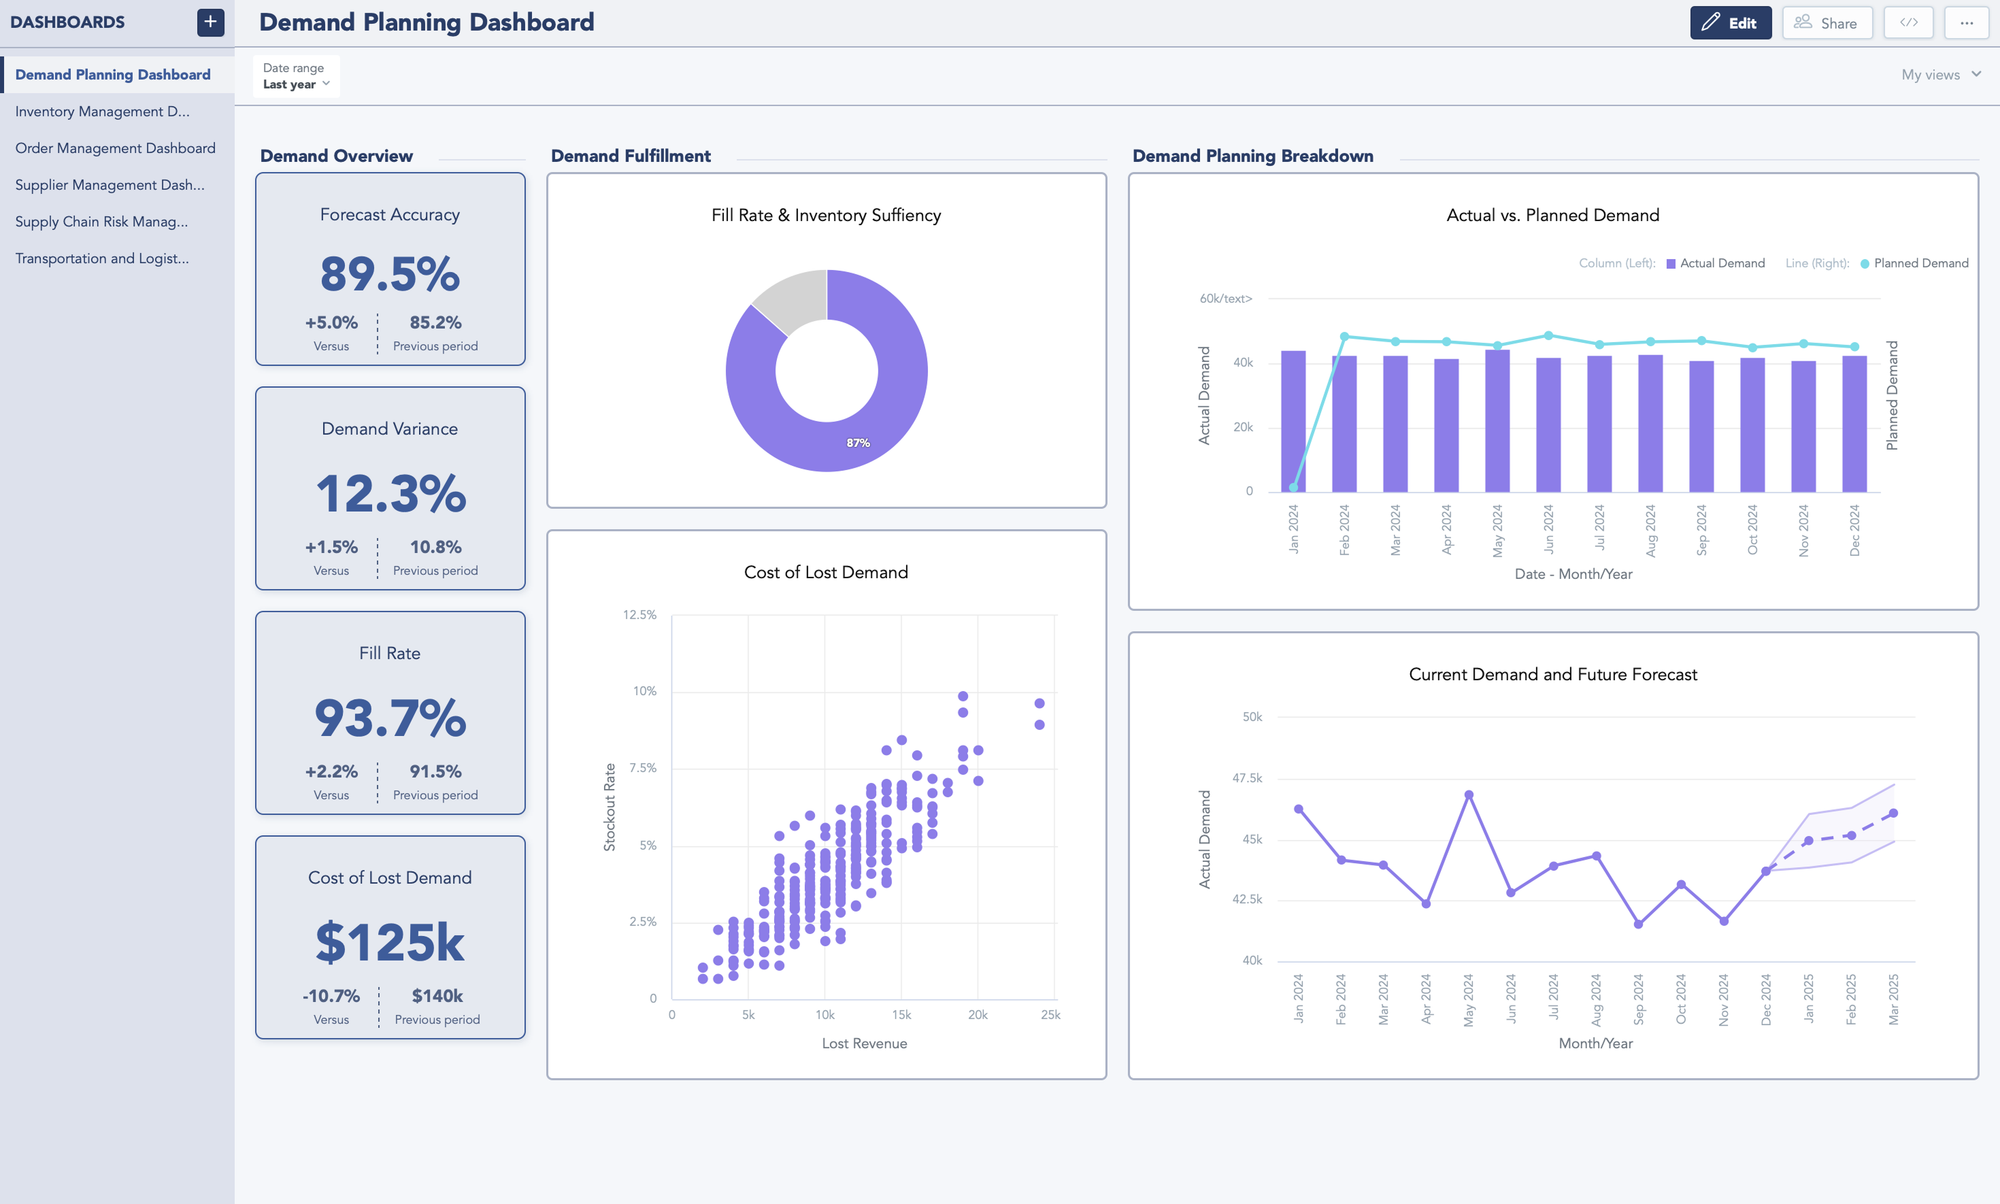
Demand planning dashboard (click image to enlarge)
5. Supplier Management Dashboard
This provides a comprehensive view of supplier performance, helping businesses evaluate and strengthen their supply chain partnerships. It tracks key metrics such as Supplier quality rate to assess the consistency of materials received, Supplier on-time delivery to ensure reliability, and Cost of suppliers to monitor procurement expenses. Additionally, Supplier defect rate helps identify quality issues that could impact production, while Supplier scorecard performance provides an overall assessment of supplier effectiveness based on multiple performance indicators.
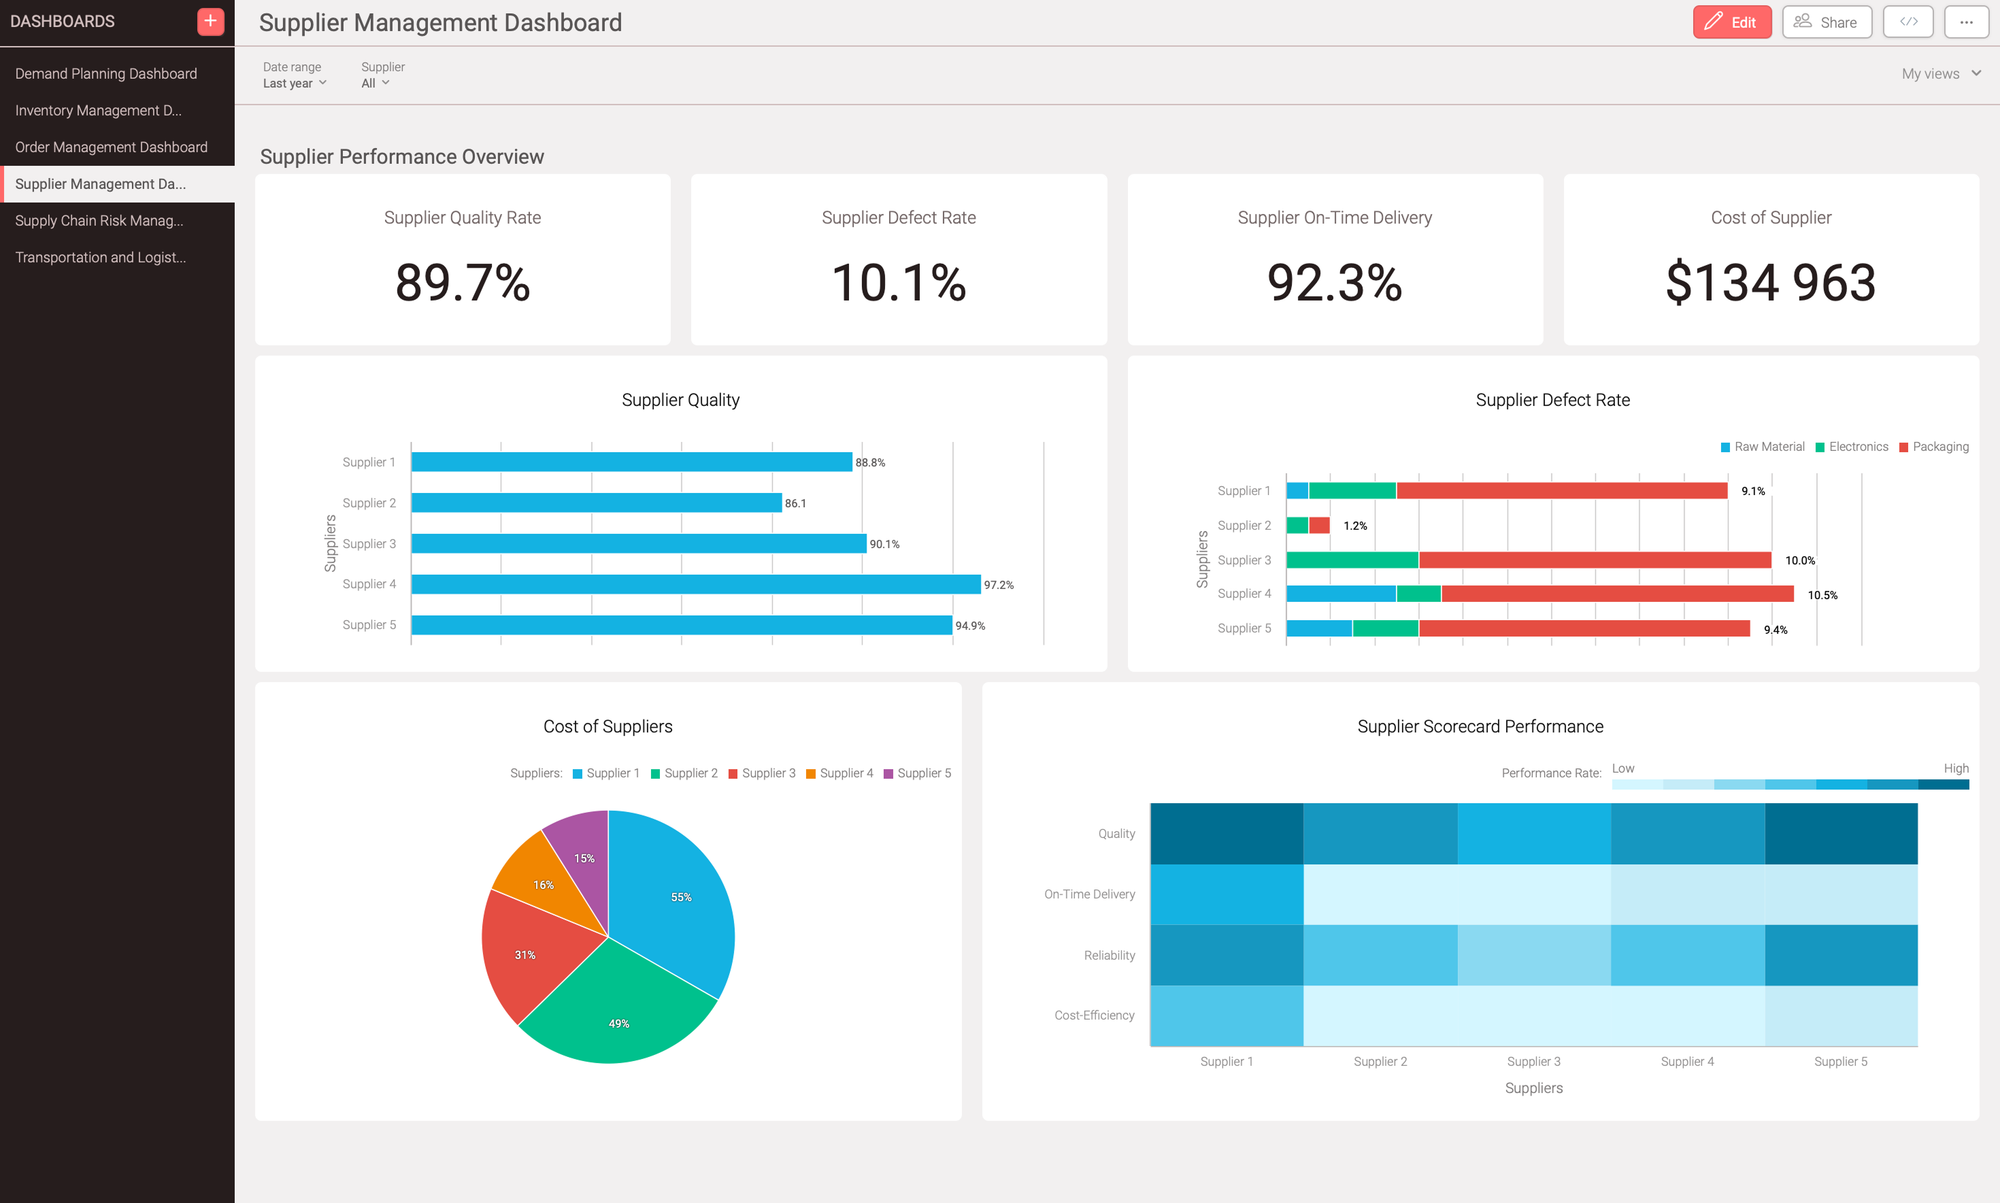
Supplier management dashboard (click image to enlarge)
6. Supply Chain Risk Management Dashboard
This dashboard tracks metrics such as Supply chain cycle time to monitor the efficiency of end-to-end processes, Total supply chain cost to manage expenses and optimize spending, and Perfect order rate to evaluate order accuracy and reliability. Additionally, Resource utilization ensures that labor, materials, and transportation are used efficiently, while Total delivery delays highlight bottlenecks and potential risks in logistics. Overall, the dashboard helps businesses identify, assess, and mitigate potential disruptions by providing real-time visibility into key operational risks.
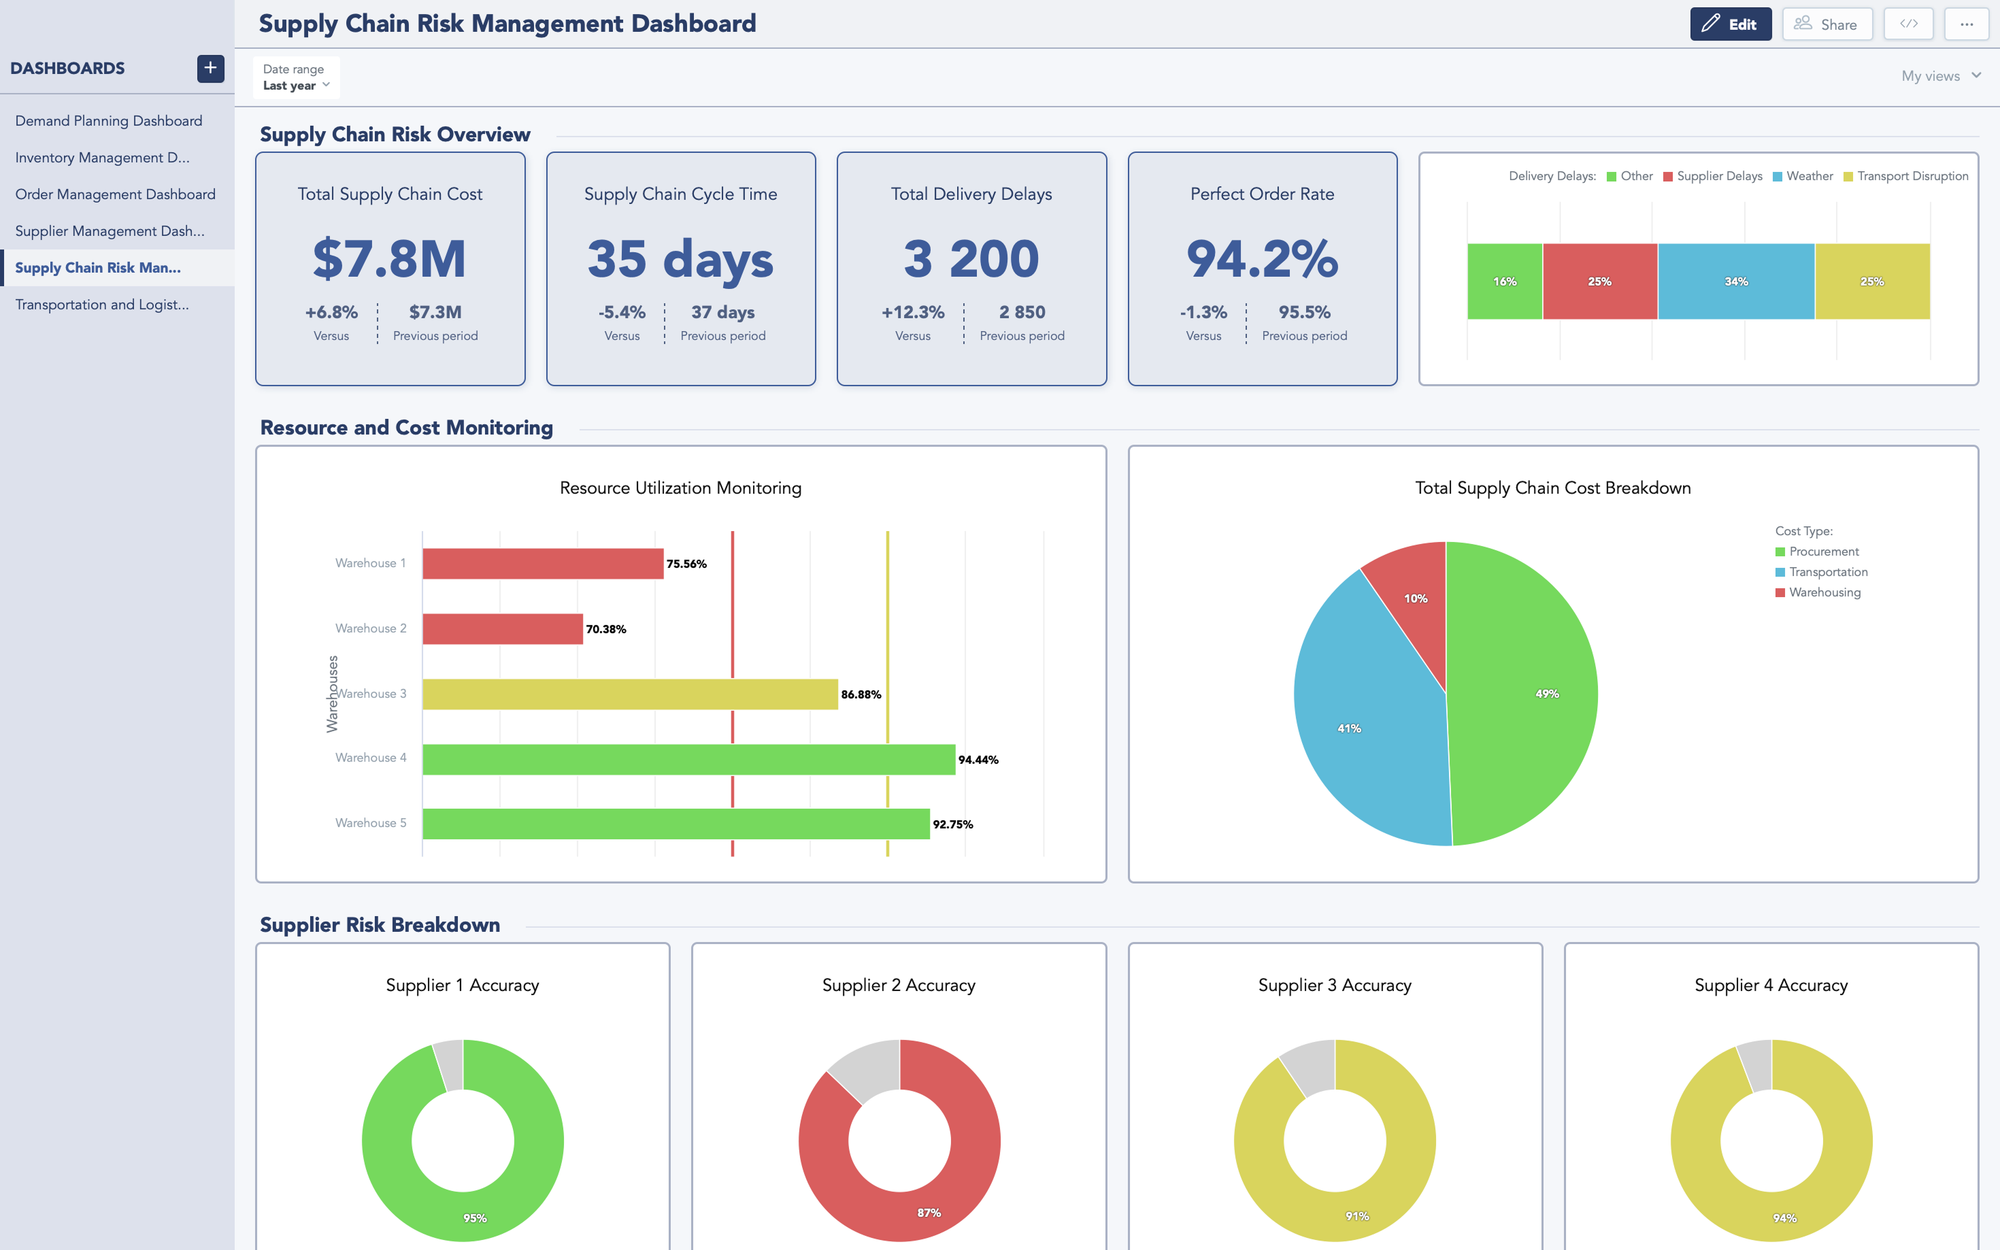
Supply chain risk management dashboard (click image to enlarge)
7. End-to-End Supply Chain Dashboard
One of the most frequently built dashboards for supply chain, this combines KPIs from the previous examples to provide a comprehensive, real-time view of the entire supply chain, from procurement to final delivery. The dashboard integrates data across multiple functions, including sourcing, production, inventory, logistics, and customer fulfillment. Tracking key metrics such as inventory levels, order fulfillment rates, supplier performance, transportation costs, demand forecasts, and delivery timelines, enables businesses to optimize efficiency and reduce costs. When built with advanced analytics software that allows for predictive insights, an end-to-end supply chain dashboard helps organizations streamline workflows and maintain a customer-centric supply chain.
Create Your Own Supply Chain Dashboards with GoodData
GoodData’s intuitive platform makes it easy to create supply chain dashboards like the examples in this article. But while dashboards and drag-and-drop tools are essential, they’re only part of the equation for a truly successful analytics strategy. A good modern BI tool should go beyond visualizations and provide advanced features like data modeling, scalability, automation, and seamless integration with your existing tech stack. To learn more about this, check out the 11 must-have features of a modern BI tool.
Alternatively, browse our customer stories to see how real businesses leverage GoodData to build scalable, high-performance analytics solutions tailored to their needs. Or schedule a demo to explore how our platform can help you drive operational excellence with a comprehensive, future-proof BI approach.


