Data analytics platform, ready for the future
Build scalable data products that give end users exactly what they need — from trustworthy and tested data to an intuitive no-code UI.


Why GoodData Analytics?
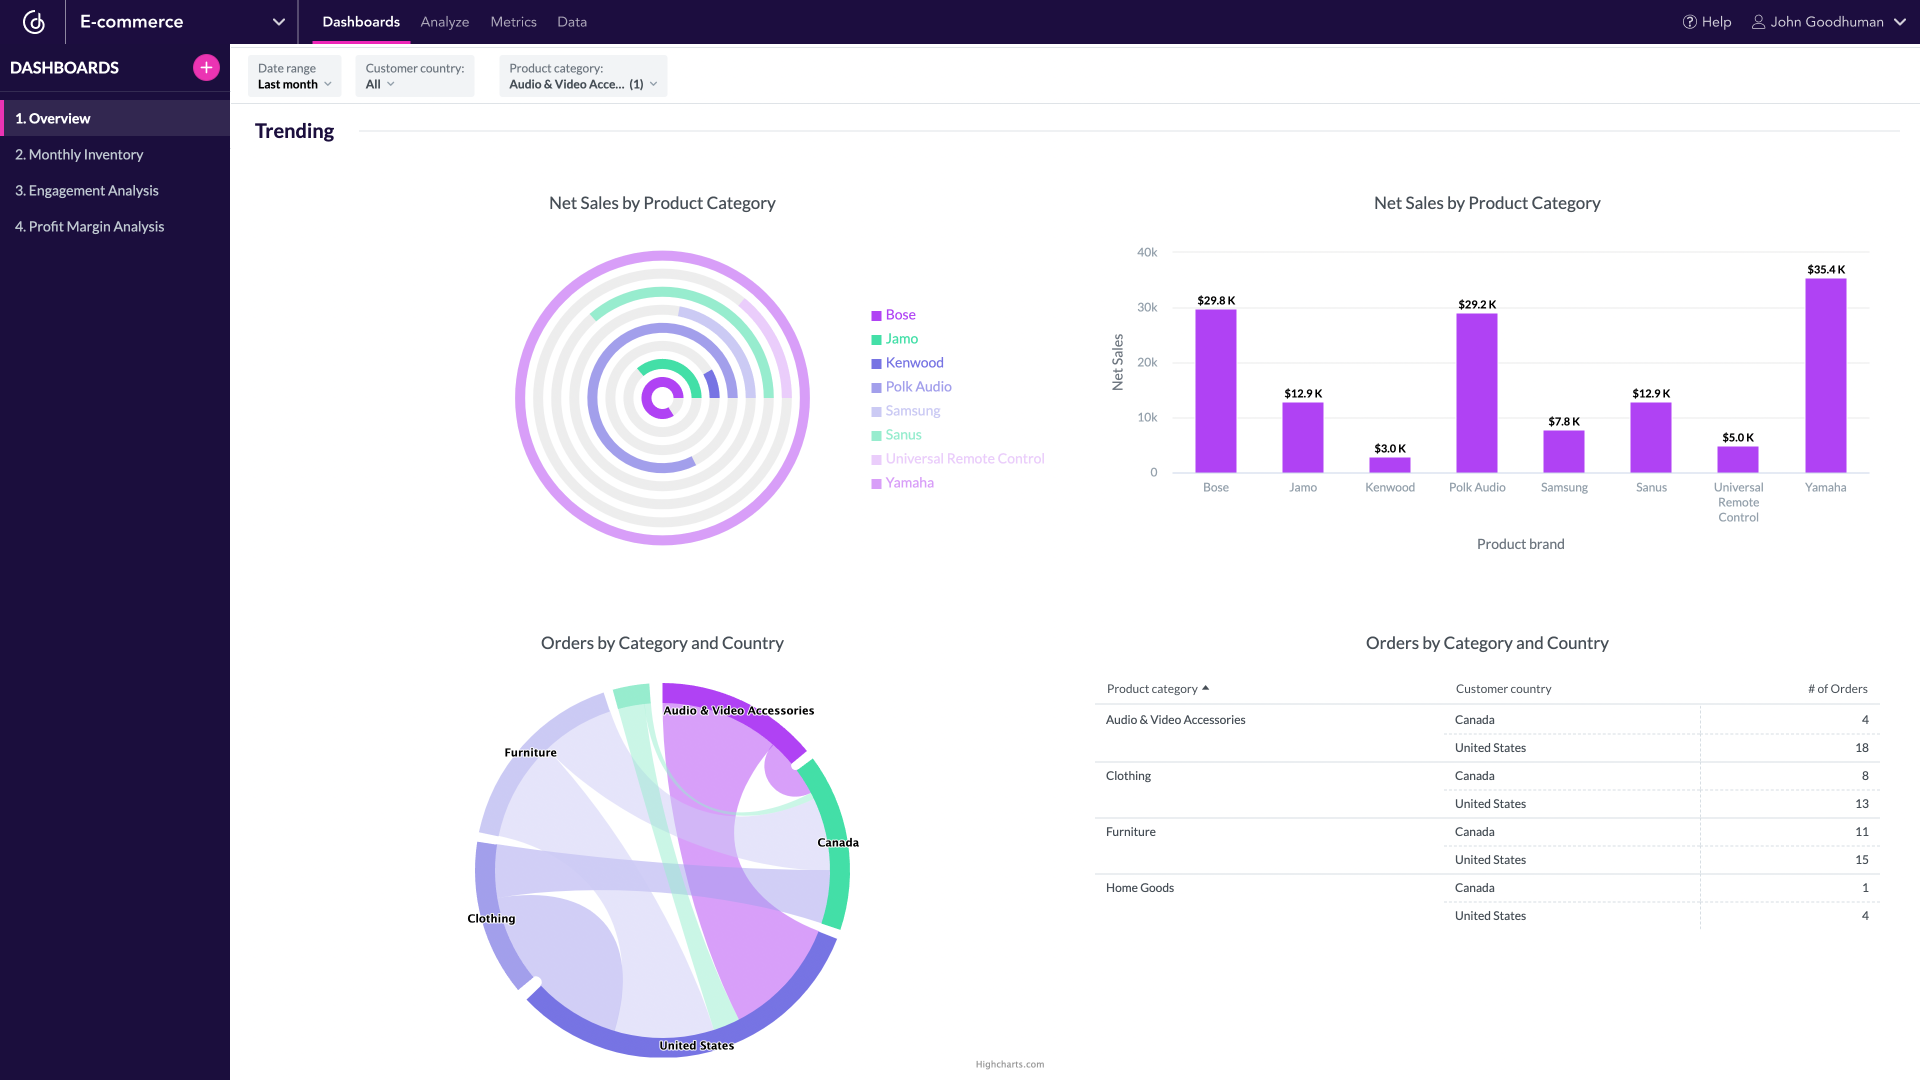
Access endless possibilities to customize your visualizations
- Create new visual elements in the GoodData visualization tool to craft custom-designed dashboards.
- Style the look and feel of your analytics with your company's branding – including fonts, colors, and logos.
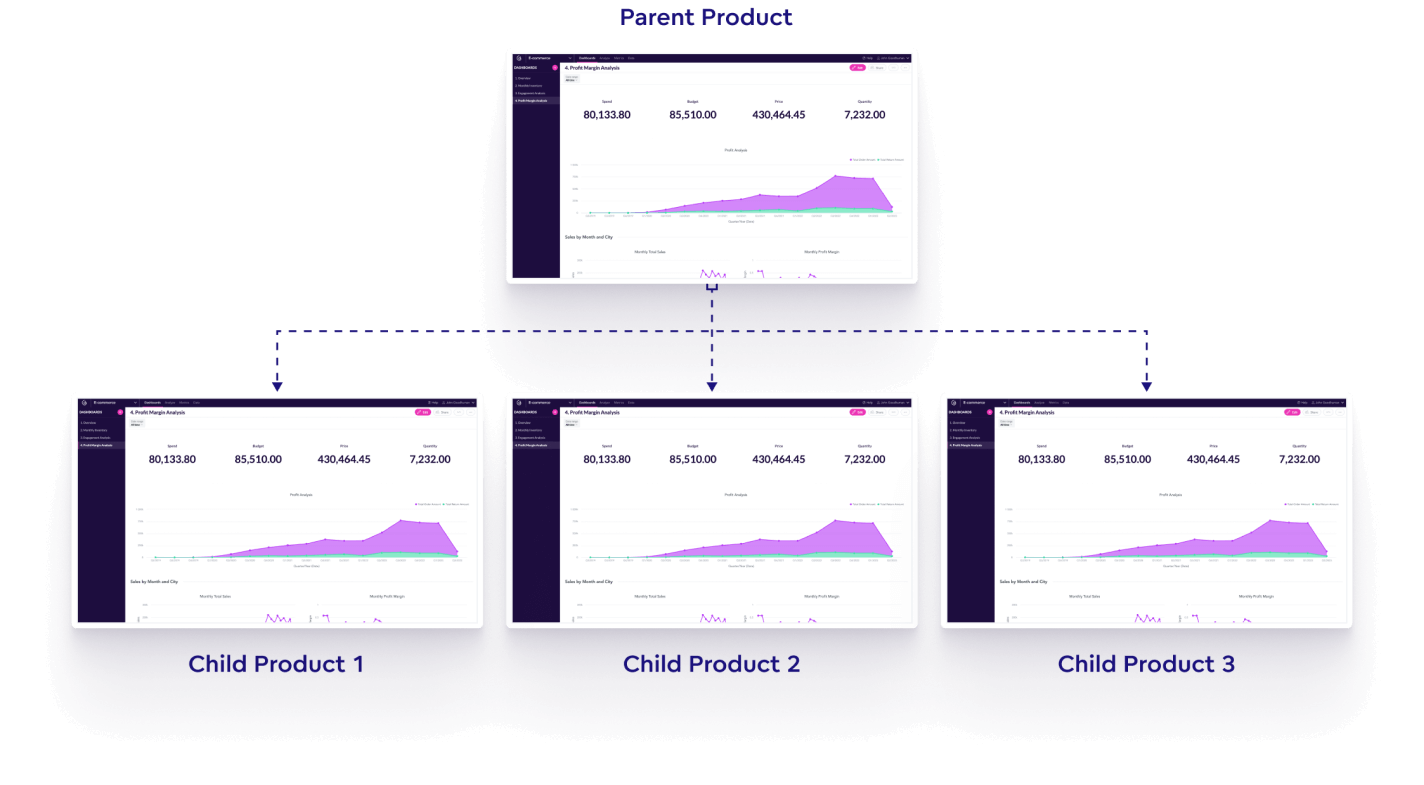
Scale your analytics with our multi-tenant architecture
Dynamically scale your analytics and accommodate increases in data volume, end users, and business partners.
- Distribute personalized analytics instances to teams, partners, or customers via multitenancy.
- Advanced caching delivers great performance and keeps cloud data warehouse costs low.
Distribute analytics wherever your users need it
Seamlessly embed interactive charts and dashboards into your apps, web portals, and workflows.
- Embed via React SDK, Web Components, or iFrame.
- Customize and white label to match your brand.
Harness the power of AI for unmatched efficiency
- Use AI to rapidly create data products and integrate analytics capabilities wherever your users need them.
- AI-powered features like forecasting, key driver analysis, and NLQ mean faster insights and faster decisions (test it in GoodData Labs).
Boost productivity with Analytics as Code
- Create analytics environments faster than ever before with our code-based developer tools and blueprints.
- Integrate analytics with CI/CD pipelines to automate development.
Design and implement analytics solutions in weeks—not years
GoodData's professional services will cover discovery, design, development, testing, launch, and maintenance to ensure success across the entire data and analytics lifecycle.

Everyone gets something from GoodData

Skills: All code
Benefit from flexibility, re-usability and customization of “everything as code” as well as API and SDKs.

Skills: Low code
Benefit from agility, skill improvement with “explain” functionality, small code edits, and time to value.

Skills: No code
Benefit from ease of use and AI-supported discovery via our FlexAI chatbot, auto-forecasting, and clustering.

Melissa McSherry
SVP and Global Head of Data, Security, and Identity Products at Visa
Melissa McSherry
SVP and Global Head of Data, Security, and Identity Products at Visa

Josh Collins
Chief Product Officer at Zartico
Josh Collins
Chief Product Officer at Zartico
3,000%
Customer growth
3,000%
Customer growth

Sam Boonin
Vice President of Products at Zendesk
Sam Boonin
Vice President of Products at Zendesk

John Morhous
CTO of FCM Travel Solutions
John Morhous
CTO of FCM Travel Solutions

Christopher Marin
Dir. of Digital Marketing Ecosystem and Analytics at DXC Technology
Christopher Marin
Dir. of Digital Marketing Ecosystem and Analytics at DXC Technology
206%
Increase in MQLs
206%
Increase in MQLs
Enjoy a wide range of features to develop and manage your data apps
GoodData analytics connects with


And is secured by


A trusted platform.
Loved by users.
Engineer | <50M USD
Exceptional Experience with GoodData Team
Working with the GoodData team has been truly exceptional. I came in at a later part of the project but felt great with the support of the GoodData team even with less context than others.
Product manager | Mid-market
Easy to use and fantastic support staff make this a great reporting option
We are using GoodData to help our clients with their employee engagement reporting dashboard metrics and insights. This allows for our clients to see at a glance the effort their engagement methods success rate looks like.
General Management - Finance Industry | 3B - 10B USD
GoodData Platform Accelerates Solution Development
The team at GoodData has operated as a true partner, working collaboratively with our team to develop new solutions. The platform has empowered more internal users and clients to explore data, create new analytics, and find new insights without adding more work to the development team. Our overall velocity to release new solutions has improved.
Senior Manager | Small business
Serious platform for data processing, collection and visualization
I loved the way GoodData helps simplify integration, and interactive reports give the user a holistic view of the data. It makes it easy to automate data analysis and charts.
Chief Product Officer | Small business
GoodData makes choosing a technology partner, not just a technology vendor, easy!
GoodData helps us scale quickly and allows us to build a modern data stack to serve the global travel and tourism industry. If you're looking to discover a partner with a vision for the modern data stack and analytics anywhere, then GoodData is exactly who you should partner with.
Consultant | Mid-market
GoodData has been a game changer for us! Amazed!
We are using GoodData to simplify data analytics and make better decisions for us. It helps our teams create clear dashboards some good reports that are easy to act on.
Executive Manager | Enterprsie
GoodData: a fluid end-to-end experience
We liked the simplicity of connecting different data sources, the ways of processing data into facts and dimensions and arranging them in lightweight and intuitive dashboards.
VP, Engineering | <50M USD
GoodData Cloud: Internal and Embedded Analytics with a Push for Analytics as Code
We have been customers of GoodData for multiple years now and recently switched to their newest product, GoodData Cloud. We are obviously quite happy with the product, especially after migrating to the Cloud version and using it for both internal and embedded customer-facing analytics.
Product Manager | Mid-market
Powerful and accessible
When it comes to familiarity and comfort with digital tools, our user base tends to be on the less experienced side. It was important to us that our white-labeled analytics solution had customizable reports and dashboards that were within reach for them, but also powerful enough for internal use and to serve the smaller segment of users with analytics experience.
Head of Engineering and Technology | Small business
Excellent product for embedded analytics.
We're using GoodData to embed dashboards and data visualizations in our product. Our users were asking for insights into their business based on the data being generated in our product.
Senior Product Manager | 50M - 250M USD
Powerful Scalable BI Tool perfect for B2B2C products
Top notch sales team that wasn't pushy, helped under the gun with a proof of concept short time frame project. Helpful customer success representative. Lot of personalized interactions and touch points.
Business Intelligence Analyst | Enterprise
An analytics solution for a wide variety of businesses
A very robust solution that delivers what it's meant to - analytical dashboards to analyze any business operation, "data democratization", that allows any end user to have simple access to data, without any technical requirements, and support for long-term requirements from it's customers.
Director of Operations | Small business
Couldn't have done it without GoodData.
The platform is second to none when it comes to embedded analytics. The charts are top-notch, and the accuracy is superb. They have the capability to tie into multiple data sources, data warehouses, databases, and data source managers.
Account Manager | Mid-Market
My Experience with GoodData tool: A game changer!
Good Data is solving & addressing multiple business problems like consolidating scattered & unorganized data. Data spread on multiple platforms can be compiled on Good Data which makes it easily accessible to analyze. Also, Good Data simplifies complex analytics. Not everyone in a business is a data expert, so it makes analytics user-friendly. With clear visuals and straightforward insights, even non-tech-savvy team members can understand and use the data effectively. By providing real-time data, Good Data helps the business make effective decisions. It also helps in identifying trends and patterns which helps business in creating efficient future plans. Good Data is a superhero for many business problems.
IT Services - IT Services industries | 50M - 250M USD
Data analytics and management at its best
As a digital payment and transaction processing organization having a proper data analytics and management tool is paramount. Gooddata comes in handy as a platform to gather, analyze, and visualize information to be able to make informed decision on our day to day activities.
Analyst | Mid-Market
Great BI tool for data visualizations.
Cool visual data model design. It's easy and intuitive to build and share insights with the team. I love the way I can embed insights. There's everything we need – ETL, data storage, dashboards.
Engineer | Small business
GoodData removed months of work from our IT department.
With GoodData we are able to deliver fine-grained dashboards in days not months. We check the dashboards on a daily basis, which gives us an almost real-time overview of the revenue, best-selling products, and warehouse status.
Marketing Director | Small business
Make the data work for you
GoodData makes it simple to connect data and transform it into dashboards for critical analysis. It is a simple system with which anyone on the team can analyze and suggest new data, without the need for an engineering team.
Assistant Manager | Enterprise
Go with GoodData if you are looking for the best end-to-end BI solution.
GoodData is a really amazing and powerful solution which provides a semantic layer, metric layer, and on top of it also provides a data visualization tool. It is very user-friendly to build. Also you will get docs and videos which help you to understand the tool and how things work.
Research and Development - IT Services Industry | 30B + USD
Robust platform, competitive reporting, and customized dashboards
After examining a number of data systems, GoodData is the most user-friendly and scalable for the needs of my company. The original and logical coding used for data analysis and chart development is something I really like. I like being able to control users through invites and monitor how they utilize my dashboards. Customer Care was more than eager to help us comprehend how the platform functions, determine whether it was a suitable fit for our use case, and guide us as we underwent the review process.
Data Analyst | Mid-Market
Incredible insight tool.
It's a beautiful tool for dealing with data coming from multiple sources and creating reports. GoodData helps my company connect the various points of analysis in one place, providing data-driven intelligence to everyone on my team.
Account manager | Mid-Market
GoodData is my best decision so far!
We leverage GoodData to enhance business intelligence and analytics. The platform enables way to easy integration of various data sources, that helps us to get valuable insights. We use the customizable dashboards and reporting tools, my personal fav feature of GoodData. IT professionals like us can monitor performance and make data-driven decisions, fostering efficiency and innovation in their operations.
Data and Analytics - Consumer Goods Industry | 1B - 3B USD
The best choice for data management and visualization
GoodData Platform is a great tool that helps me in creating dashboards and the metrics provided are not too complicated compared to other alternatives. GoodData Platform has positively impacted our organization and allowed us to a comprehensive end-to-end solution for storing, collecting, and analysing large volumes of data.