About
Summary
Today’s users expect actionable data insights inside the tools they already use, and success depends on designing the right experience for each audience, not just dropping charts into an app. As companies turn internal analytics into customer-facing data products, embedding becomes the enabler, and AI assistants expand what’s possible with natural-language exploration and in-product insights.
This guide answers the practical questions about what to embed, how to scale customers and data, and how to keep it secure, fast, and maintainable, so teams of any size can build a seamless experience.
Step 1: Define What to Embed (and for Whom)
One of the first and biggest decisions you'll need to make is what to embed and who for. This is where many teams go off track, either by trying to do too much at once or playing it too safe and delivering too little value.
Think about what your users need to see and do. Based on this, you might want to embed:
- A high-level dashboard for executives to track KPIs
- Specific reports or insights for operational users
- Self-service dashboards with an AI assistant that helps users explore the data themselves
The key point here is that not all users need the same thing. An admin might need full control over configuration and data models, while a sales manager might just want to see current pipeline metrics. A consumer, on the other hand, will likely want to click around and explore data on the fly. Tailoring the experience by role keeps it focused and usable.
Also, remember to consider levels of guidance. Some users need summary insights, others want to drill into the raw data. Defining levels of data granularity helps keep things manageable while also opening up opportunities for monetization. You might consider offering:
- Basic views for all users
- More detailed access for premium tiers or enterprise customers
- Role-specific content based on permissions and use case
Self-service tools empower users to explore data on their own, but they work best when paired with curated views that highlight the most relevant information. The right balance depends on the data literacy of your users and the goals of your product.
In practice, most teams embed a mix. For example:
- A customer success platform might embed health score dashboards for account managers, with drilldowns for support agents.
- A finance tool might offer curated reports for executives and an AI assistant for teams or customers to explore trends on demand.
- A product analytics solution might embed dashboards for product managers and raw event data access for data scientists.
The key is to think in terms of user value. Embedding works best when it is focused, relevant, and easy to interact with.
Step 2: Choose the Right Embedding Method
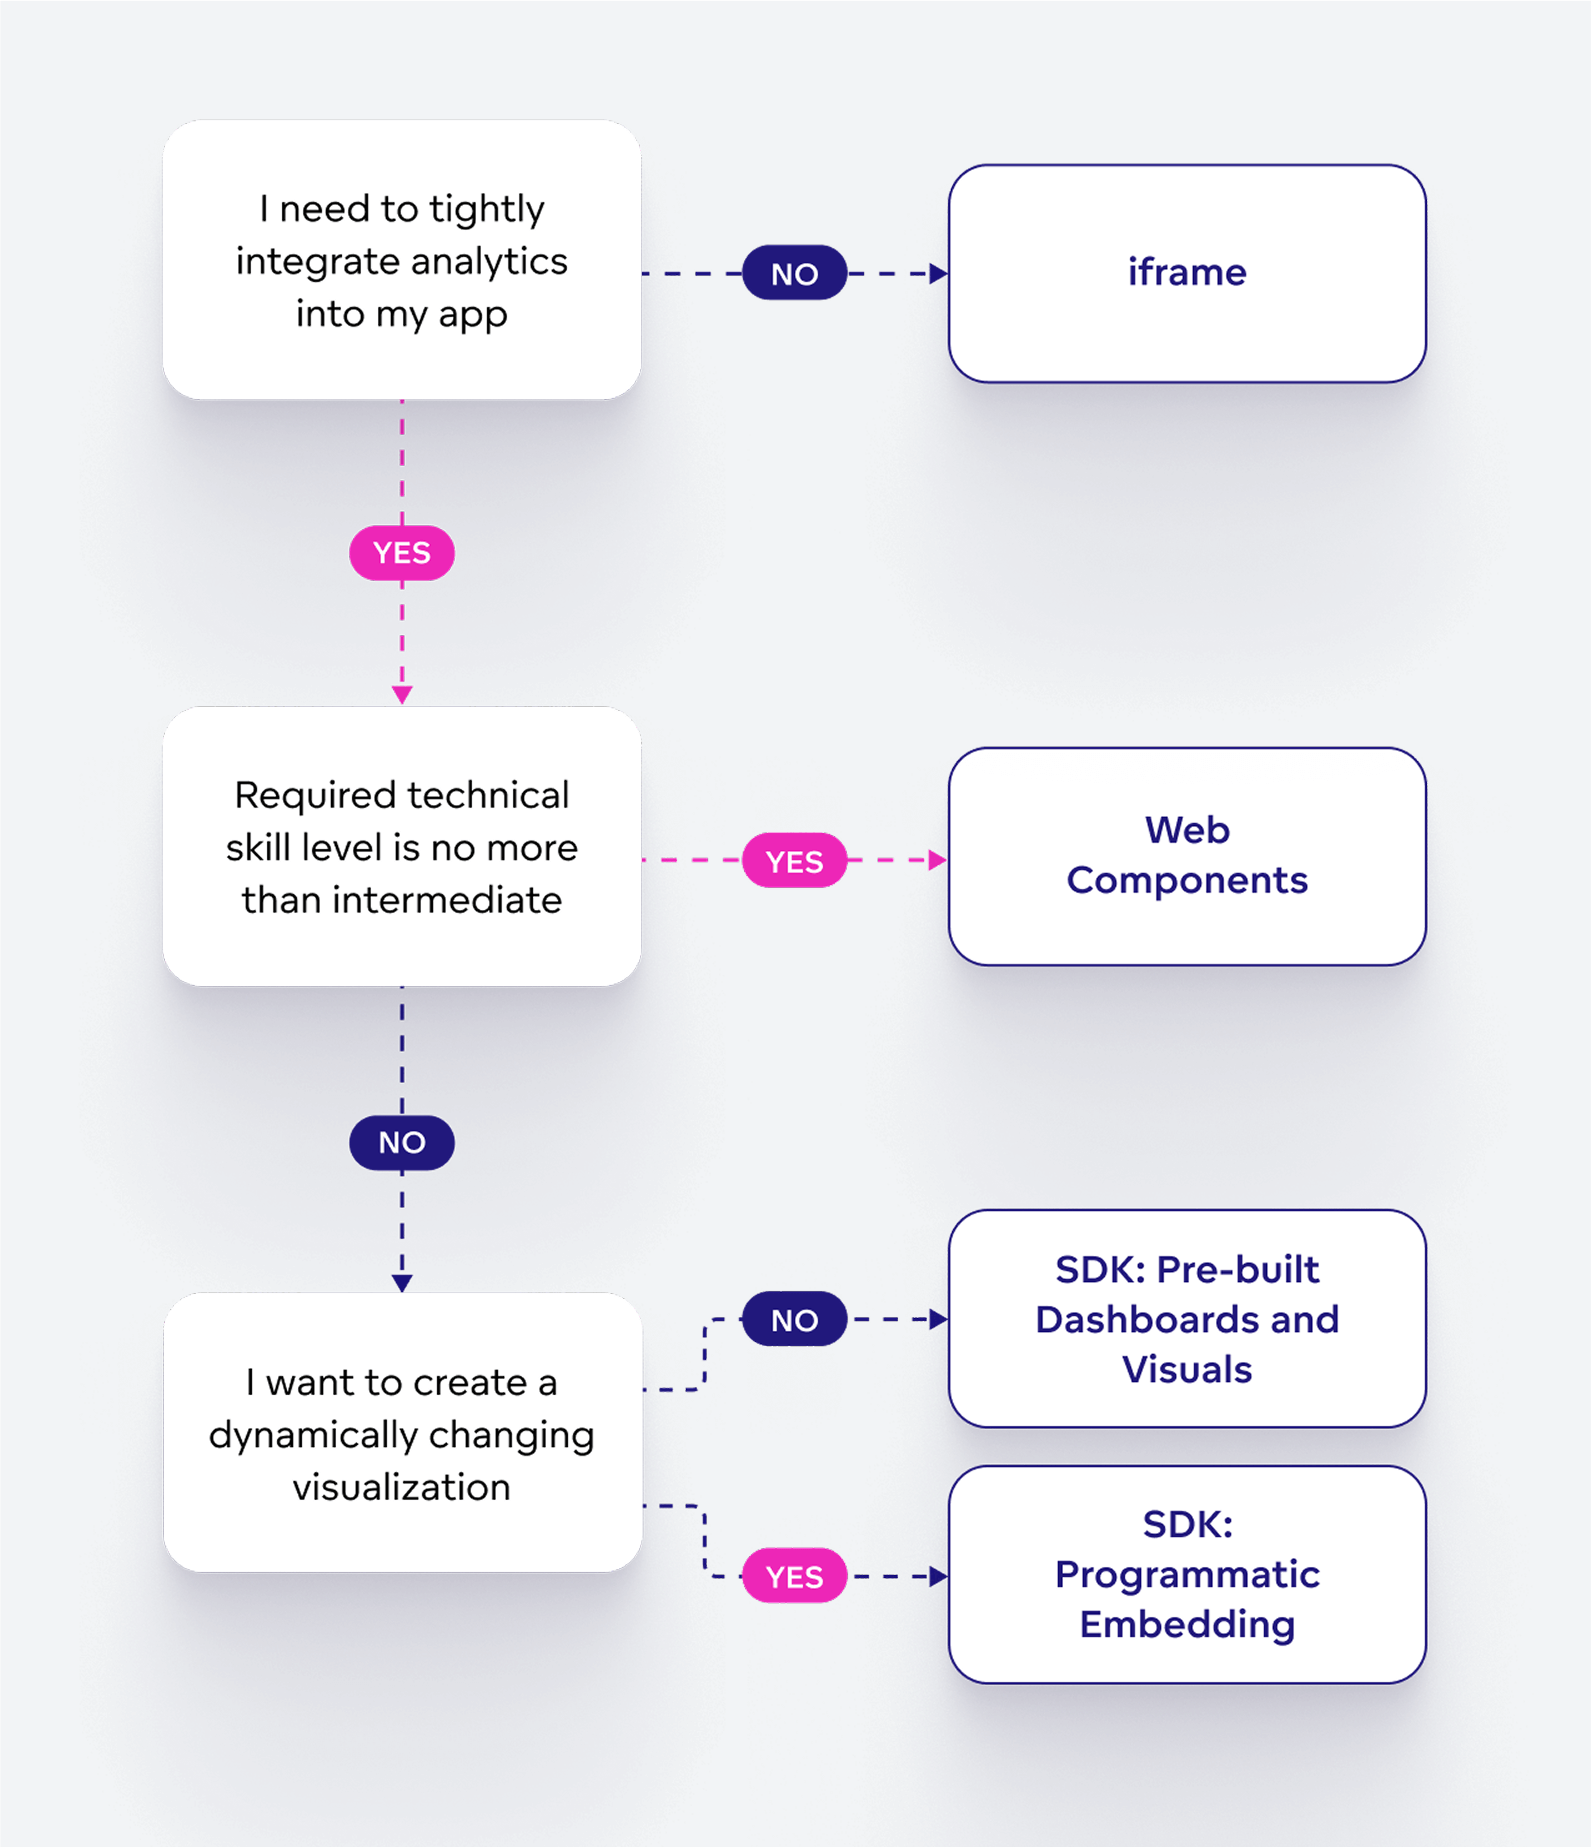
Before you start building, take a step back and look at your embedding options: Iframes, SDKs, Web Components, and APIS. Which of these you choose will shape how the analytics fit into your product and how easy it is to scale or update later:
- IFrames are simple to implement and fast to deploy. They are often the easiest way to get started, especially when you need something up and running quickly with minimal engineering effort, like a PoC for example.
- Web Components strike a balance between ease and flexibility. They are reusable, customizable, and often quicker to implement than a full SDK approach.
- SDKs (e.g., React SDK) offer deeper integration and more control. They give your developers the tools to tailor the user experience and create highly interactive features that feel native to your app.
To choose the right embedding method, consider the depth of integration you need, your team’s technical skillset, and how you expect your product to evolve. A team with strong front-end experience might lean toward SDKs for full control. A smaller team focused on time-to-market might start with iframes. Of course, you will also need to consider the technology your product or app is based on (e.g., React, Angular, etc.)
It also helps to consider how important branding and customization are. White labeling can make the embedded analytics feel like a native part of your product rather than an add-on. Most methods support brand alignment to some degree, but SDKs and web components typically offer more flexibility for styling and behavior.
The diagram below is designed to help you decide which embedding method to use. If you’re still unsure what would work best for you, talk to us. We’ll happily explain the embedding options in more detail and point you in the right direction.
Step 3: Plan for Multiple Users and Customers from Day One
As your product gains traction, the demands of serving multiple users and customers quickly grow. What starts simple can become complex; managing roles, permissions, data access, and settings across different environments adds up fast. Without a clear plan from the beginning, scaling becomes a challenge and maintaining security gets even tougher.
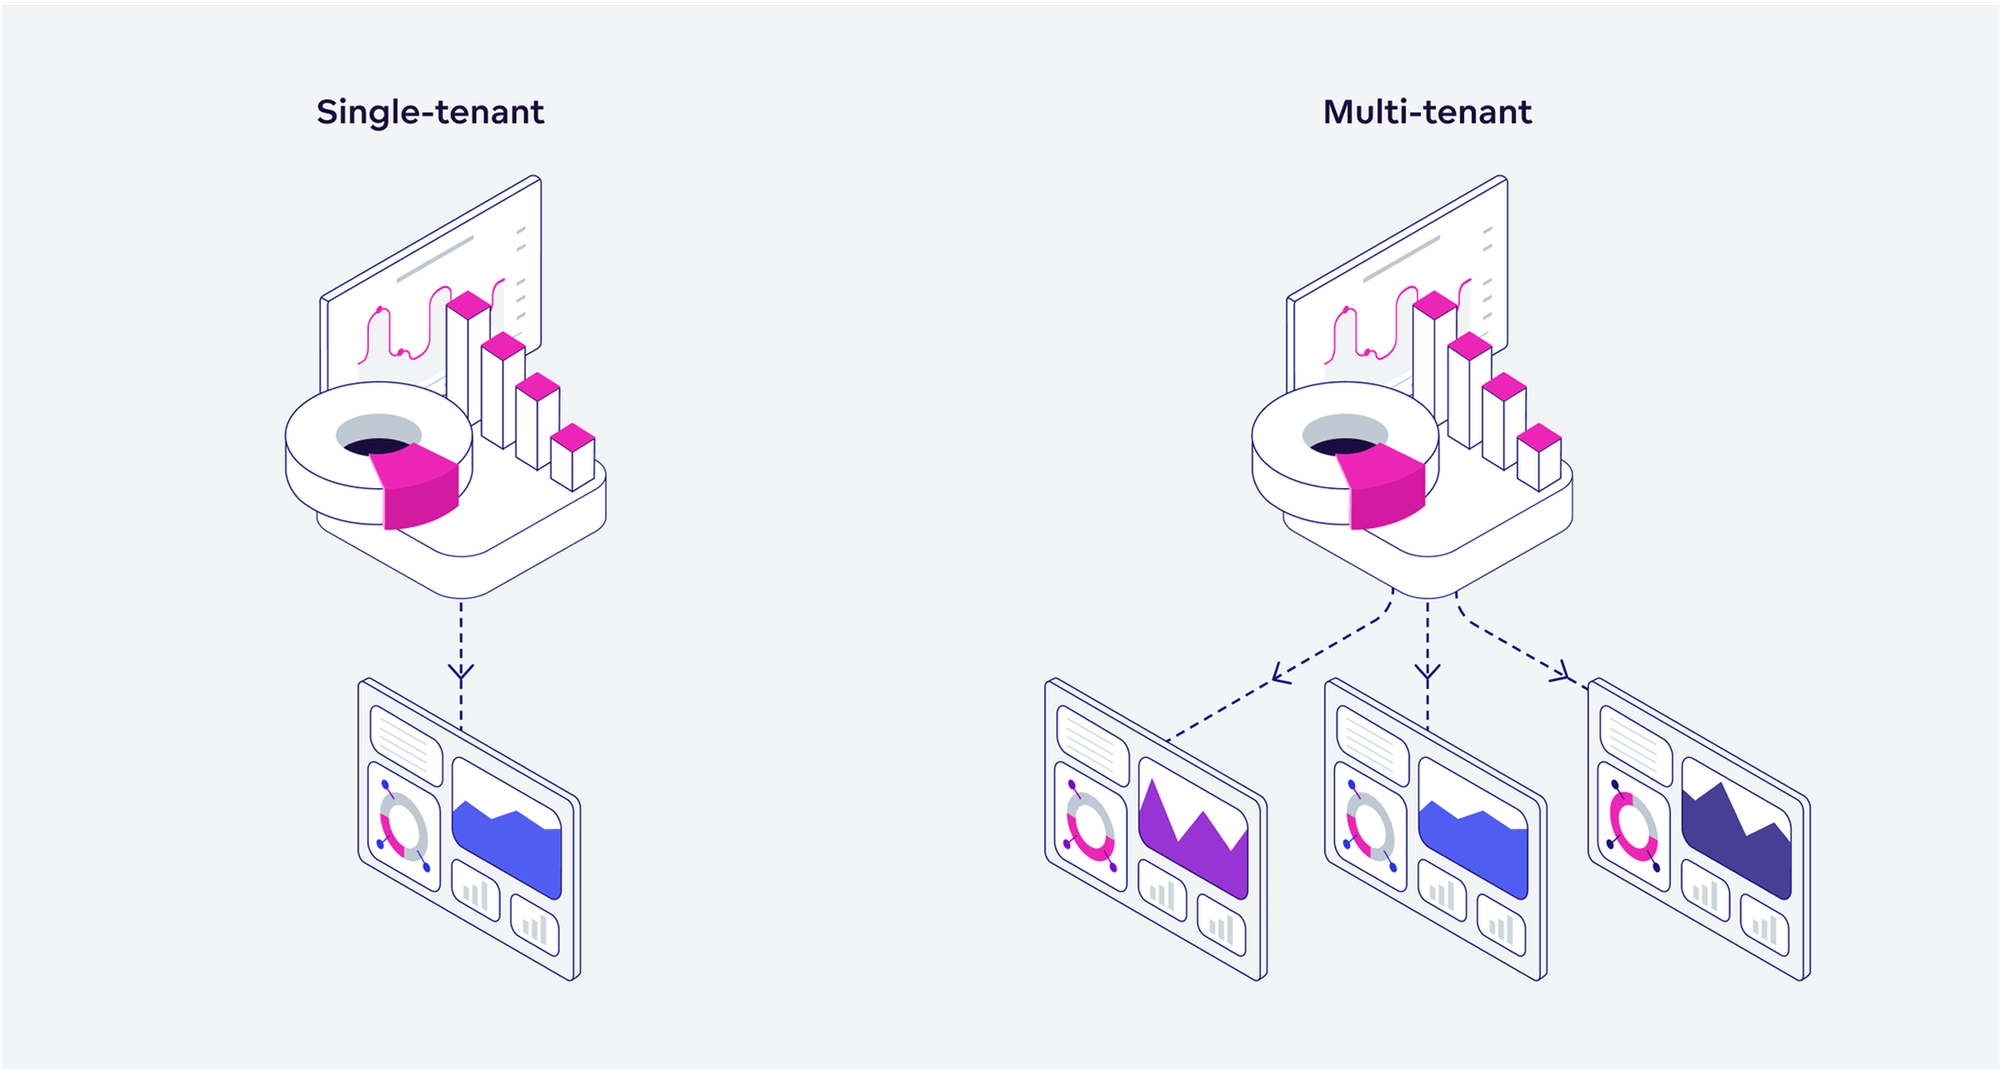
Multitenancy helps solve this by allowing you to serve multiple customers or internal teams from a single analytics environment (while keeping their data and experiences completely separate). Instead of creating a new setup for every customer, you build once, manage centrally, and adjust only where needed.
There are two main multi-tenant models to choose from. A shared model uses one infrastructure for all tenants, keeping data and access separated through configuration. This is easier to manage and more cost-effective. An isolated model gives each tenant their own environment, offering greater flexibility but requiring more effort to maintain. Your decision will depend on how much customization and data separation each group needs.
Once your structure is in place, focus on control. Every user should see only what they need. That means setting up roles, permissions, and metadata per tenant so the right people see the right insights. This not only improves the experience but also reduces risk and support overhead.
Finally, simplify your operations by centralizing tenant management. Provisioning, access updates, and configuration should be easy to replicate and scale. The more you can automate, the less time you’ll spend on manual setup later.
Step 4: Build for Performance and Scalability
If dashboards load slowly or users hit limits when exploring data, they’ll stop using them. Worse, they may question the accuracy of the insights. That’s why performance and scalability should be built in from the start rather than treated as something to fix later.
Start by thinking about scale across three dimensions: users, data volume, and the amount of content you’re delivering. As adoption grows, so does the load on your infrastructure. Automating how your system scales to meet that demand is critical. This includes not just backend resources, but also how you manage and deliver new analytics assets across your user base.
To help with this, bring software development best practices into your analytics process. Use continuous integration and continuous delivery (CI/CD) pipelines to deploy changes safely and consistently. This includes everything from dashboard updates to metric definitions. A structured release process helps avoid breaking experiences for users and keeps your product stable as you grow.
To stay ahead of issues, set up performance monitoring and regression testing. You want to catch slow queries, rendering issues, or usage bottlenecks before your users do. The more visibility you have into system behavior, the faster you can respond and improve.
Version control is another key piece. Tracking changes to metrics, reports, and configurations means you can roll back quickly when needed and iterate with confidence. Analytics, like software, should evolve, and versioning helps you do it safely.
Step 5: Secure and Govern Your Analytics End-to-End
Trust is the foundation of any successful analytics experience. If users doubt the data or worry about privacy, adoption slows. And when sensitive information is exposed or compliance is missed, the impact can be serious. Security and governance are not just technical concerns; they are essential to delivering reliable insights and long-term value.
Start by controlling who can see what. Role-based permissions help manage access at every level, ensuring users only interact with the data that matters to them. Adding single sign-on keeps the experience seamless and secure across your application.
From there, focus on consistency. Centralizing your business logic and metric definitions with a semantic layer ensures everyone is working from the same source of truth. This helps avoid confusion and creates alignment across teams.
Build testing and validation into your workflow. Before updates go live, check that dashboards display accurate results, filters work properly, and changes do not introduce errors. Use auditing tools to track updates, monitor performance, and flag unusual activity.
Compliance should not be an afterthought. Whether you are handling internal policies or meeting industry certifications, your analytics setup needs to support clear controls, reliable processes, and ongoing monitoring. That way, you can scale with confidence while staying within the rules.
Step 6: Design Your Embedded Analytics with Monetization in Mind
Embedded analytics can be more than a UX boost. When it’s treated as a core product capability, it can also drive revenue. A common path is to include basic analytics for all users, then monetize advanced dashboards, AI assistants, or predictive insights through premium tiers or add-ons, using engagement data to refine pricing.
Real-Life Data Monetization Example
Instead of making customers build and maintain reporting infrastructure, Stackless delivers analytics as a self-service, pay-as-you-go offering. Customers connect and prepare data, then purchase insights on demand without involving sales or adding staff. Built on a modern platform with automation, scalable workspaces, and a semantic layer, Stackless can onboard new customers quickly and deliver insights at scale, turning embedded analytics into a revenue stream of its own.
Step 7: Future-Proof Your Embedded Analytics Stack
Future-proofing your embedded analytics stack is not just a nice idea; it is a necessity if you want to stay competitive and avoid painful rebuilds later.
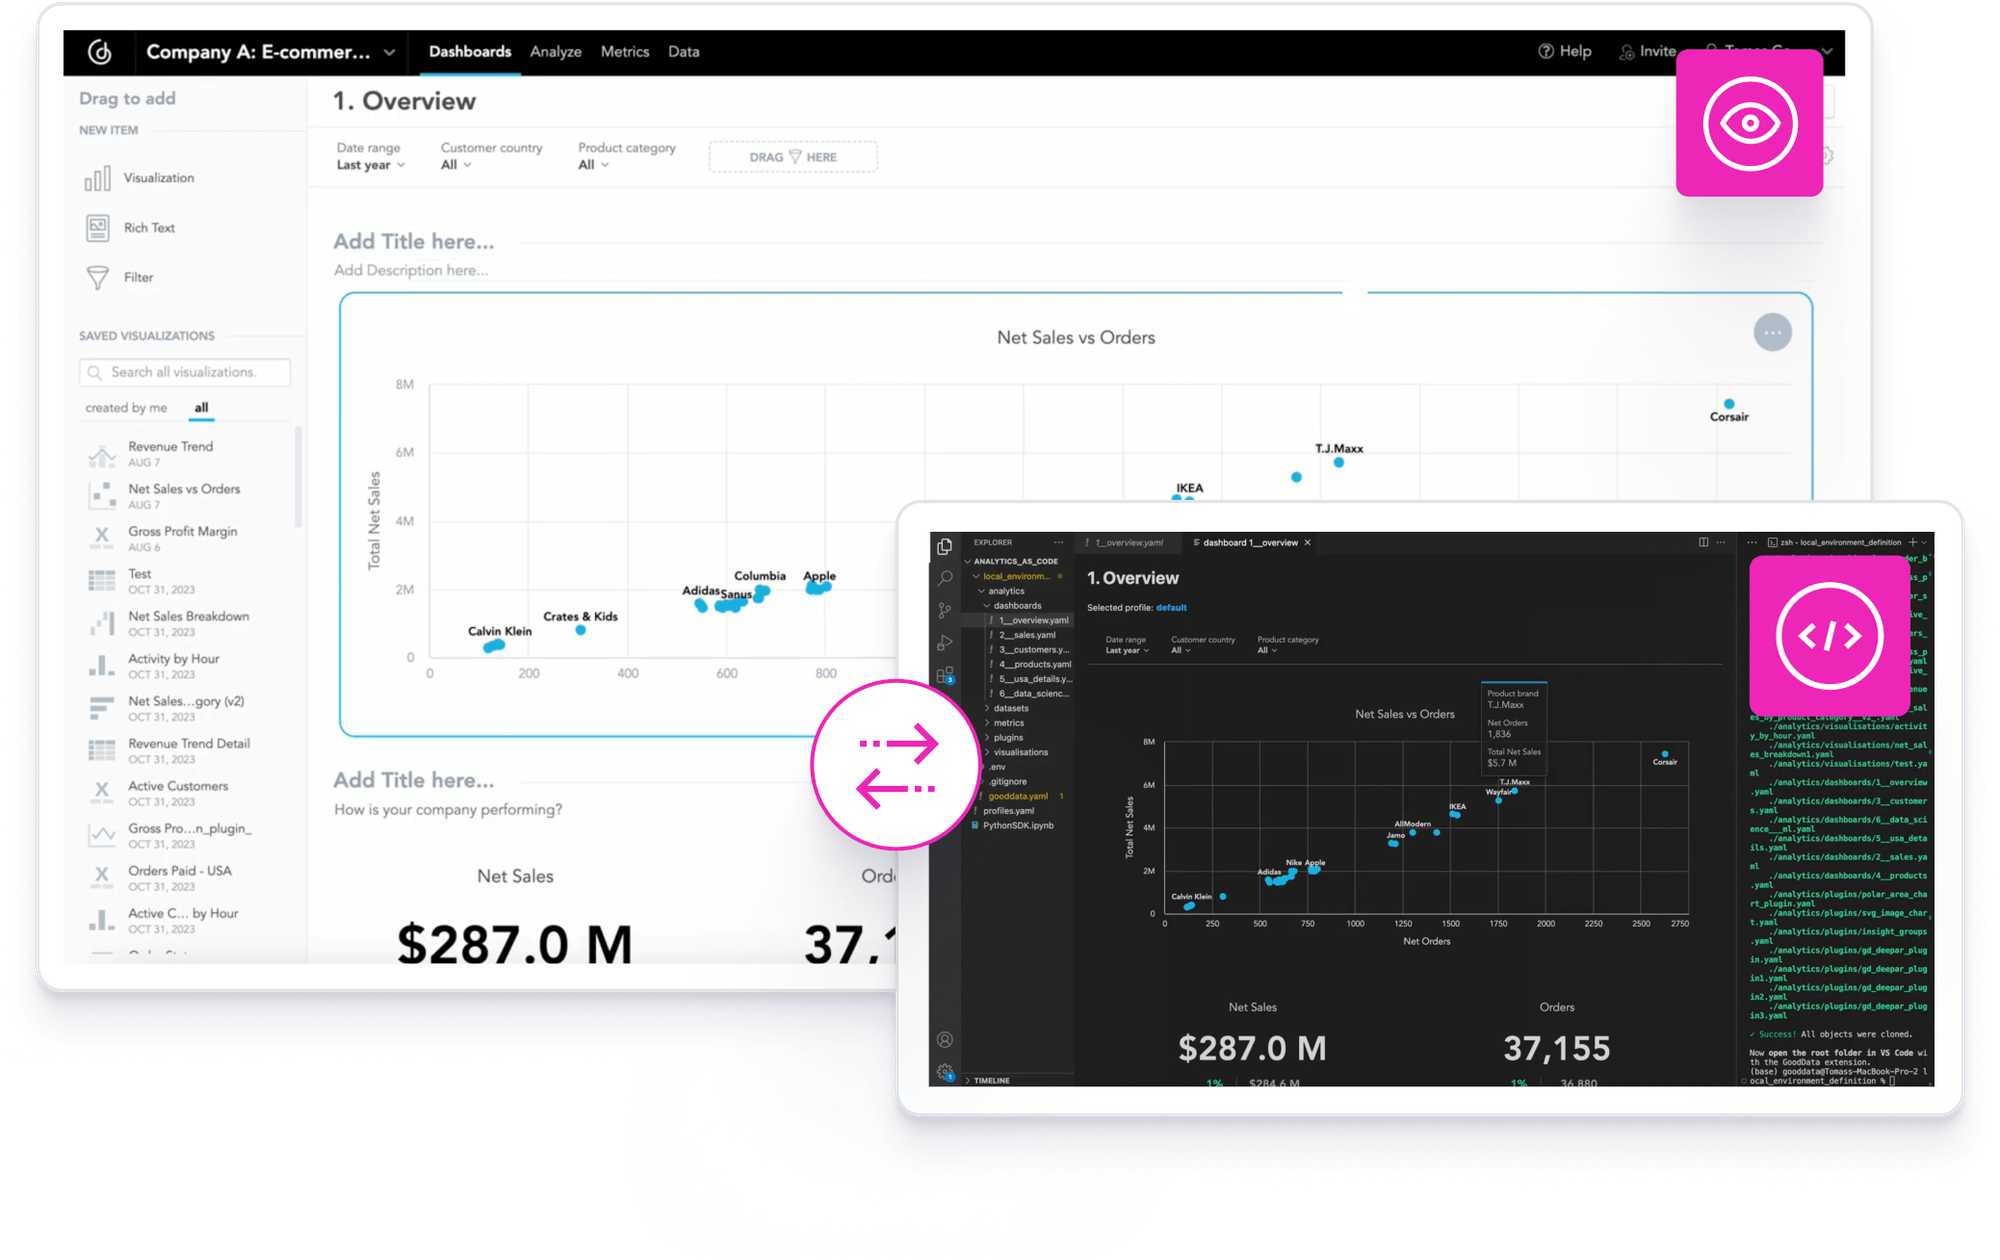
One of the smartest moves you can make is adopting an analytics-as-code approach. This enables you to manage your analytics setup the same way developers manage software. You can version, test, reliably deploy changes, and work faster with automation. It also makes collaboration easier across teams by removing manual steps.
Another thing you can do is balance code-based workflows with low-code or no-code options. This will allow less-code-savvy users, like business analysts or product managers, to contribute without needing to write scripts. Everyone works faster when the tools fit their skill sets.
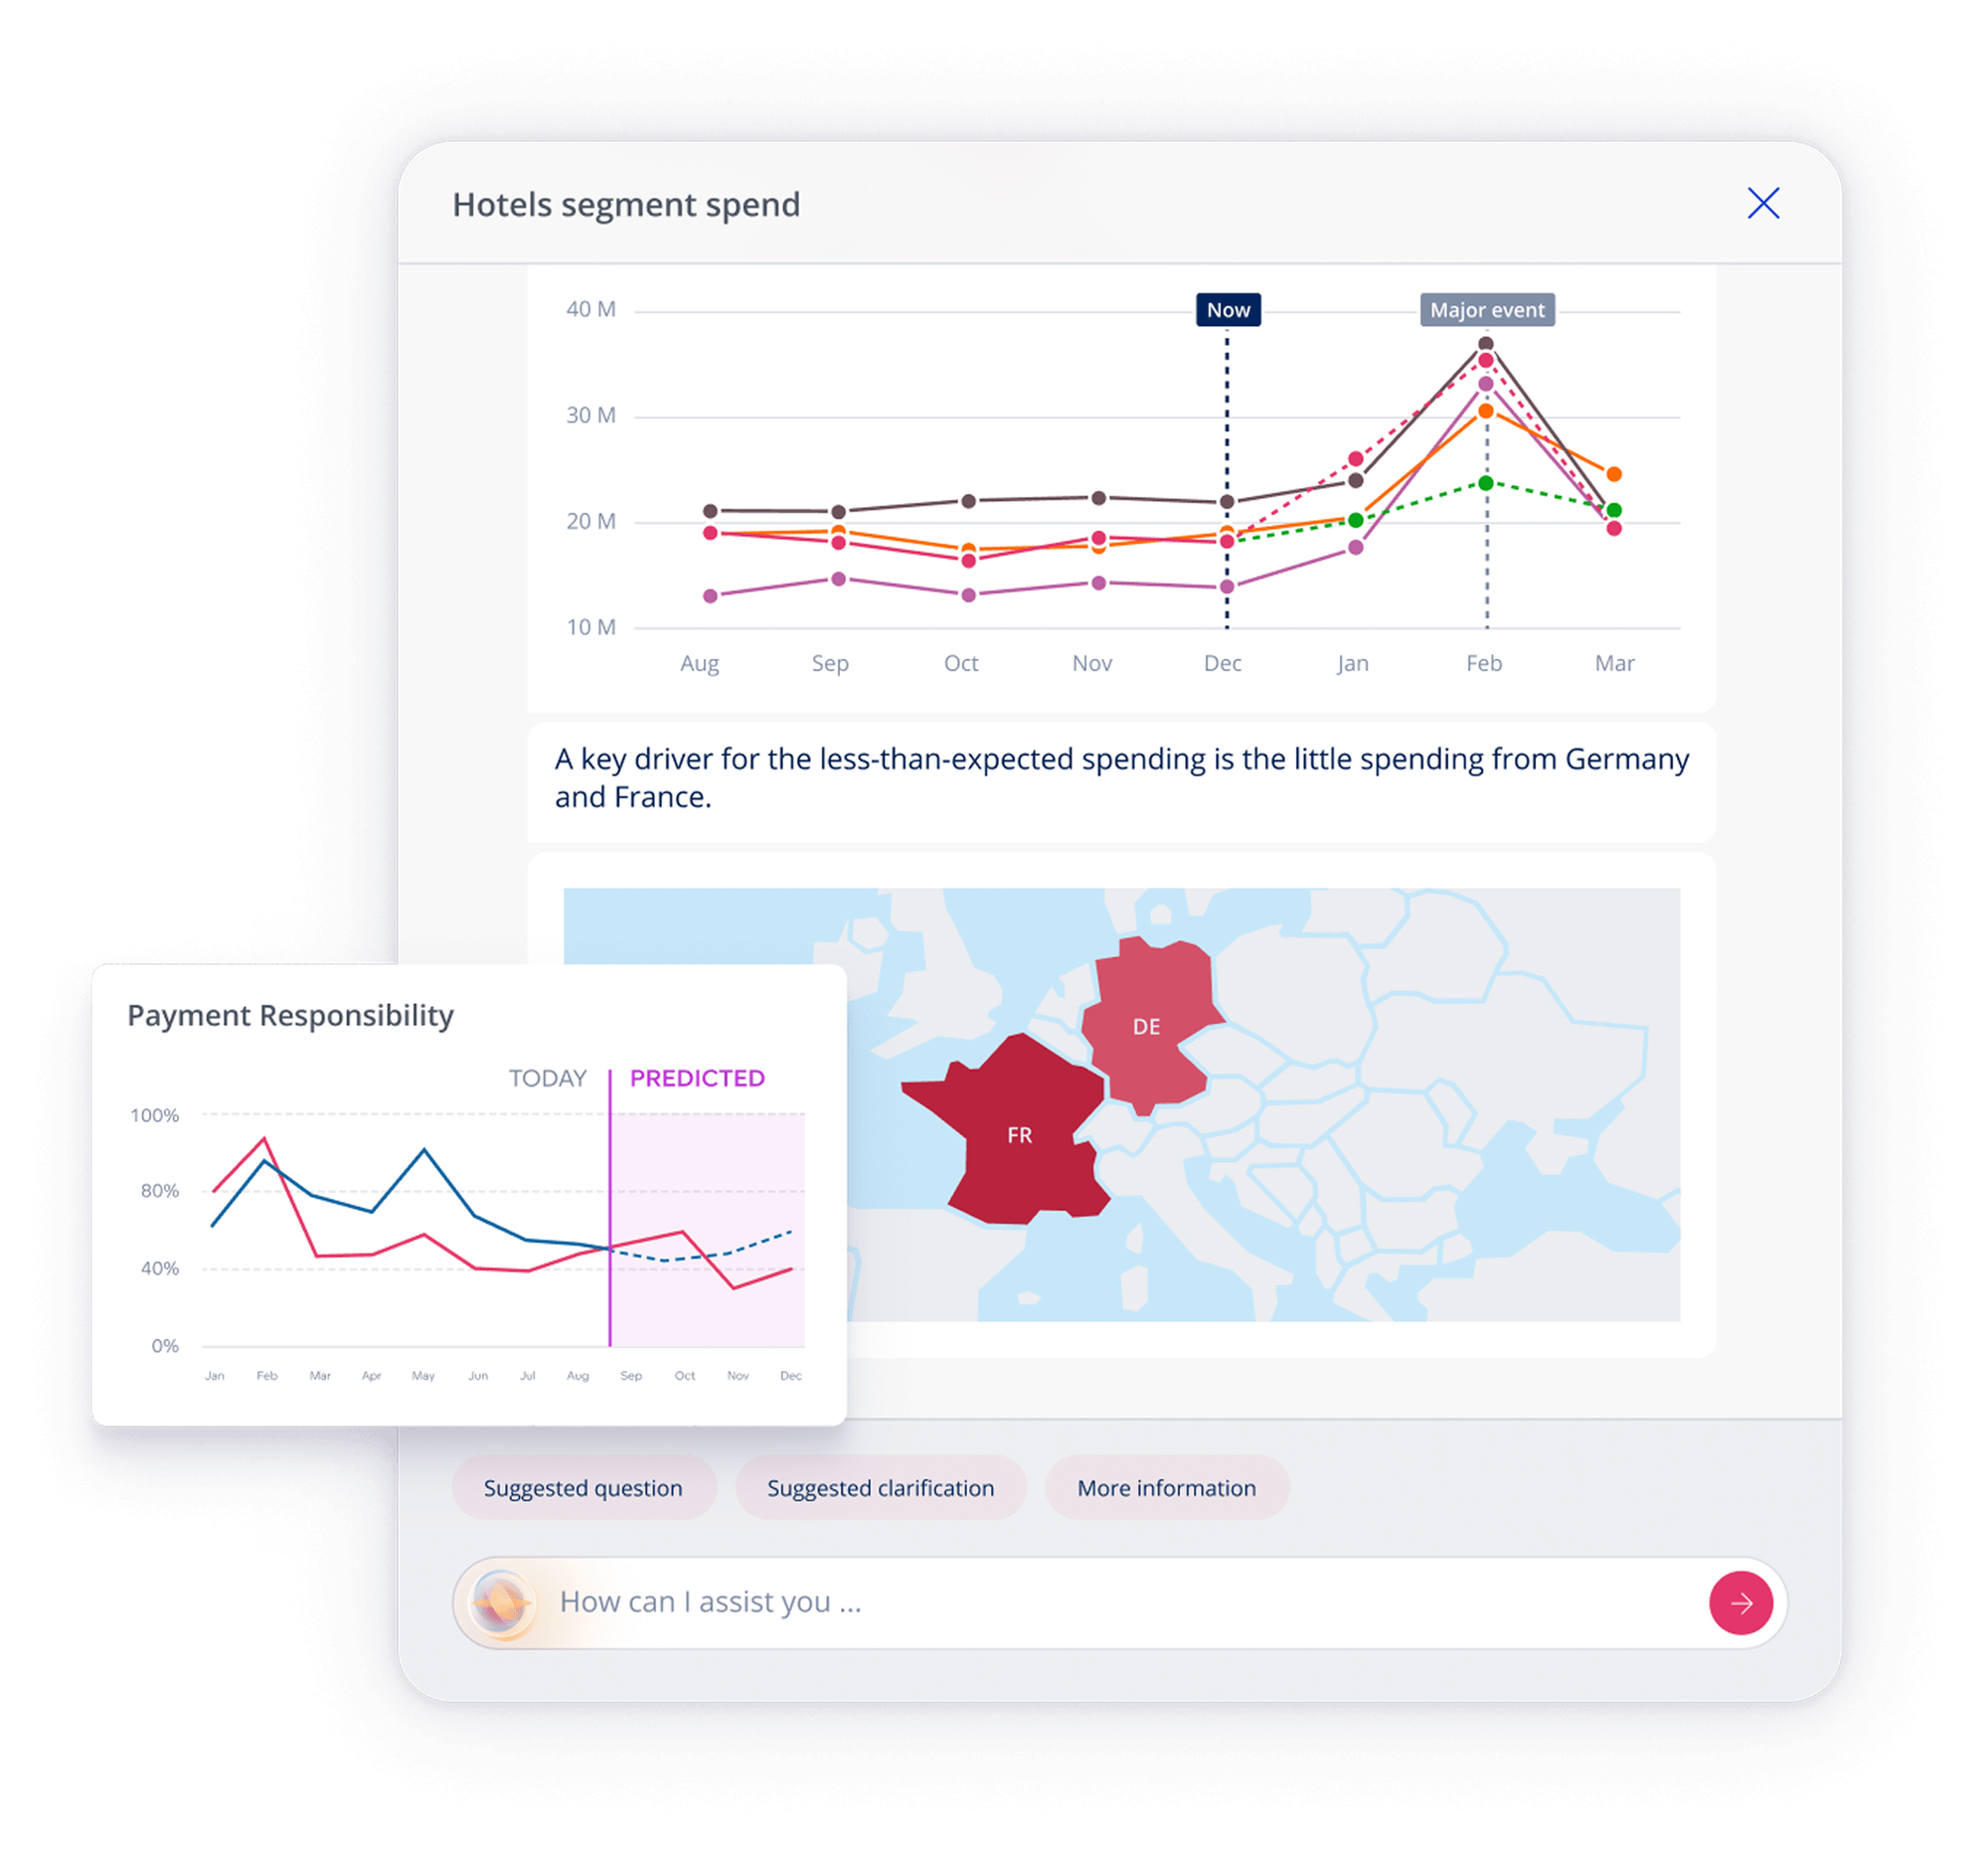
To stay truly ahead, you’ll also need to look at what’s next for user experience. That means AI-driven insights and natural language querying. Users are expecting more intuitive, conversation-like experiences where they can ask a question and get an answer immediately, without needing to slice and filter dashboards manually.
Finally, be selective and ensure you choose the best analytics platform. Open standards, flexible APIs, and a data lake support are key indicators of long-term adaptability. Closed ecosystems may work in the short term, but can slow you down when new tools or data sources emerge.
Your Embedded Analytics Readiness Checklist
Use this checklist to assess whether you're ready to move forward:
- Do you know what content and insights different users should see?
- Have you chosen the right embedding method for your product’s needs?
- Can you support multitenancy, security, and scaling?
- Is your stack ready for performance, governance, and versioning?
- Do you have a clear monetization or value-alignment plan?
- Are you set up for continuous improvement and AI integration?
Get Started with Embedding Today
GoodData powers high-performing embedded analytics with flexible embedding options, robust multitenancy, strong governance, and built-in support for AI assistants and agentic capabilities. Whether you’re embedding dashboards, KPIs, or custom insights, it’s easy to tailor the experience to each user, customer, and use case. See what GoodData’s AI platform can do for you with a personalized demo.
Enjoy this article as well as all of our content.
Trusted by


Does GoodData look like the better fit?
Get a demo now and see for yourself. It’s commitment-free.