How to Automate Data Analytics Using CI/CD
6 min read | Published

In today’s day and age, organizations have enormous amounts of data and they are willing to invest in analyzing it since it can bring them many benefits. It can improve decision-making, increase revenue, improve internal processes, diagnose what does not perform well, or simply have a comprehensive overview of the whole organization. Although organizations want to invest in data analysis, it usually is not a straightforward task.
Various data sources, data quality issues, and inconsistent terminology lead to confusion, redundant efforts, and poor information distribution. Typically, companies need data engineers and data tools (for example dremio, airbyte, dbt, or airflow) to solve these issues, but even then, there is so much data the organizations have to deal with. This is where automation becomes a handy tool for analyzing your data. This article details why and how to automate data engineering tasks, so-called data-ops.
Why Automate Data Analytics?
Data engineers already have many tasks they must complete, therefore any automation of routine tasks would help to ease their workload. We see a similar trend in the world of infrastructure — infrastructure as code. The high-level idea is to automate routine tasks in UI. It means you do not have to click several buttons to start a new instance of your application. The same logic applies to data analytics; whenever you want to deploy a new dashboard or configure a data source, you usually do not want to click several buttons. Ideally, you would like to do it just once and integrate it with your environment. We call this process analytics as a code.
How To Automate Data Analytics?
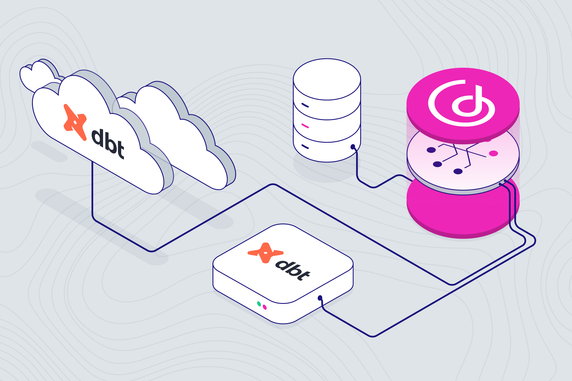
Let’s have a closer look at three tools that automate data analysis: Dagger, GitLab, and GoodData. The combination of these tools allows for comprehensive automatic data analysis, and each of these tools plays an important role in the process.
Dagger
The advantage of this tool is that I can test my pipeline locally and then I can easily push my pipeline to pipeline vendors (for example to GitLab or GitHub), which means Dagger is agnostic to pipeline vendors. Suppose you decide to move from one vendor to another because they provide a better feature set. You do not need to rewrite everything, you just push the pipeline to a different vendor.
GitLab
GitLab is the primary DevOps platform that enables me to run a fast and free pipeline (for demo purposes).
GoodData and GoodData Python SDK
GoodData allows me to create consistent metrics and dashboards and access them using GoodData Python SDK. It fits perfectly with my analytics as code approach. Also, the so-called Logical Data Model (LDM) is a huge benefit of GoodData. With a predefined LDM, you define the mapping and relations only once — you can reuse the same objects many times for various data visualizations without setting it up from scratch every time.
Experience GoodData in Action
Discover how our platform brings data, analytics, and AI together — through interactive product walkthroughs.
Explore product tours5 Key Parts of Data Analytics Automation
The first step is to create a GoodData trial. If you are interested in the details, check the documentation. For the sake of brevity, I will not go into details here, but please let me know if you want to hear more. The goal of this automation is to have an environment where I can create insights, metrics, and dashboards. Why? You usually do not want the customers to see the dashboard before it is ready. Ideally, you create a dashboard, consult your coworkers, and then use CI/CD pipeline to publish the prepared environment in the production. Your customers will see the tuned dashboard and you do not need to copy and paste metrics or insights manually, which is both error-prone and time-consuming. Let’s explore how to achieve this goal!
1. Prepare Staging Environment
First, I need to create an environment where I will organize, analyze, and present data. For this purpose, I will create a workspace in GoodData with an API call because I do not need to create a new workspace every time the pipeline runs.
curl --location --request POST \ 'https://cicd.anywhere.gooddata.com/api/entities/workspaces' \
--header 'Authorization: <Bearer API Token>' \
--header 'Content-Type: application/vnd.gooddata.api+json' \
--data-raw '{
 "data": {
   "attributes": {
     "name": "staging"
   },
   "id": "staging",
   "type": "workspace"
 }
}'
The result of this action is the following created workspace staging:
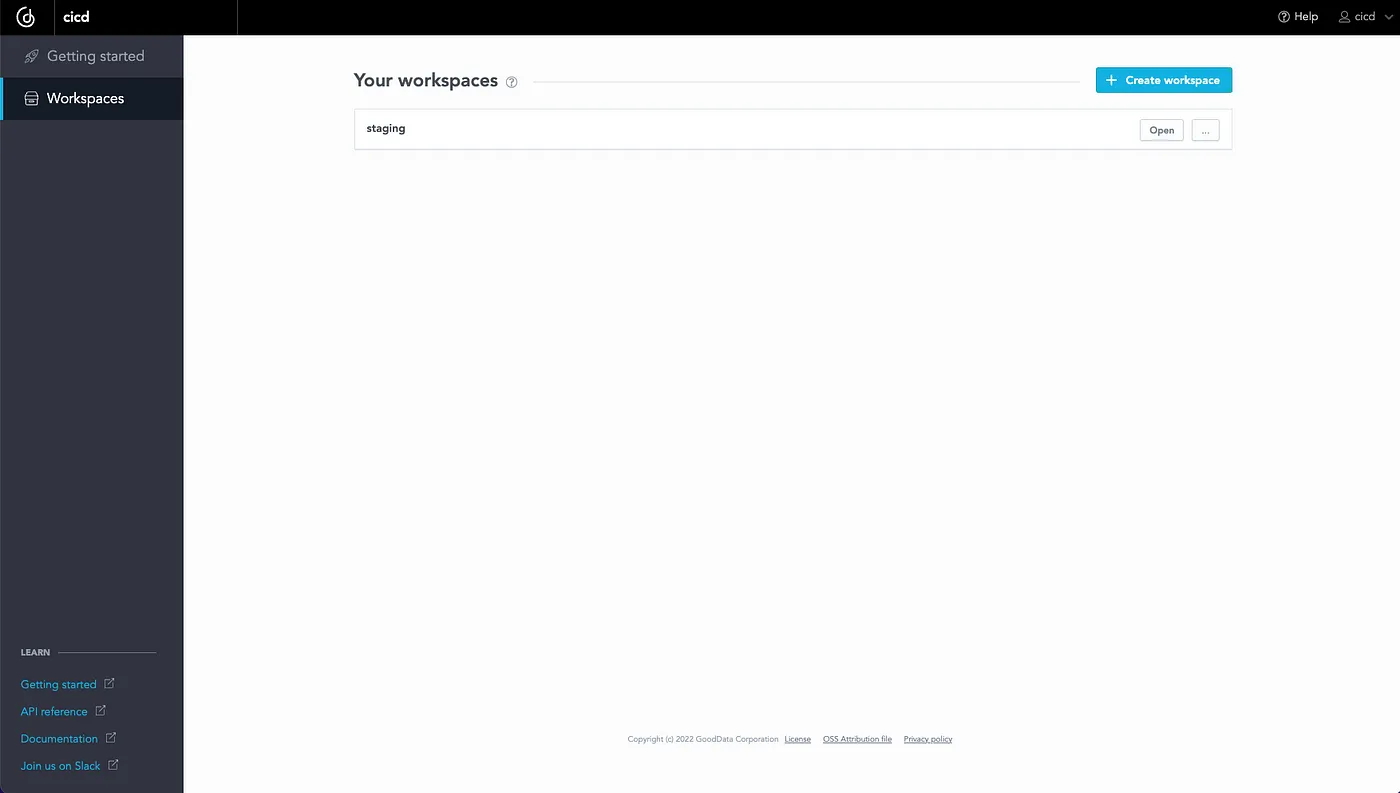
You can also create a workspace using GoodData Python SDK, it is just a few lines of code. It can be used as a part of your pipeline (because create_or_update method is idempotent):
import gooddata_sdk
from gooddata_sdk.catalog.workspace.entity_model.workspace import CatalogWorkspace

host = <GOODDATA_HOST>
token = <GOODDATA_API_TOKEN>
workspace = "new_workspace"

sdk = gooddata_sdk.GoodDataSdk.create(host, token)
sdk.catalog_workspace.create_or_update(CatalogWorkspace(workspace, workspace))
2. Create Staging Analytics
Here, I’m using demo data, which means that the model is relatively simple:
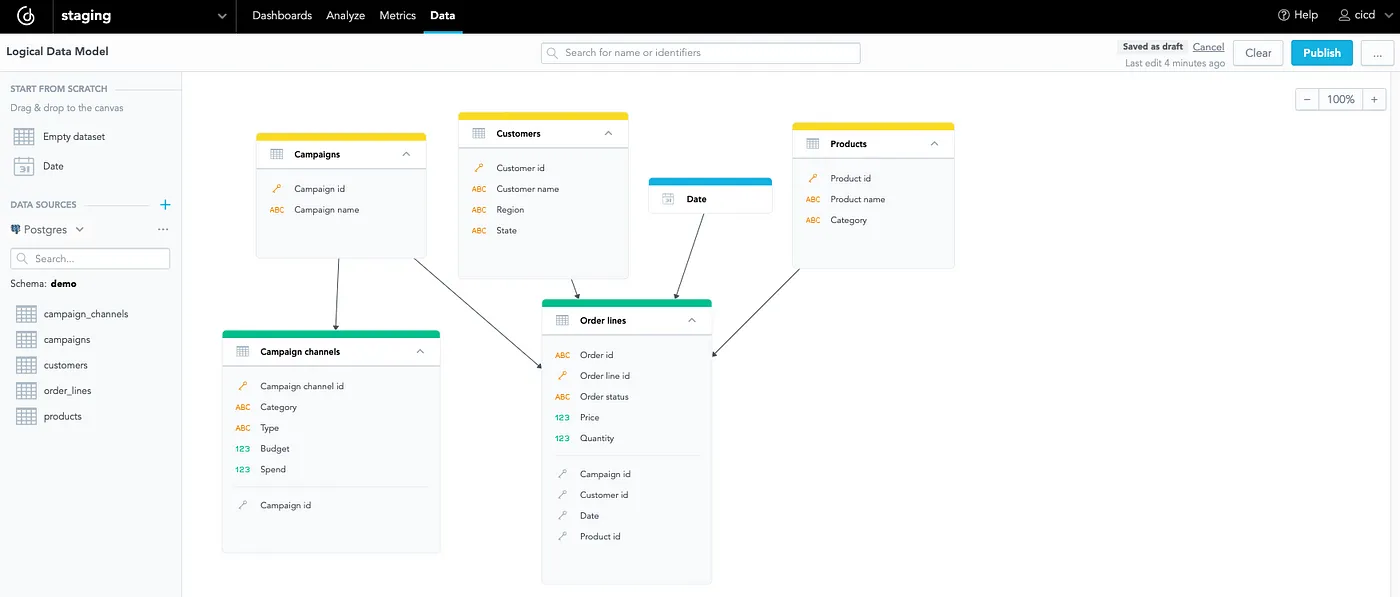
You can see that it consists only of six tables. I can create valuable insights because I have data about orders and customers. First of all, let’s create a dashboard for all those insights — for example, the dashboard will serve as an overview of the last seven days:
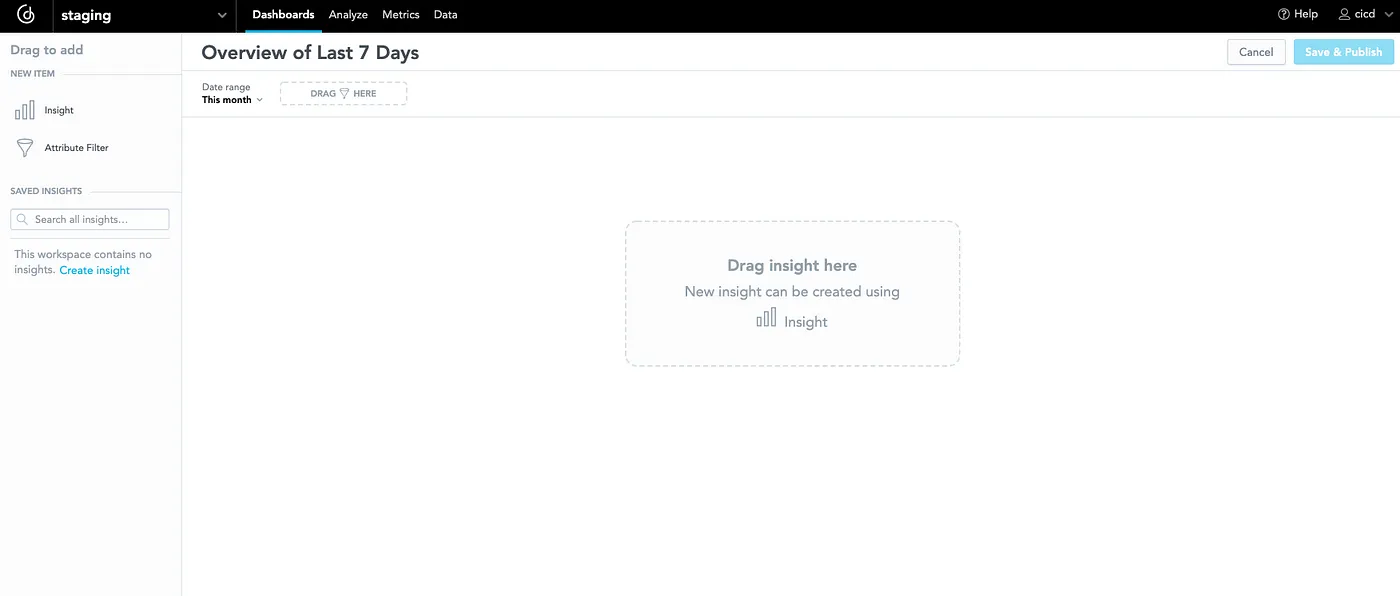
I can immediately put the first insight onto the dashboard — for example, an insight that would show me which state did most orders come from:
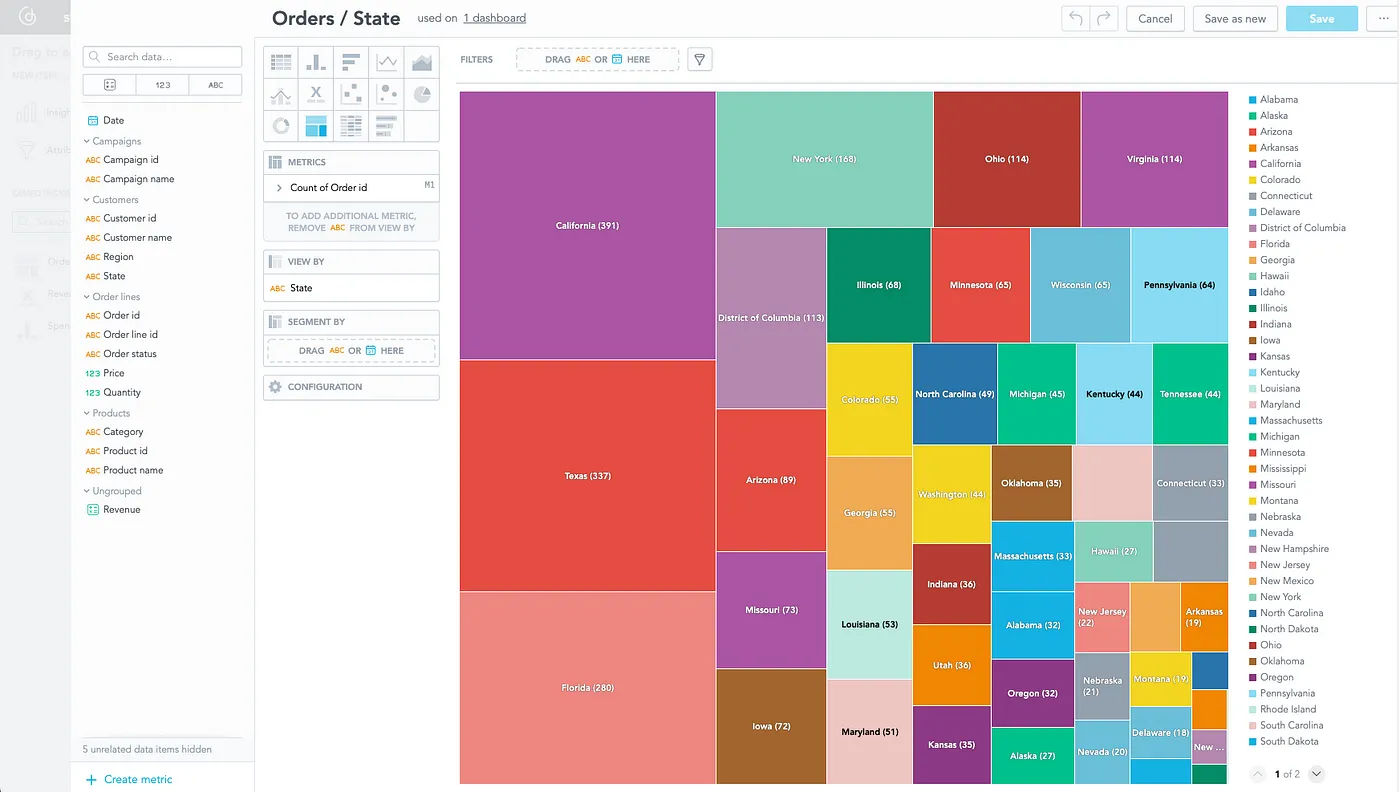
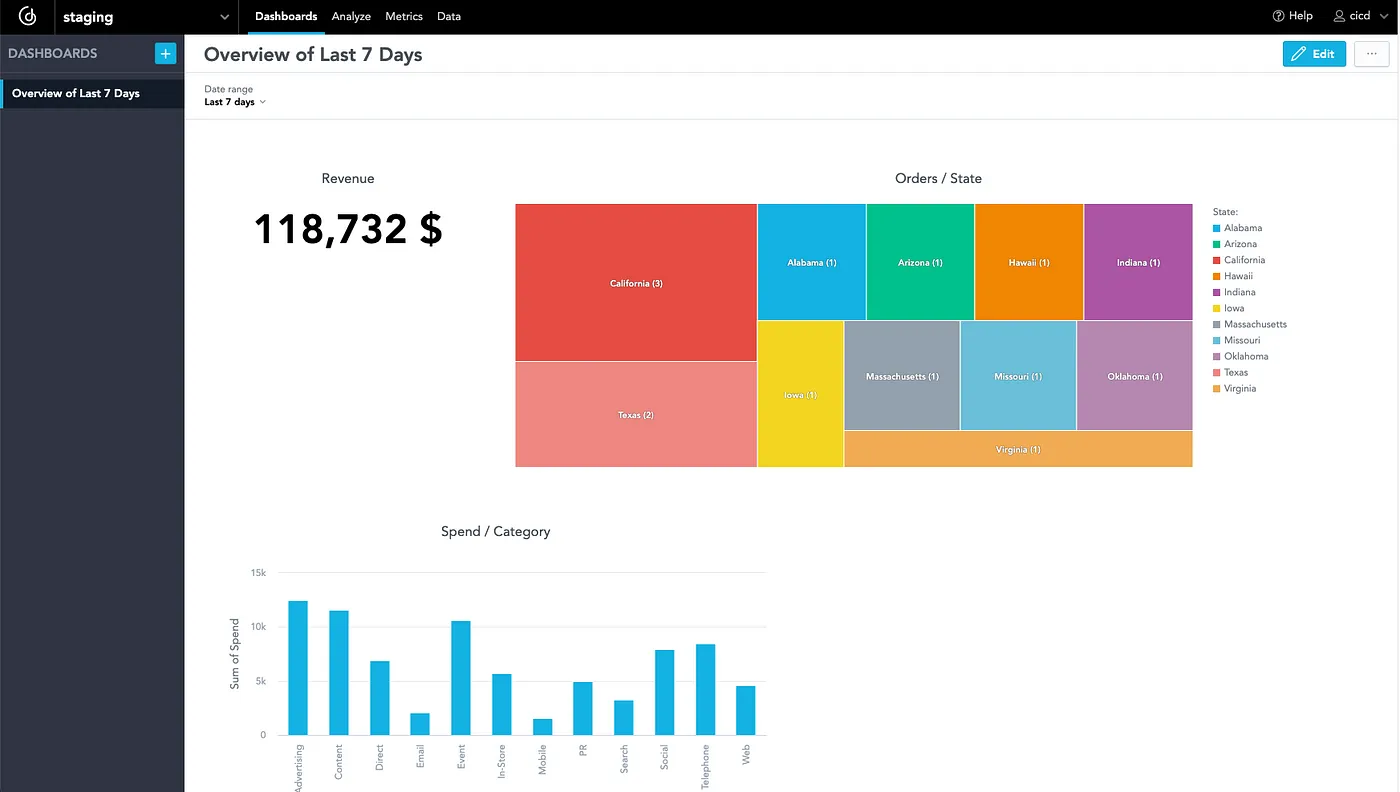
To finish the dashboard, I will add a few more insights and save the dashboard with the “Last 7 Day” filter:

3. Create a Python Script for Pipeline Run
In the previous two steps, I have created a staging workspace and staging analytics. The next step is to create a simple script that will generate the production workspace (or update) and that will put the whole staging analytics there. Declarative API is called behind the scenes; by atomic calls, the production workspace’s content is replaced by the new version every time. This can be easily reverted and older versions can be delivered if needed, thanks to declarative API.
import gooddata_sdk
from gooddata_sdk.catalog.workspace.entity_model.workspace import CatalogWorkspace
import os

host = os.getenv('GOODDATA_HOST')
token = os.getenv('GOODDATA_API_TOKEN')
staging_workspace_id = os.getenv('GOODDATA_STAGING_WORKSPACE_ID')
production_workspace_id = os.getenv('GOODDATA_PRODUCTION_WORKSPACE_ID')

sdk = gooddata_sdk.GoodDataSdk.create(host, token)

sdk.catalog_workspace.create_or_update(CatalogWorkspace(production_workspace_id, production_workspace_id))

declarative_ldm = sdk.catalog_workspace_content.get_declarative_ldm(staging_workspace_id)
declarative_analytics_model = sdk.catalog_workspace_content.get_declarative_analytics_model(staging_workspace_id)

sdk.catalog_workspace_content.put_declarative_ldm(production_workspace_id, declarative_ldm)
sdk.catalog_workspace_content.put_declarative_analytics_model(production_workspace_id, declarative_analytics_model)

print("done")
You can see that I use the GoodData Python SDK to interact easily with GoodData using code. In a nutshell, the script does two things: it creates the new workspace production (if it does not exist), and it takes analytics from the staging workspace and puts it into the production workspace.
4. Setup Pipeline With the Help of Dagger
I use Dagger to orchestrate the CI/CD pipeline. The pipeline generates the Dockerfile, builds an image, and runs a container according to the code below. It also defines which environment variables it needs. Dagger is excellent because I can debug it locally and push it to GitLab or GitHub (I did not need to push every code change to see the result of the pipeline).
package pipeline

import (
    "dagger.io/dagger"
    "universe.dagger.io/docker"
)

#StagingToProductionDeploy: docker.#Dockerfile & {
    dockerfile: contents: """
        FROM python:3.9
        COPY . /src
        RUN pip install -r /src/requirements.txt
        CMD python /src/staging_to_production_deploy.py
        """
}

dagger.#Plan & {
	client: {
		filesystem: "./src": read: contents: dagger.#FS
		env: {
			GOODDATA_HOST: string
			GOODDATA_API_TOKEN: string
			GOODDATA_STAGING_WORKSPACE_ID: string
			GOODDATA_PRODUCTION_WORKSPACE_ID: string
		}
	}

	actions: {
		build: #StagingToProductionDeploy & {
			source: client.filesystem."./src".read.contents
		}

		run: docker.#Run & {
			always: true
			input: build.output
			env: {
				GOODDATA_HOST: client.env.GOODDATA_HOST
    		GOODDATA_API_TOKEN: client.env.GOODDATA_API_TOKEN
    		GOODDATA_STAGING_WORKSPACE_ID: client.env.GOODDATA_STAGING_WORKSPACE_ID
    		GOODDATA_PRODUCTION_WORKSPACE_ID: client.env.GOODDATA_PRODUCTION_WORKSPACE_ID
			}
		}
	}
}
5. Push Everything to GitLab
The final step is to push everything to GitLab and create a .gitlab-ci.yaml file to run the pipeline. I used the file in the Dagger documentation; basically, it will simply let you copy and paste the file and immediately run the pipeline. You can find the file in the GitLab repository, as well as the other files from the previous steps.
Automated Data Analytics Demo
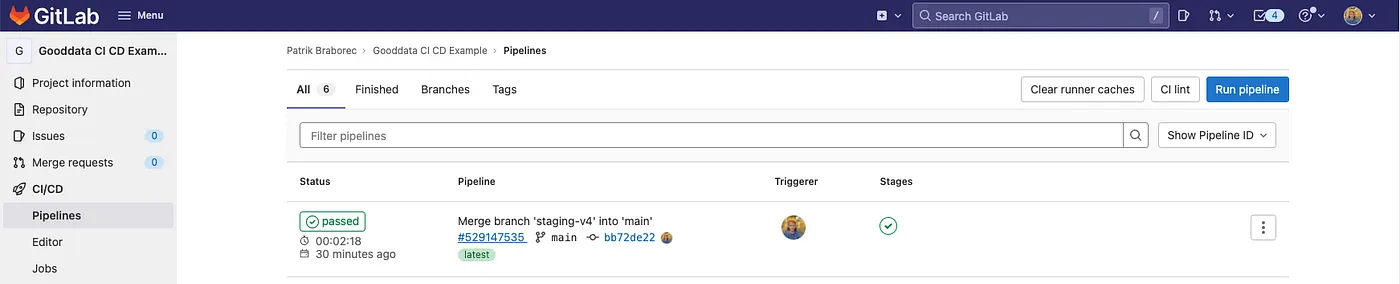
Now it seems that everything is ready. Let’s run the pipeline! In GitLab, you can run the pipeline from the CI/CD section. The created pipeline runs for ~2 minutes (during the first run), and in that time, it will deploy the staging workspace to the production workspace.
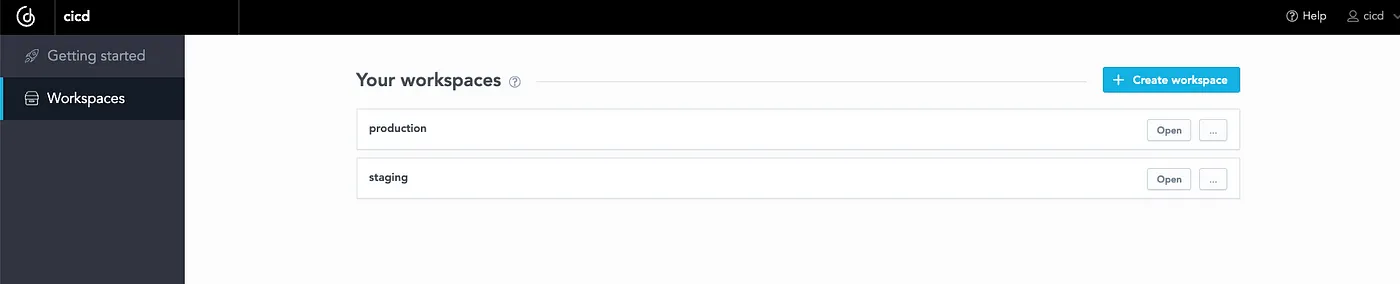
The result is the following (you can see the new workspace production in GoodData):
When I open the workspace, it contains the same dashboards with insights as the staging workspace:
Imagine I make some changes in the staging workspace. For example — I will add a new dashboard with new insights. Delivering new analytics to production will be a matter of just one click in GitLab and it will speed up the delivery of analytics to customers or stakeholders!
Summary
Thank you for reading the article! In this article, I described why the automation of analytics is important and showed you an example of such automation in action. The problem with conflicts in UI is not mentioned in this brief article. Imagine that someone makes changes in the production workspace, and subsequently, you run the pipeline. In that case, all changes made in the UI are gone in the production workspace and they are replaced with the staging workspace. In this case, the pipeline does not test if all insights are executable. What if one of the insights does not work? It will go unnoticed and you will deliver the changes to the production workspace. Thanks to GoodData Python SDK, you can solve all of these issues! If you are interested in how to solve these problems, please follow me, I will cover these scenarios in the following articles. I also encourage you to read other articles about analytics, such as How To Automate Your Statistical Data Analysis or Build a Tool for Data Analysis.
Experience GoodData in Action
Discover how our platform brings data, analytics, and AI together — through interactive product walkthroughs.
Explore product tours