Solutions
Data intelligence platform for financial services
From fraud detection to portfolio management — design and build intelligent applications and AI agents for any financial use case.


Analytics, automation, and agentic AI — all built on one platform designed for financial services and fintech.
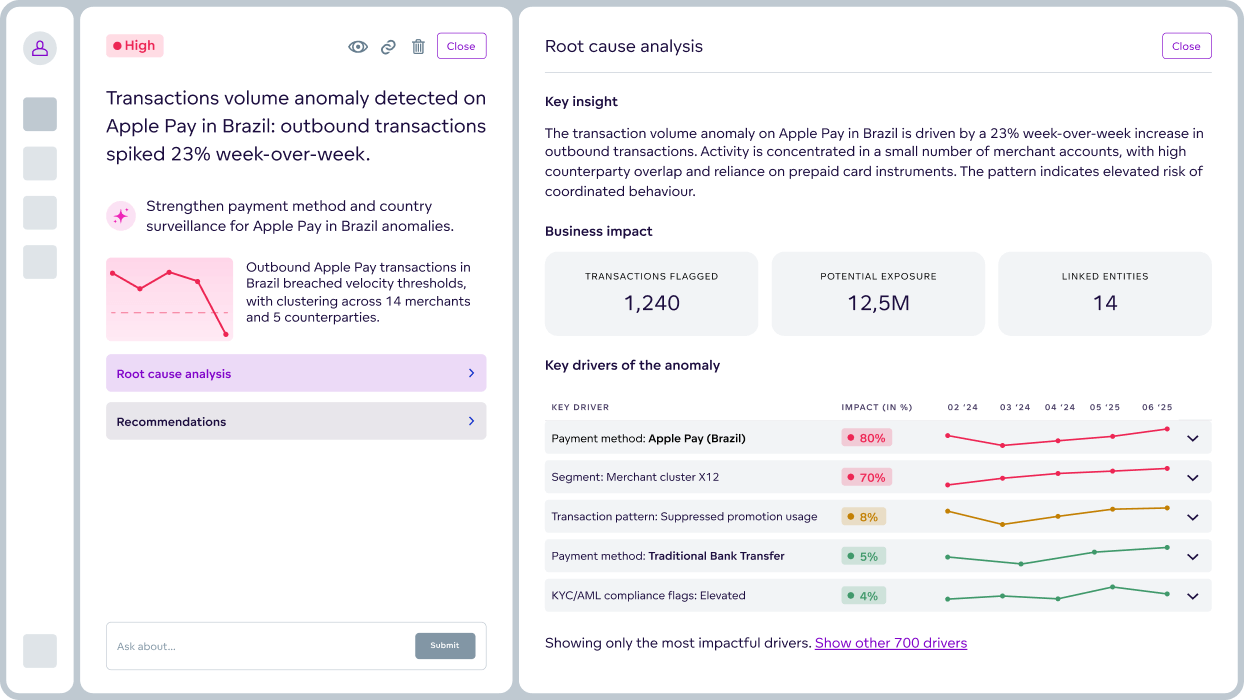
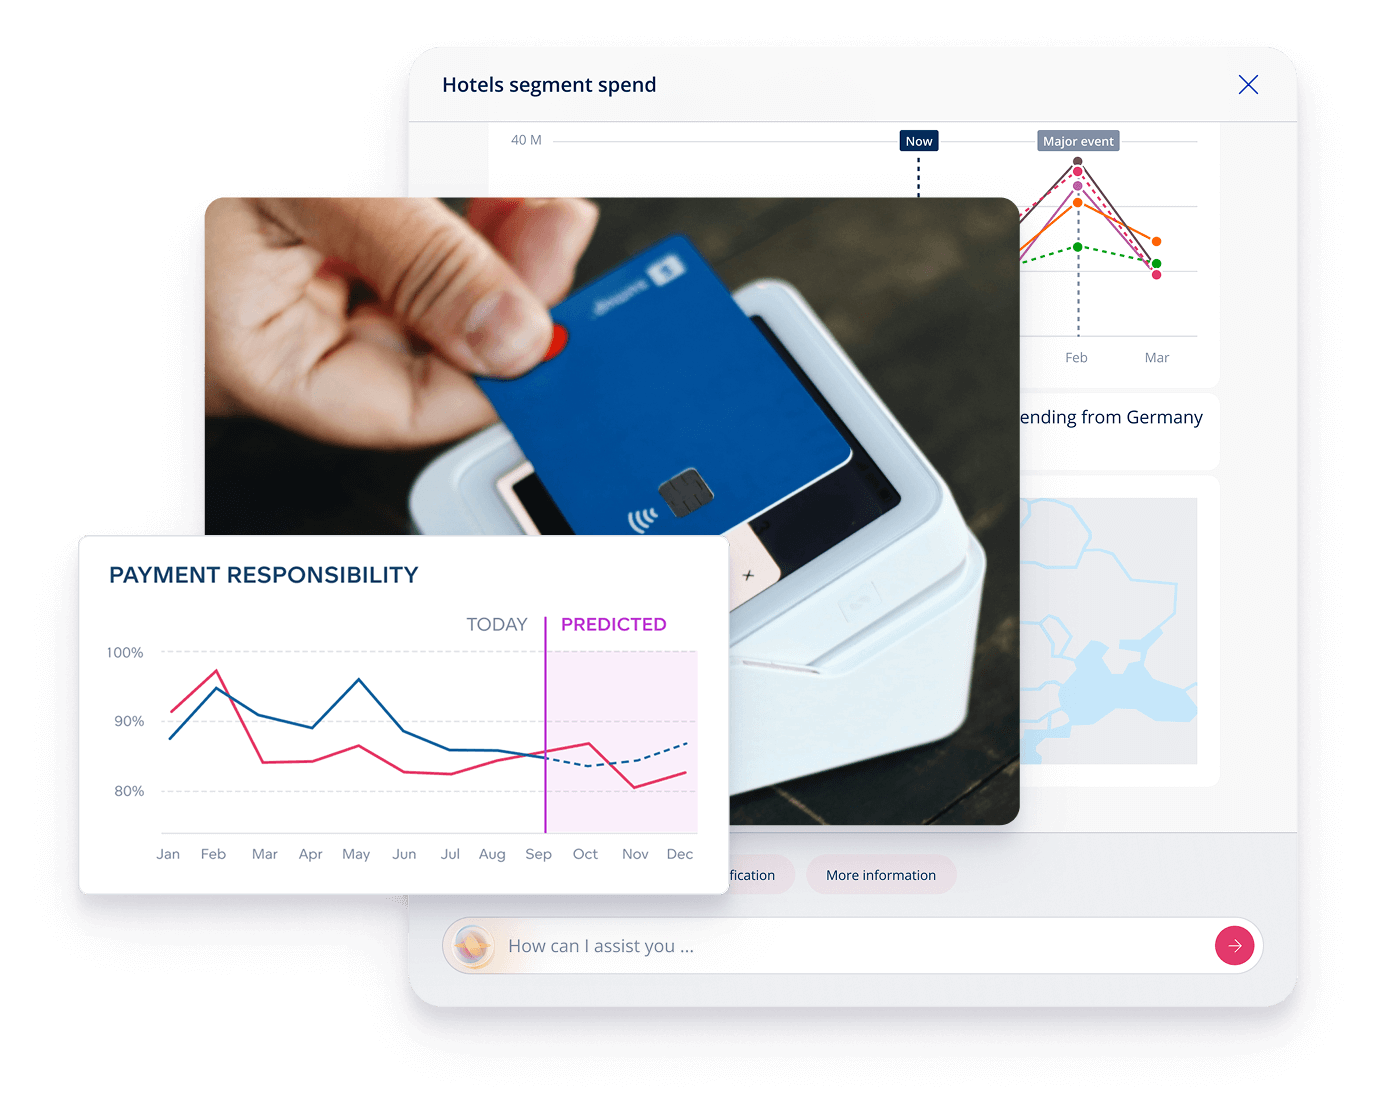
Detect fraud, ensure compliance
- Discover new fraud patterns and auto-update detection rules.
- Investigate anomalies and create compliance-ready summaries.
- Detect AML patterns with full audit trails and faster reporting.

Automate risk management and credit decisions
- Approve loans faster with real-time AI-driven credit scoring.
- Use explainable AI to automate underwriting decisions.
- Recalibrate merchant risk tiers and flag high-risk accounts.

Optimize portfolios and capital markets
- Rebalance portfolios automatically to reduce risk and boost returns.
- Adjust fund allocation dynamically with live cash insights.
- Run AI stress tests to simulate and plan for market shifts.
Enhance financial reporting, predict trends
- Forecast market changes and adjust strategies proactively.
- Spot data errors early to ensure accurate financial reporting.
- Automate reconciliation and bookkeeping for faster closes.

Mike Terry
Business Analyst, Say Insurance

Christopher Marin
Dir. of Digital Marketing Ecosystem and Analytics at DXC Technology
206%
Increase in MQLs
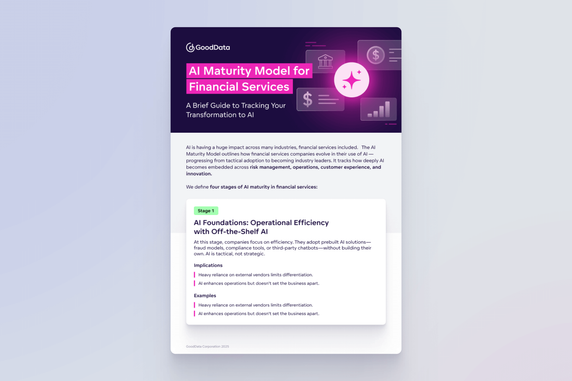
Explore strategic guides to AI transformation in finance
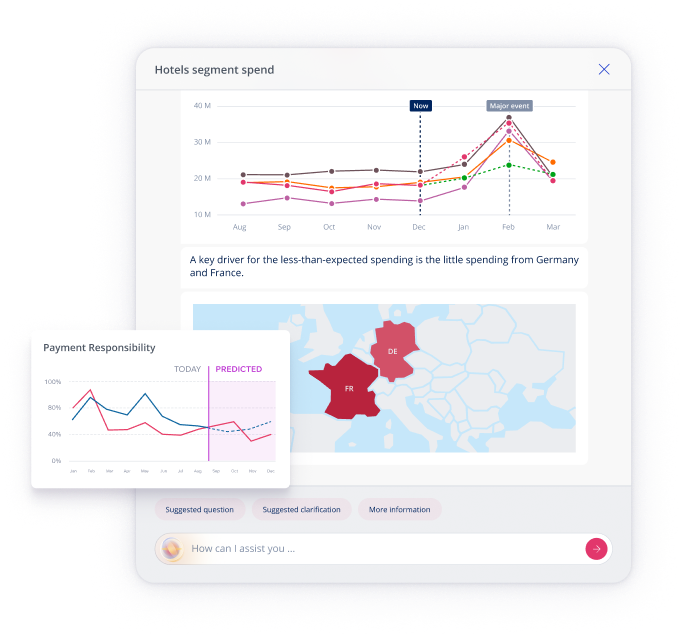
Powering a global identity and fraud platform with data-driven insights
Learn how a leading financial enterprise rolled out a new identity and fraud-prevention platform.
Leveraging GoodData analytics
With GoodData as the analytics layer for its new identity-check platform, a leading financial enterprise delivered intuitive self-service dashboards, unified metrics, benchmarks, and comparisons; all embedded directly in the platform.
2000+
Client Organizations
40%
Higher activation rates
27x
More active users
12x
More active client organizations

Discuss your use case with us
See how GoodData can help with your goals
Why GoodData powers the future of financial intelligence
Integrate with your ecosystem
Connect GoodData to these data sources
or build your custom data connection using FlexConnect


Bring your own LLM
Choose the LLM or orchestration layer that fits your stack.


Deploy in GoodData Cloud
GoodData Cloud is a SaaS product operated and maintained by us. Customers receive continuous code updates and it can be deployed in AWS, Azure, and multi-region.


Deploy Self-hosted
Self-hosted uses the same codebase as GoodData Cloud and is ideal for users needing enhanced security, governance, or control for data residency or regulatory compliance.


Security and trust
Trusted analytics — certifications, inherited permissions, and cascading content changes for easy admin.


Integration
Open APIs and declarative SDKs — connect to code repositories and 3rd-party apps, embed anywhere.


Accessibility
Accessible analytics — ensuring compliance and delivering inclusive experiences.


A trusted platform, loved by users


Common financial services analytics questions
Agentic AI refers to autonomous AI systems (or agents) that don’t just analyze data — they act on insights.
In banking and finance, these agents can detect fraud, assess credit risk, generate compliance reports, or rebalance portfolios automatically. Unlike traditional AI models that only predict outcomes, agentic AI reasons, decides, and executes tasks, helping financial institutions move from insight to action in real time.
Agentic AI is redefining how financial organizations operate by combining analytics, automation, and decision-making in one loop.
It helps banks and fintechs:
- Detect and prevent fraud before it happens.
- Accelerate credit and underwriting decisions.
- Streamline KYC, AML, and regulatory reporting.
- Deliver personalized customer experiences and recommendations.
- Improve forecasting, portfolio management, and operational efficiency.
With agentic AI, financial institutions move from reactive monitoring to proactive, self-optimizing systems that adapt continuously.
A data intelligence platform provides the foundation for agentic AI — it connects data from across your organization, transforms it into reliable insights, and enables AI agents to act confidently on that data.
With GoodData’s AI-native platform, you can:
- Build, train, and deploy AI agents on trusted, governed data.
- Ensure every decision is traceable, auditable, and compliant.
- Integrate seamlessly with your existing systems and data sources.
In short, a Data Intelligence Platform ensures your agents have the context, security, and scalability they need to make smarter, faster decisions.
Data visualization plays a pivotal role in financial analytics, transforming intricate datasets into accessible and comprehensible insights.
Visualization techniques such as charts, graphs, and dashboards provide a visual clarity that enhances overall comprehension. These visual representations facilitate the identification of trends, patterns, and relationships within the data, offering a quick and intuitive understanding that may be challenging to achieve through raw numerical analysis.
One of the significant contributions of data visualization in financial analytics is its role in effective communication. They bridge the gap between data analysts, decision-makers, and stakeholders, ensuring that everyone involved can understand and act upon the insights derived from the data. Whether presenting market trends, risk assessments, or portfolio analyses, visualizations make it easier for diverse audiences to grasp complex financial concepts, fostering a collaborative and informed decision-making environment.
Finally, data visualizations play a crucial part in real-time monitoring and decision support. Dashboards with real-time visualizations enable financial professionals to monitor key performance indicators (KPIs), market fluctuations, and other relevant metrics promptly. This real-time monitoring is crucial for making timely decisions and responding to changes in the financial landscape.
Financial services analytics software offers a suite of functionalities to handle and interpret vast amounts of financial data. One key aspect is its role in data integration and management, aggregating information from diverse sources like transactions, market data, and customer records. This provides a comprehensive view of the financial landscape and ensures data quality through processes like cleansing, enabling reliable insights.
The software excels in descriptive analytics, providing a historical perspective by identifying patterns and anomalies in financial data. Through intuitive dashboards and reports, it enables users to visualize key performance indicators and metrics, aiding in decision-making.
Financial services analytics software also incorporates predictive analytics, employing statistical models and machine learning algorithms to forecast future trends, assess credit risk, and make informed predictions. Additionally, it delves into prescriptive analytics, offering recommendations for optimizing processes, reducing costs, and improving overall operational efficiency.
Financial services analytics involves the use of data analytics and advanced techniques to examine and interpret financial data. This field leverages data-driven insights to enhance decision-making, mitigate risks, and improve overall business performance for financial institutions.
In the world of financial services analytics, professionals analyze large volumes of data to gain valuable insights into customer behavior, market trends, and operational efficiency. They utilize various tools and methodologies to extract meaningful information, ranging from traditional statistical methods to advanced machine learning algorithms.
Key areas of focus in financial services analytics include: customer analytics, risk analytics, fraud detection, operational analytics, market analytics, and regulatory compliance.
Financial services analytics and fintech are closely related but distinct concepts. Financial services analytics refers to the use of data analysis and statistical techniques to extract insights, assess risks, and make informed decisions within the financial sector. This can include analyzing market trends, customer behavior, and optimizing business operations using data-driven approaches.
On the other hand, fintech, short for financial technology, is a broader term encompassing innovations and technologies that aim to enhance and automate the delivery of financial services. Fintech involves leveraging technology to improve traditional financial services, create new financial products, and streamline processes. While financial services analytics is a component of fintech, the latter includes a more extensive range of technological advancements such as mobile banking, blockchain, and digital payments.


