eBooks
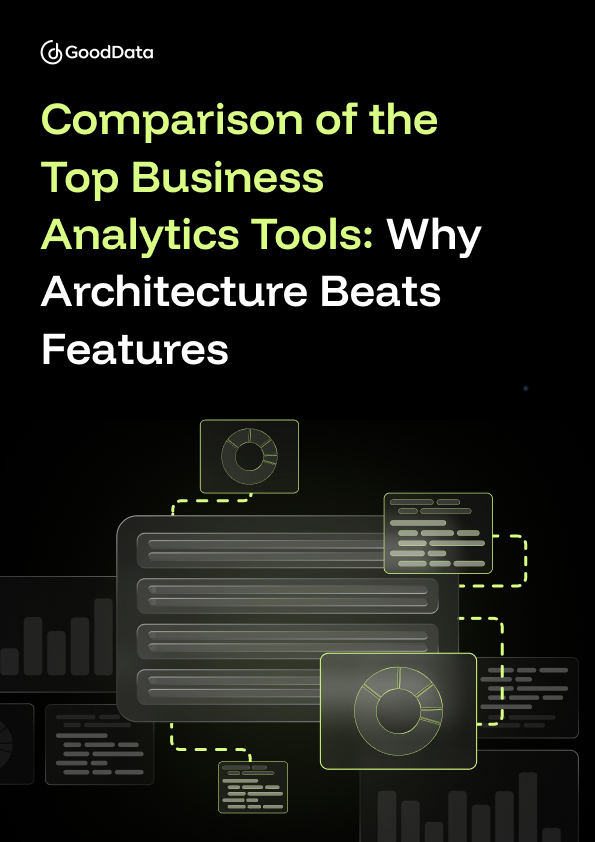
Comparison of the Top Business Analytics Tools: Why Architecture Beats Features
25 min read | Published

About
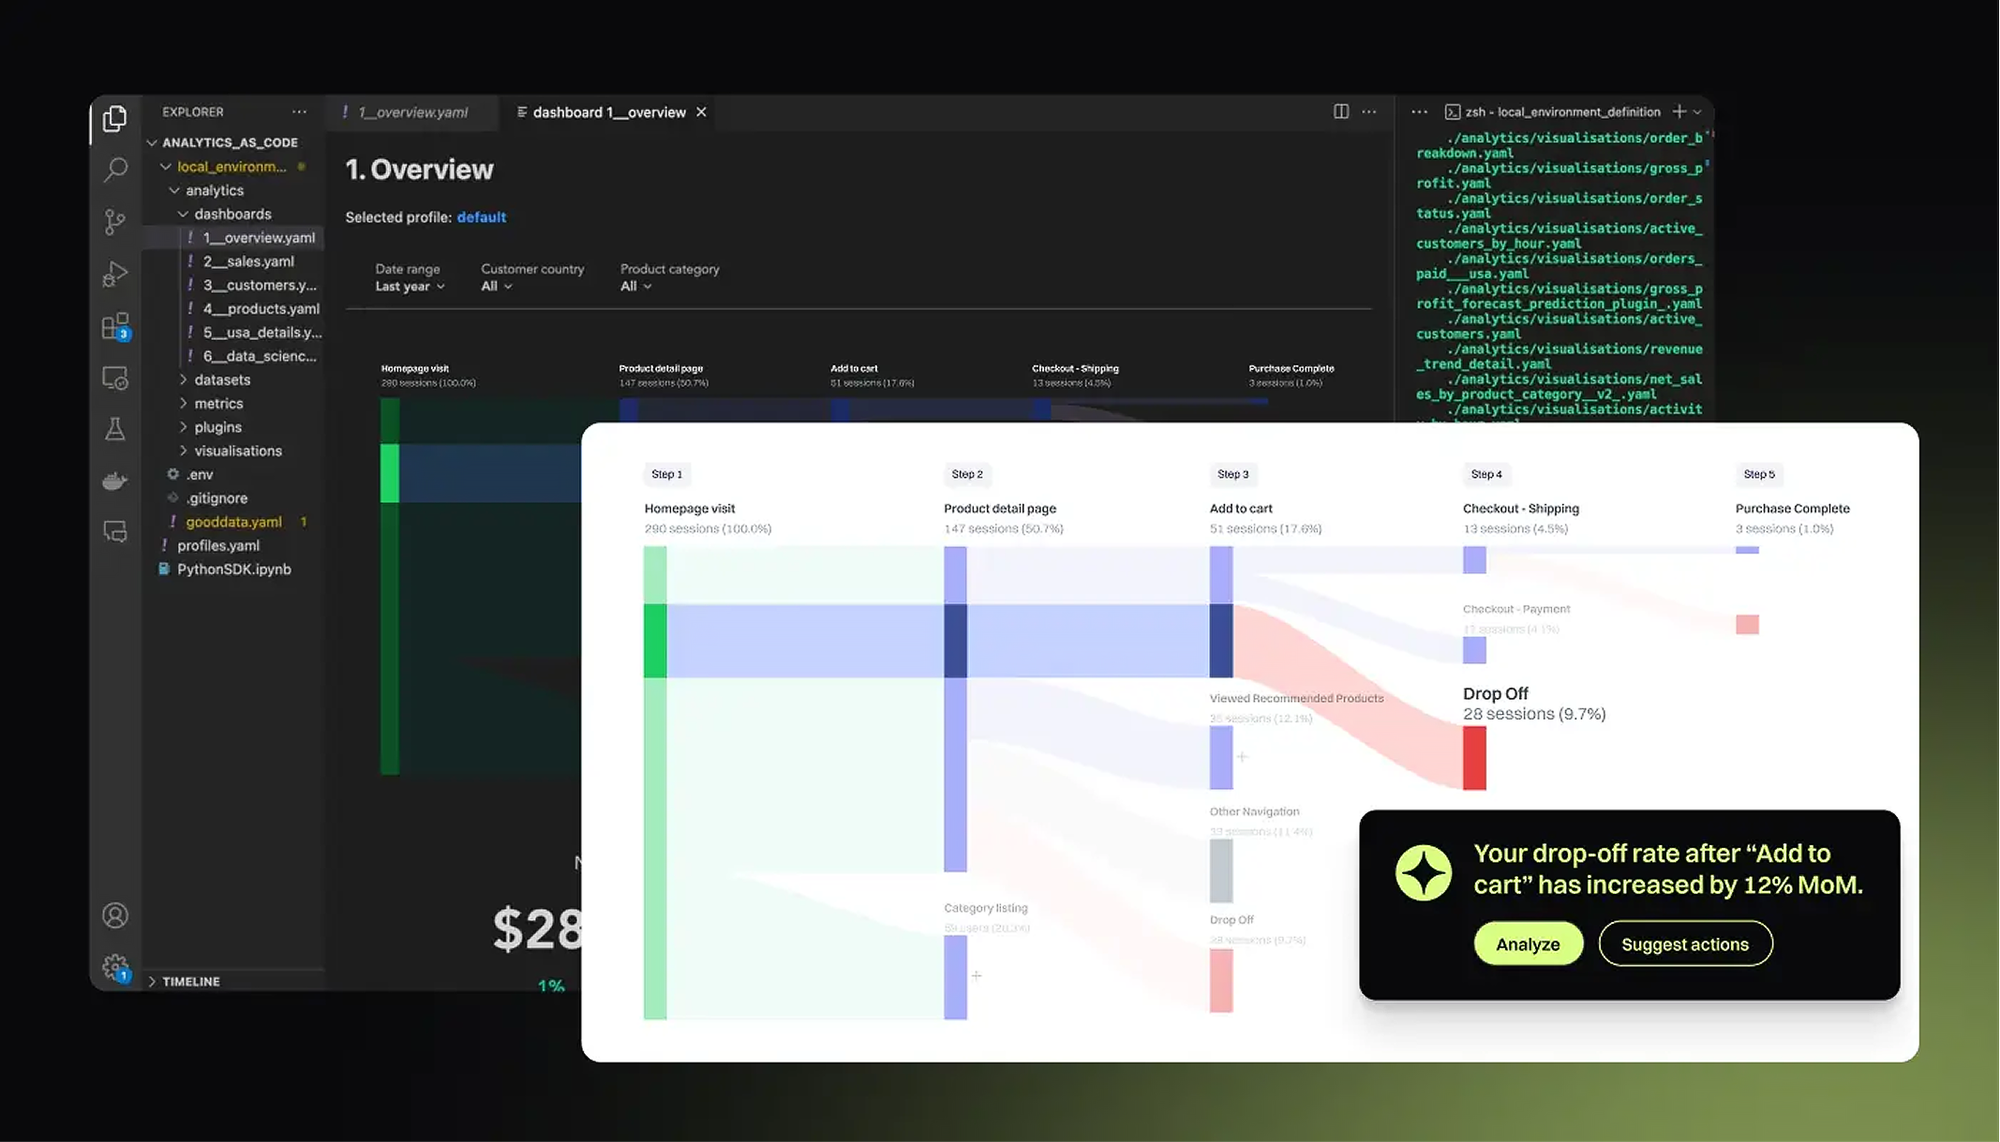
Choosing the right business analytics tools comes down to architecture, not features. Most platforms excel at dashboards and visualization, but fail when organizations need governed metrics, embedded analytics, or AI-powered insights at scale.
This guide evaluates 11 leading business analytics platforms (GoodData, Tableau, Microsoft Power BI, Looker, Qlik, SAP Analytics Cloud, Amazon QuickSight, SAS Visual Analytics, Domo, Sisense, and Sigma) against the criteria that actually determine long-term success.
Each platform is reviewed against the same framework, with a clear statement of what it does best and where it falls short.
Click here to go directly to the comparison table.
Key Takeaways
- Legacy analytics platforms are breaking under modern demands because they were built for centralized reporting, not embedded, AI-powered, or multi-tenant analytics at scale.
- The most common analytics failures stem from: absence of a governed semantic layer, monolithic architecture that was never designed for embedding, tools that expose data complexity instead of abstracting it for business users, and AI implementations that lack the business context needed to produce reliable results.
- When choosing a platform, these capabilities matter most: governed semantic layer, embedded-first architecture, reliable AI, cloud-native scalability, developer experience, no-code user experience, integration extensibility, and real-time and predictive capabilities.
- Most platforms excel in one or two areas but fall short across the full set of requirements. Matching the platform to your specific use case is more important than chasing the longest feature list.
Business Intelligence vs. Business Analytics: Which Does Your Business Need?
The critical distinction between business intelligence and business analytics is one of scope. BI tells you what happened. Business analytics tells you why, what will happen next, and what to do about it. Think of BI as the engine room and business analytics as the whole ship. You need the engine, but the engine alone does not get you anywhere without navigation, crew, and a destination.
In practice, most organizations need both. The problem is that many tools marketed as business analytics platforms are really just BI tools with a new name. They are built for reporting, not for the full analytics discipline. When you try to push them beyond descriptive reporting into forecasting, embedded decision support, or AI-powered recommendations, the architecture starts to show its limits.
That gap is widening. Most legacy BI vendors are rebranding as analytics platforms, but a new coat of paint does not change the foundations. According to McKinsey, most companies are now using data to optimize operations and empower better decision-making, but the tools they are using were often built for a different purpose entirely.
The technology that bridges the gap is the semantic layer: a governed abstraction layer that defines business metrics and logic once, then makes them available consistently across dashboards, embedded products, and AI workflows. Without it, you have flat static reports. With it, you have analytics that can scale across your entire organization and beyond.
Why Traditional Business Analytics Tools Are Breaking Under Modern Demands
Traditional analytics tools are breaking because they were built for a different era. Designed for centralized teams producing scheduled reports, they cannot meet the demands of organizations that need real-time, embedded, AI-powered/agentic insights at scale. The gap between what businesses need in 2026 and what legacy tools can deliver is widening fast.
Industries Where Legacy Business Analytics Software Creates the Most Pain
Every industry needs analytics, but some feel the limitations of legacy platforms more acutely than others.
- SaaS and Technology: Customer-facing embedded analytics at scale requires architecture that legacy tools simply were not built for.
- Healthcare: Clinical insights demand strict governance and compliance, which fragmented, hardcoded dashboards cannot reliably provide.
- Finance: Risk modeling and regulatory reporting require consistent, auditable metrics across the entire organization.
- Manufacturing: Supply chain optimization and predictive maintenance depend on real-time data, not batch-updated reports.
- E-commerce: Real-time customer behavior analysis and personalization require speed and flexibility that desktop-era tools cannot match.
- HR: Workforce analytics and talent optimization need accessible, self-service insights for non-technical users.
The following pain points apply broadly, but they hit the above industries hardest.
Pain Point 1: Decisions Based on Stale and Inconsistent Data
Different teams are working from different numbers for the same metric. Marketing calls them "registered users." Sales calls them "active users." Finance calls them "customer count." They are all pulling from the same database and arriving at different figures.
This happens because legacy tools hardcode business logic directly into individual dashboards rather than defining it in a central, governed semantic layer. When a database schema changes, reports break. When a business rule changes, every dashboard needs to be manually rebuilt. Time-to-insight is measured in weeks, not hours, because centralized data teams simply cannot keep up with the volume of requests.
Root cause: No governed semantic layer means every dashboard is hardcoded to data sources with inconsistent business logic.
Pain Point 2: Analytics Teams Drowning in Report Backlogs
Analysts in most organizations spend most of their time on data preparation, building ad hoc reports, and adding requested changes to dashboards. That leaves little time for actual analysis. Business users wait days or weeks for answers to straightforward questions.
Self-service analytics sounds good in theory. In practice, tools are too complex for non-technical users to operate independently. In platforms like Power BI, users frequently need to go back to the data team to request changes to existing dashboards, creating a bottleneck that defeats the purpose of self-service entirely.
Root cause: Legacy business analytics tools expose data complexity instead of abstracting it, making analysts the translation layer between data and business users.
Pain Point 3: Embedding Requires Starting Over
Desktop-first tools were not designed to be embedded into products or workflows. Customization requires complete rebuilds rather than configuration, and embedding often demands additional infrastructure, including separate servers, on-premise report sharing, and third-party tooling that was never part of the original architecture. White-labeling is an afterthought rather than a core capability.
The licensing model makes this worse. Heavy per-user pricing makes customer-facing analytics prohibitively expensive at scale. A tool that works for 50 internal users becomes financially unviable when you are trying to serve 5,000 customers.
Root cause: Monolithic architecture built for centralized reporting, not composable or API-first design.
Pain Point 4: AI That Hallucinates Insights
AI is being bolted onto analytics platforms at speed, but without the right foundations, the results are unreliable. AI tools generate inconsistent metrics because they lack business context. There are no standardized definitions or context for the AI to reference, so every implementation requires custom data pipelines and validation work.
The result: business users stop trusting AI-generated insights. And once trust is gone, adoption collapses. Gartner predicts that by 2028, 50% of organizations will implement a zero-trust posture for data governance specifically because of the proliferation of unverified AI-generated data. This is a direct consequence of AI systems operating without governed business context.
Root cause: Without a semantic layer, context management, and a deterministic query engine, AI has no structured business context to work from, and hallucinations are inevitable.
Pain Point 5: Scale Means Re-Platforming
A tool that works well for 50 users can collapse at 500. Performance degrades as data volumes grow. Platforms built for internal dashboards cannot simultaneously support customer-facing analytics. And when you outgrow the tool, migration costs and disruption can set an organization back by months.
This is not a resourcing problem. It is an architecture problem.
Root cause: Desktop-era architecture with cloud hosting added on top is not the same as cloud-native, multi-tenant design.
Pain Point 6: Low Analytics Adoption Across the Organization
Analytics tools are often used by a small group of specialists and almost no one else. Marketing, sales, and operations teams revert to software they already use, such as Excel, CRMs, and GA, because the analytics platform is too complex to use without training.
This is not a user problem. When non-technical users cannot get value from a tool without specialist help, the tool has failed them. Adoption stays low, investment goes to waste, and the data team gets buried in requests that should be self-serve.
Root cause: Tools built for data experts expose technical complexity rather than translating it into business concepts everyone can use.
How to Choose a Business Analytics Tool: 8 Critical Requirements for 2026
Choosing the right tools for business analytics comes down to eight capabilities. Each one maps directly to a real failure mode in legacy platforms. The table below shows what you need and why.
- Decisions based on stale and inconsistent data.
Critical Requirement
- Governed Semantic Layer + Context Management.
- Analytics teams drowning in report backlogs.
Critical Requirement
- No-Code User Experience + Governed Semantic Layer.
- Embedding requires starting over.
Critical Requirement
- Embedded-First Architecture.
- AI that hallucinates insights.
Critical Requirement
- Semantic Layer + Deterministic AI Engine.
- Scale means re-platforming.
Critical Requirement
- Cloud-Native Architecture.
- Users ask data teams to make report changes.
Critical Requirement
- Self-Service Analytics + AI discovery.
- Low analytics adoption.
Critical Requirement
- No-Code UX + Code-First Developer Experience.
Below we look at these requirements in more detail. The first five eliminate the most common analytics failures, while the final three ensure your platform does not just fix today's problems but supports tomorrow's growth.
1. Governed Semantic Layer for Consistent Metrics
A governed semantic layer is an abstraction layer that sits between your raw data and your analytics experiences. It defines metrics, business logic, and data relationships once, then makes those definitions available consistently across every dashboard, report, and embedded analytics experience in your organization.
Without a semantic layer, every dashboard is hardcoded directly to a database, and the same metric gets defined in dozens of different ways. With one, changing a metric definition in a single place updates it everywhere automatically.
The semantic layer also plays a critical role in AI. It provides the deterministic business context that AI models need to generate reliable, consistent results rather than hallucinated ones.
What to evaluate:
- Does the platform have a true semantic layer or just a visualization layer?
- Can business logic be defined independently of individual dashboards?
- Can the semantic layer be versioned and governed?
2. Embedded-First Architecture
Embedded-first architecture means APIs and SDKs designed from the ground up for embedding analytics into products and workflows, not added on as an afterthought. It enables white-label customization without rebuilding and delivers the performance that end-user applications require.
Modern analytics needs to live where decisions are actually made: inside CRMs, operations tools, and customer portals. Desktop-first tools retrofitted with APIs create bloated, slow embedded experiences. Licensing models also matter here. Per-user pricing that made sense for internal tools becomes prohibitively expensive when you are serving thousands of external customers.
What to evaluate:
- Can you customize the user experience without forking the entire codebase?
- Does it support multitenancy at scale?
- Are embedding and APIs first-class features or afterthoughts?
3. AI Tools for Business Analytics That Actually Work
AI-powered analytics includes natural language querying, automated insight generation, anomaly detection, and predictive and prescriptive recommendations.
AI without governed business context produces hallucinated insights. A generic large language model pointed at a database has no idea what "revenue" means to your organization. A deterministic query engine combined with a semantic layer gives AI models the structured business context they need to generate results that are accurate, consistent, and traceable.
AI should complement the semantic layer, not replace it. Context management is what keeps that relationship governed and reliable at scale.
What to evaluate:
- How does the platform provide business context to AI models?
- Can AI query results be traced back to governed metric definitions?
- Does AI complement or bypass the semantic layer?
4. Cloud-Native Architecture Built for Scalability
Cloud-native architecture means the platform was designed specifically for the cloud using microservices, containers, and dynamic scaling — not a desktop tool with cloud hosting added on top. True multitenancy goes beyond row-level security. It means logical separation through distinct child environments, so each customer or business unit operates in its own governed space.
Many tools marketed as "enterprise-grade" are still running on desktop-era foundations. When data volumes grow or concurrent users increase, performance degrades. Replatforming mid-growth is one of the most disruptive and expensive moves an organization can make.
What to evaluate:
- Is it truly multi-tenant?
- What happens to performance at 10x current data volumes?
- Can it support internal and customer-facing analytics simultaneously?
5. Developer Experience: Code-First Workflows for Modern Teams
A strong developer experience means Git-based version control for analytics artifacts, CI/CD pipelines for testing and deployment, and an API-first design that supports automation and integration with existing engineering workflows.
Modern data teams work in code. Analytics governance and compliance require versioning, testing, and rollback capabilities, not just drag-and-drop interfaces. A platform that forces developers into a UI-only workflow creates bottlenecks and limits what teams can build.
What to evaluate:
- Can analytics logic be version-controlled in Git?
- Does it support infrastructure-as-code approaches?
- Can deployments be automated via CI/CD pipelines?
- Can I use agents for managing my workflows via code?
6. User Experience: No-Code for Business Users
The best analytics platforms serve two audiences without compromise: business users who need intuitive self-service interfaces, and developers who need full programmatic control. Forcing everyone into the same interaction paradigm fails both groups.
Business users should not need SQL to explore data. Marketing, sales, and operations teams should be able to answer their own questions without filing a request with the data team. At the same time, developers should not be constrained by drag-and-drop limitations when they need to build something more sophisticated. AI-powered interfaces extend this further, giving consumers a natural language route to insights without requiring technical knowledge.
What to evaluate:
- Can non-technical users create meaningful analytics without training?
- Can developers extend and customize without hitting platform limits?
- Does the UI layer sit on top of a governed semantic layer to ensure consistency?
- Can the AI capabilities be used by business users?
7. Integration and Extensibility: Plays Well With Your Existing Stack
Integration and extensibility means native connectors to major data sources and warehouses, open APIs for custom integrations, and support for modern data stacks including dbt, Snowflake, and Databricks.
Business analytics tools that require data replication create latency and add cost. Your analytics platform should query data where it already lives, not force you to move it. Modern stacks are composable, and your analytics layer should be too. The right platform also lets you leverage investments you have already made, such as existing dbt models.
What to evaluate:
- Does it query data in place or require replication?
- Can I reuse native integrations, or do I need to build my own?
- Can it build on top of existing dbt models or warehouse investments?
8. Real-Time and Predictive Capabilities
Real-time and predictive capabilities include near-real-time data updates, built-in predictive modeling and forecasting, and prescriptive recommendations that go beyond reporting what happened to advising what to do next.
Batch-updated dashboards are adequate for historical reporting. They are not adequate for decision-making in fast-moving businesses. Predictive capabilities are what separate a true business analytics platform from a basic BI tool. If your platform can only tell you what happened yesterday, it is already behind.
What to evaluate:
- What is the latency between data changes and dashboard updates?
- Are predictive models built into the platform, or do they require separate tools?
- Can the platform handle streaming data sources?
Business Analytics Software Comparison: Top 11 Platforms Evaluated
This comparison table evaluates 11 leading business analytics platforms across the criteria that matter most for modern businesses: semantic layer, embedding, AI-powered analytics, scalability, developer experience, user experience, integration and extensibility, and real-time and predictive capabilities. Use it to quickly identify which platforms meet your requirements and where each one falls short.
Top Business Analytics Tools: Detailed Platform Reviews
Each of the top business analytics platforms has different advantages depending on your use case, team structure, and technical requirements. This section covers the key features, strengths, and limitations of each solution to help you make an informed decision.
GoodData
Best For:
- Companies embedding analytics into products, whether customer-facing or internal.
- Organizations requiring governed, consistent metrics across all analytics.
- Teams that need both code-first and UI-first workflows.
- Multi-tenant SaaS applications requiring white-label analytics.
Key Features:
- Governed semantic layer: Define business logic once, deploy everywhere.
- Context Management: AI memory, AI knowledge, Analytics Catalog.
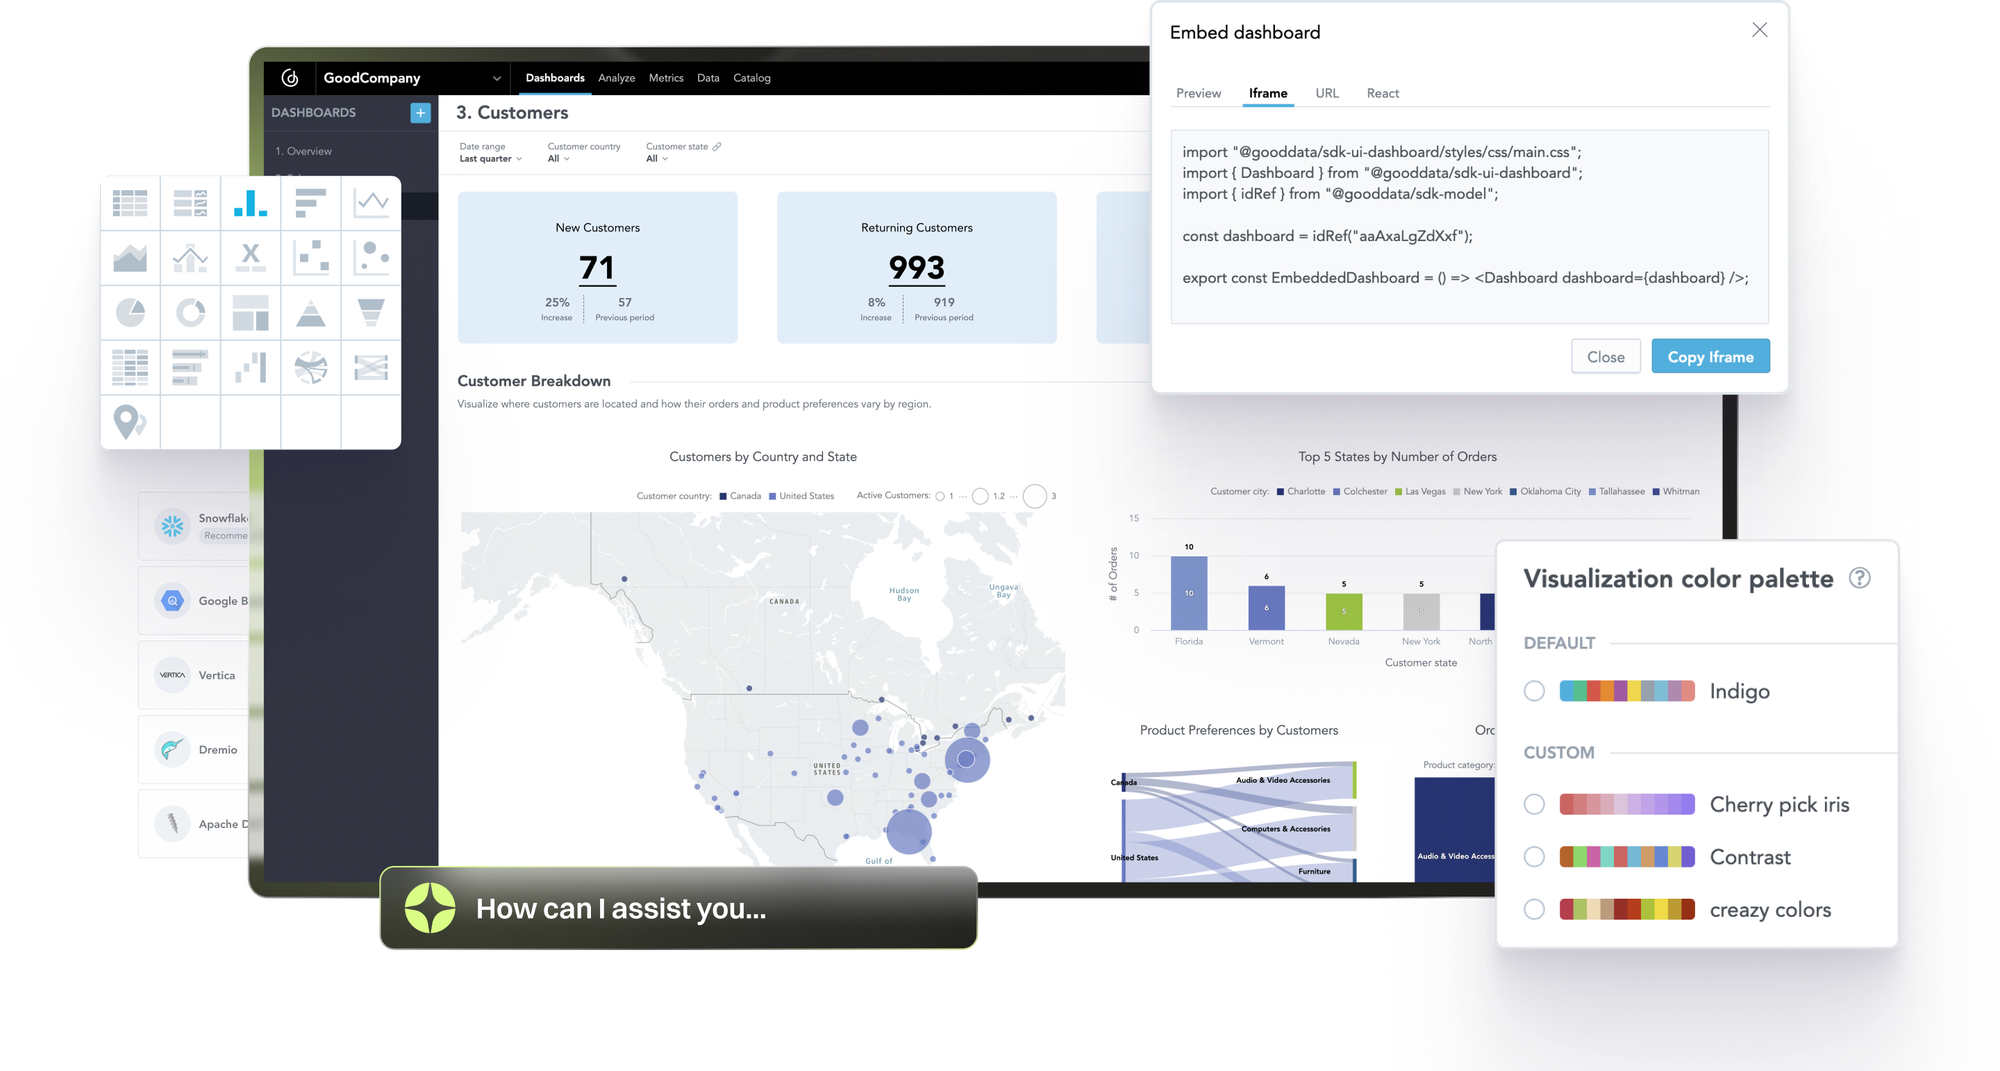
- Embedded-first architecture: APIs, SDKs, and white-label customization built in.
- Deterministic AI: The semantic layer provides business context that prevents hallucinations.
- Cloud-native scalability: Multi-tenant, elastic architecture using microservices, hosted by GoodData or by you.
- Git-based workflows: Version control, CI/CD integration, and infrastructure-as-code.
- Composable design: Works with existing data stacks including Snowflake, Databricks, and dbt.
- True semantic layer eliminates metric inconsistency and dashboard brittleness
Cons
- Requires familiarity with semantic layer concepts, though GoodData simplifies the learning curve.
- Embedded analytics does not require rebuilding or forking.
Cons
- Not the right fit for organizations that only need basic desktop reporting.
- Scales from single-tenant internal dashboards to multi-tenant customer-facing analytics.
Cons
- Modern developer workflows including Git, APIs, and automation.
Cons
- AI-ready architecture with governed business context. Bring your own context to further enhance the AI experience.
Cons
Tableau
Best For:
- Hybrid data environments where data lives on-premise, in a private cloud, or a public cloud.
- Business analysts who need interactive dashboards and ad-hoc data exploration.
- Companies with strong data storytelling and presentation requirements.
Key Features:
- VizQL engine: Converts user interactions directly into database queries, enabling highly interactive dashboards and visual exploration.
- Extensive data connectivity across a wide range of sources.
- Flexible deployment options to suit different infrastructure needs.
- Unmatched visualization flexibility and design options.
Cons
- Semantic governance is tied to workbooks rather than a centralized semantic layer.
- Intuitive for exploratory analysis.
Cons
- Embedding requires Tableau Server or Online licensing, which becomes expensive at scale.
- Strong training resources and community support.
Cons
- Limited native multi-tenant architecture for SaaS products.
- Strong Salesforce integration.
Cons
- Performance issues with very large datasets.
- Rich dashboard customization.
Cons
- Developer experience is UI-first, not code-first.
Cons
- Heavy server infrastructure requirements for large deployments.
Microsoft Power BI
Best For:
- Teams familiar with Excel-style analytics and data modeling.
- Enterprises needing tight integration with Microsoft productivity tools.
- Organizations building internal dashboards and operational reporting.
- Teams using Azure data services and Microsoft Fabric.
Key Features:
- Native integration with Microsoft products including Excel, Azure Synapse, SQL Server, SharePoint, Teams, and Microsoft Fabric.
- Low entry cost, especially for organizations with existing Microsoft 365 licenses.
- DAX: An advanced calculation language for creating complex metrics and data transformations.
- Power BI Copilot: A generative AI assistant that creates reports, explains data, and generates data visualizations using natural language.
- Affordable for existing Microsoft customers.
Cons
- Semantic models exist but are frequently coupled with individual dashboards rather than centrally governed across the organization.
- Easy adoption for Excel users.
Cons
- Embedding capabilities are limited and not designed for multi-tenancy.
- Strong Azure integration.
Cons
- Governance challenges at enterprise scale.
- Drag-and-drop interface for building dashboards, reports, and visualizations.
Cons
- Primarily UI-driven, making Git-based version control and CI/CD workflows more difficult than code-first platforms.
- Supports streaming datasets and real-time dashboards for monitoring operational metrics.
Cons
- Large deployments can lead to fragmented data models and inconsistent metrics across workspaces without strong governance practices.
- Available as SaaS via Power BI Service, on-premise via Power BI Report Server, or embedded within applications.
Cons
- Deep product-level customization for embedded use cases may require significant development effort.
- Extensive documentation, tutorials, and community resources.
Cons
Looker
Best For:
- Companies that want a centralized semantic modeling layer.
- Data teams comfortable working with SQL and data modeling languages.
- Organizations prioritizing governed metrics and reusable data models.
- A company building analytics into internal applications and data platforms.
Key Features:
- LookML: A code-based semantic modeling layer for defining metrics and business logic.
- Git-native version control built into the platform.
- Google Cloud integration following the acquisition by Google.
- Direct query: Queries data directly in cloud warehouses including BigQuery, Snowflake, and Redshift without requiring data extracts.
- APIs and SDKs for embedding analytics and automating workflows.
- Strong semantic modeling via LookML.
Cons
- Steep learning curve for non-technical users.
- Developer-friendly workflows with version control and testing capabilities.
Cons
- Creating and maintaining LookML models often requires dedicated data engineers.
- Centralized modeling reduces metric inconsistencies across the organization.
Cons
- Business users typically rely on predefined models created by the data team, limiting self-service.
- Works particularly well for organizations using BigQuery and other Google Cloud Platform services.
Cons
- Licensing models can increase costs for customer-facing analytics deployments.
Qlik
Best For:
- Enterprises requiring interactive analytics with flexible filtering.
- Companies needing integrated data preparation and analytics.
- Organizations already using Qlik data integration or ETL tools.
- Businesses prioritizing fast in-memory analytics for data exploration.
Key Features:
- Associative data indexing engine: Allows users to explore data freely by showing both related and unrelated data automatically when filters are applied.
- Interactive data exploration: Users can click through data relationships and discover patterns without predefined query paths.
- Qlik Data Integration: Built-in data preparation and transformation tools.
- Connects to cloud data warehouses, databases, SaaS applications, APIs, and flat files.
- Available as SaaS, on-premise, or hybrid deployments.
- Unique associative engine for discovering data relationships.
Cons
- Limited semantic layer governance compared to modern platforms.
- Fast in-memory performance for smaller datasets.
Cons
- Embedding is not a primary design focus.
- Built-in ETL and data preparation tools reduce reliance on external pipelines.
Cons
- In-memory architecture does not scale to cloud data volumes.
- Supports security, access controls, and data lineage.
Cons
- Licensing can be complex and expensive.
- Developers can integrate analytics into applications using APIs and SDKs.
Cons
- UI feels dated compared to newer competitors.
- Metric definitions are often handled within individual apps rather than a centralized semantic model.
Cons
- Building optimized data models requires specialized knowledge.
Cons
SAP Analytics Cloud
Best For:
- Large enterprises already using SAP ERP, SAP S/4HANA, or SAP Business Technology Platform.
- Organizations requiring integrated planning, analytics, and forecasting.
- Finance teams needing financial planning and operational analytics in one platform.
- Enterprises with strict governance, compliance, and security requirements.
- Companies looking for predictive analytics tightly integrated with their business applications.
Key Features:
- Unified platform combining business intelligence, enterprise planning, and predictive analytics.
- Built-in predictive models for forecasting, risk analysis, and scenario planning.
- Interactive dashboards and reports designed for enterprise analytics.
- Supports both live connections to SAP data sources and imported datasets.
- Combines planning and analytics in a single platform.
Cons
- Weak semantic layer outside SAP data sources.
- Enterprise-grade security and compliance capabilities.
Cons
- Complex licensing and high cost.
- Particularly strong for finance and enterprise performance management.
Cons
- Developer experience is UI-centric, not code-first.
- Designed for large organizations with complex data environments.
Cons
- The UI can feel more complex compared to newer analytics tools.
Cons
- Primarily built for internal enterprise analytics rather than product-level embedding.
Cons
- Limited support for modern code-first development and Git-based workflows.
Amazon QuickSight
Best For:
- Companies prioritizing scalable analytics without infrastructure management.
- Teams using AWS-native data pipelines and data lakes.
Key Features:
- Serverless architecture that scales automatically without infrastructure management.
- Pay-per-session pricing model.
- SPICE in-memory engine: Accelerates queries and enables fast interactive analytics.
- ML-powered insights including anomaly detection, forecasting, and natural language querying.
- Connects to AWS data services, SaaS applications, databases, and on-premise sources.
- Cost-effective for existing AWS customers.
Cons
- Business logic and metric definitions are often tied to individual datasets rather than a centralized semantic layer.
- Serverless scalability with no infrastructure overhead.
Cons
- Embedding capabilities are basic compared to purpose-built platforms.
- Strong AWS data source integration.
Cons
- Feature set lags behind category leaders.
- Supports anomaly detection, forecasting, and natural language querying.
Cons
- Limited customization options.
Cons
- Not well suited for multi-tenant customer-facing analytics.
Cons
- Organizations using non-AWS infrastructure may face additional integration work.
Cons
- The UI feels less modern compared to newer analytics platforms.
SAS Visual Analytics
Best For:
- Organizations requiring advanced statistical analysis and predictive analytics.
- Enterprises in regulated industries such as finance, healthcare, and pharmaceuticals.
- Companies already using SAS analytics or data science platforms.
- Data science teams needing integrated analytics and machine learning capabilities.
- Organizations prioritizing governance, compliance, and auditability.
Key Features:
- Built-in statistical modeling, forecasting, and machine learning capabilities.
- Data cleansing, transformation, and preparation tools.
- Role-based access control, auditing, and compliance features for regulated industries.
- Integration with SAS Viya and other SAS tools for advanced analytics and machine learning workflows.
- Widely used in banking, insurance, healthcare, and pharmaceuticals.
- Interactive interface for building dashboards, reports, and visualizations.
Cons
- Expensive licensing.
- Natural language querying with automated insights.
Cons
- Limited developer experience and no open APIs.
- In-memory processing for faster analysis of large datasets.
Cons
- On-premise heritage with cloud capabilities added on rather than built in.
- Robust security, auditing, and compliance capabilities suited to regulated industries.
Cons
- Advanced statistical features require specialized knowledge to operate.
Cons
- Primarily designed for internal enterprise analytics, not product embedding.
Cons
- Less flexible compared to newer cloud-native platforms.
Domo
Best For:
- Companies wanting an all-in-one analytics and data platform.
- Teams that value collaboration features within their analytics tool.
- Organizations needing pre-built integrations with business applications.
- Companies that prefer a fully managed SaaS analytics platform.
Key Features:
- Single cloud platform combining data integration, data preparation, analytics, and dashboards.
- Magic ETL: A visual data transformation tool that allows users to prepare and combine datasets without writing code.
- Pre-built connectors for hundreds of cloud applications, databases, and file-based data sources.
- Built-in collaboration tools for sharing dashboards and commenting on data within the platform.
- Fast dashboard deployment due to built-in connectors and visual data preparation.
Cons
- No true semantic layer, which creates governance challenges at scale
- Responsive layout support across devices.
Cons
- Expensive licensing for advanced features.
- Teams can discuss insights and share analytics directly within the platform.
Cons
- Not designed for embedding or multitenancy.
Cons
- Limited developer workflows.
Cons
- Metric definitions and business logic are difficult to centralize across large organizations.
Cons
- Requires data modeling before dashboards can be built; does not mirror the connected data source directly.
Cons
- Very large datasets may require optimization or external data warehouse support.
Sisense
Best For:
- Organizations requiring highly customizable white-label analytics.
- Product teams building data-driven applications.
- Companies needing flexible APIs and developer tools for analytics integration.
- SaaS platforms requiring multi-tenant analytics environments.
Key Features:
- Embedding-focused architecture with JavaScript libraries and APIs for building custom analytics experiences.
- Query optimization that leverages CPU and memory resources efficiently.
- Extensive customization capabilities for white-label deployments.
- Multi-tenancy support with tenant-level data separation.
- Available as cloud-hosted, self-hosted, or hybrid deployments.
- ElastiCube: Sisense's proprietary data store, suited to smaller/mid-size data volumes.
- Strong embedding capabilities via JavaScript libraries and modular APIs.
Cons
- Custom embedded analytics deployments can require significant development effort.
- Customizable for white-label scenarios.
Cons
- Pricing can become expensive as embedded analytics usage grows.
- Multi-tenant architecture supports SaaS applications and customer-facing analytics.
Cons
- Less intuitive for non-technical business users.
Cons
- Smaller community and ecosystem compared to larger BI platforms.
Sigma
Best For:
- Organizations using cloud data warehouses, particularly Snowflake, BigQuery, or Databricks.
- Business users comfortable with spreadsheet-style analytics.
- Teams wanting to query warehouse data directly without data extracts.
- Companies prioritizing self-service analytics for business teams.
Key Features:
- Spreadsheet-style interface that feels familiar to business users.
- Direct querying of cloud data warehouses including Snowflake, BigQuery, and Databricks.
- Collaboration features for shared analytics workflows.
- Data writeback: Enables users to write data back to the warehouse for planning and operational workflows.
- Business users can explore datasets without needing SQL.
Cons
- Limited semantic layer governance.
- Supports embedding analytics into applications and portals via APIs.
Cons
- Connectivity is largely limited to the main cloud data warehouses.
- Role-based access control ensures users only see authorized data.
Cons
- Not designed primarily for embedded analytics.
- Tracks changes to analyses and datasets to support governance and collaboration.
Cons
- Primarily Snowflake-focused, though expanding to Databricks and BigQuery.
Cons
- Limited enterprise-grade governance for large organizations.
Cons
- Git-based development workflows are limited compared to code-first platforms.
Cons
- Organizations without a modern cloud warehouse may find Sigma unsuitable.
Why GoodData Is the Best Business Analytics Platform for Modern Enterprises
GoodData is the best business analytics platform for modern enterprises because it provides governed, AI-ready analytics that scale without constant rebuilds.
1. True Semantic Layer Eliminates the Root Cause of Analytics Chaos
Other platforms offer data modeling or visualization layers. GoodData provides a governed semantic layer that defines metrics, business logic, and relationships once and makes them available everywhere. It prevents the "50 definitions of revenue" problem that plagues legacy tools. When a metric definition changes, updates propagate automatically across every dashboard, report, and embedded experience. No manual rebuilds. It also provides deterministic business context for AI, which is what eliminates hallucinations at the source.
2. Embedded-First Architecture That Actually Scales
Desktop tools retrofitted with embedding capabilities create bloated, expensive implementations. GoodData is designed for embedding from the ground up. White-label customization does not require forking code. Multi-tenant architecture supports thousands of customers without performance degradation. API-first design enables automation and integration with existing workflows. And the licensing model does not punish you for growing.
3. AI That Does Not Hallucinate Because It Has Business Context
Generic AI pointed at a database produces unreliable results because it has no understanding of what the data means. GoodData's deterministic query engine, combined with the semantic layer, changes that. AI queries reference governed business definitions rather than raw tables. Results are consistent and traceable. Natural language queries produce accurate insights. AI complements the semantic layer rather than bypassing governance. And with bring-your-own-context capabilities, teams can further tailor the AI experience.
4. Developer Workflows for Modern Data Teams
GoodData supports the way modern data teams actually work. Git-based version control for analytics artifacts, CI/CD pipeline integration for automated testing and deployment, and infrastructure-as-code for programmatic management. At the same time, an intuitive UI ensures business users who do not code can work independently. Both audiences are served without compromise.
5. Cloud-Native Scalability Without Re-Platforming
Many tools marketed as "cloud" are simply desktop software with hosting. GoodData is cloud-native from the ground up. Elastic scalability takes organizations from proof-of-concept to enterprise without re-platforming. Multi-tenant architecture supports customer-facing analytics at scale. Performance improves as cloud data warehouse optimization improves. And GoodData works with the stack you already have, including Snowflake, Databricks, and dbt.
Proven Results: Case Studies That Show Real Business Impact
The business case for GoodData is clearest in the results its customers achieve. Here are two examples from different industries.
Persefoni is an SaaS platform that helps global organizations track greenhouse gas emissions and report against net-zero targets. After replacing Power BI with GoodData, data refresh improved from once per day to every 15 minutes (a 96x improvement), dashboards now load in 2 seconds, and over 1,000 enterprise users access analytics directly within the product without leaving the platform.
VETS AS builds practice management software for veterinary clinics across the Czech Republic and Slovakia. By embedding GoodData into their product, clinics gained access to tailored, real-time business insights that directly improved performance. The results: a 20% increase in gross income, 15% improvement in workforce productivity, and a 5% increase in EBITDA margin.
Get Started With GoodData
The best business analytics platform is not the one with the most chart types. It is the one that adapts as fast as your business without constant rebuilds.
If you are tired of report backlogs, brittle dashboards, and business analytics tools that cannot keep up with changes, it is time to see what a different architecture makes possible.
Get a personalized demo to see how GoodData can help your business.
Frequently Asked Questions About Business Analytics Tools
How long does it take to implement a business analytics platform?
Implementation timelines vary from a few weeks to several months depending on data complexity, integrations required, and team readiness. Cloud-native platforms with modern APIs deploy significantly faster than on-premise solutions. Organizations with a well-structured data warehouse and clear metric definitions will see the fastest time to value.
What is the ROI of investing in business analytics software?
ROI comes from faster decisions, reduced analyst workload, and lower cost of insight delivery. Organizations that replace fragmented reporting with a governed semantic layer typically see analysts spend less time on data preparation and more time on analysis. Customer-facing embedded analytics can also open new revenue streams or strengthen product stickiness.The most effective AI tools for business analytics multiply this ROI further by automating insight generation and surfacing anomalies that analysts would otherwise miss.
Can business analytics tools work with Excel and Google Sheets?
Most modern business analytics platforms connect to Excel and Google Sheets as data sources or export destinations. However, relying on spreadsheets as a primary data source limits scalability and governance. The better approach is to use business analytics applications as the single source of truth, with spreadsheet integration available for users who need it.
Do I need a data warehouse to use business analytics tools?
Not always, but having one significantly improves performance and governance. Many platforms can connect directly to databases, SaaS applications, and flat files. That said, a cloud data warehouse such as Snowflake, BigQuery, or Databricks gives you a reliable, scalable foundation that makes your analytics platform faster and easier to govern.
What is the difference between cloud-based and on-premise business analytics solutions?
Cloud-based solutions are hosted and managed by the vendor, offering faster deployment, automatic updates, and elastic scalability. On-premise solutions run on your own infrastructure, giving you more control but requiring significant IT resources to maintain. Most organizations are moving to cloud-based platforms for the lower operational overhead and better scalability.
How do business analytics tools handle data security and compliance?
Enterprise-grade platforms offer role-based access control, row-level security, data encryption, and audit logging. For regulated industries such as finance and healthcare, look for platforms with SOC 2, GDPR, and HIPAA compliance certifications. Multi-tenant architectures should provide logical separation between environments, not just row-level restrictions.
Can non-technical users really use business analytics software without training?
It depends on the platform. Tools built on a governed semantic layer present data in business terms rather than technical ones, which makes self-service genuinely accessible to non-technical users. Platforms that expose raw data complexity require more training. The best platforms let business users explore and answer their own questions without filing a request with the data team.
What business analytics tools do Fortune 500 companies use?
Fortune 500 companies rely on the top business analytics tools available, including Tableau, Power BI, SAP, and GoodData, often depending on their existing technology stack. Large enterprises with SAP infrastructure tend to favor SAP Analytics Cloud. Microsoft-centric organizations lean toward Power BI. Companies building customer-facing or embedded analytics at scale increasingly turn to purpose-built AI platforms like GoodData.
How do embedded analytics differ from traditional BI reporting?
Traditional BI reporting delivers insights through a separate analytics application that users log into. Embedded analytics integrates those insights directly into the products, portals, and workflows where decisions are made. Embedded analytics requires an API-first, white-label capable platform with multi-tenant architecture. Traditional BI tools were not designed for this and often produce slow, expensive, hard-to-customize implementations when forced into an embedded use case. When evaluating analytics tools for business embedding, prioritize platforms with native multitenancy, white-label capability, and API-first design.
Trusted by


Does GoodData look like the better fit?
Get a demo now and see for yourself. It’s commitment-free.