8 Essential Sales Dashboard Examples for Revenue Growth


Summary
This article includes key sales dashboard examples and shows how they support various roles within a sales organization. You'll see how well-structured dashboards offer executives a high-level overview, give managers valuable team insights, and help individual reps stay aligned with their goals. You'll also find inspiration to create effective dashboards tailored to your own sales team.
Most Common Types of Sales Dashboards and KPI Metrics
Sales analytics software brings critical data together in one place, helping teams track performance, identify issues early, and stay focused on what drives revenue. The right dashboards give leaders a clear view of sales activity, help managers coach more effectively, and keep reps aligned with their goals.
The sections below cover the most common types of sales dashboards and the key KPIs they track, showing how each one supports specific roles within a sales organization.
1. Sales Pipeline Dashboard
This dashboard provides a consolidated view of sales opportunities, helping sales teams track progress and improve forecasting. It visualizes the pipeline as a funnel, showing the distribution of deals across pipeline stages — from lead to closed deal — allowing sales reps to identify bottlenecks and prioritize their efforts. Key metrics such as total pipeline value, number of open sales opportunities, and average deal size provide insights into revenue potential, while sales cycle length and win rate help measure efficiency and closing probability. By consolidating data from multiple sources, the dashboard also ensures accurate tracking of deals.
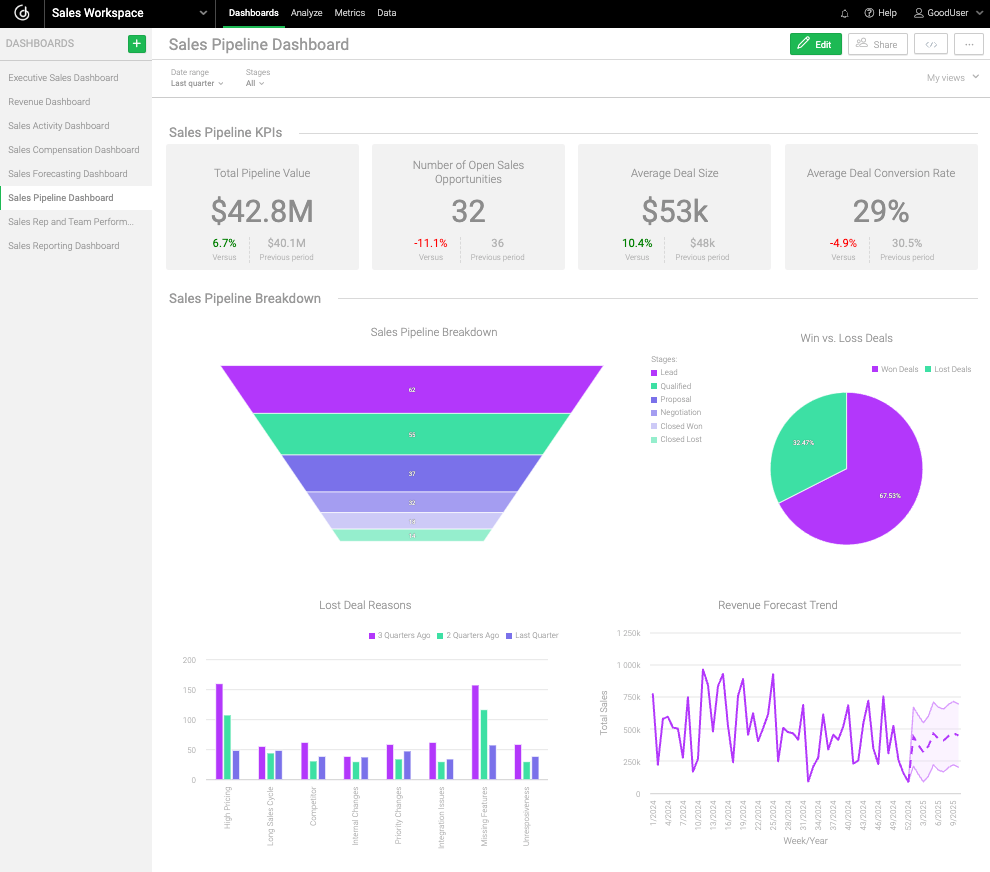
Sales pipeline dashboard
2. Sales Rep and Team Performance Dashboard
This provides a comprehensive view of individual and team effectiveness, allowing managers to track key metrics and optimize sales velocity. It features a leaderboard showcasing revenue per sales rep, number of closed deals, and quota attainment, helping managers identify top performers and areas for improvement. By analyzing pipeline movement and funnel progression, the dashboard ensures effective tracking of opportunities, measuring average deal size and lead response time to improve conversions. Additionally, tracking the number of contacts and meetings provides valuable insights into outreach efforts. Above all, this dashboard provides real-time insights to boost productivity and close more deals.
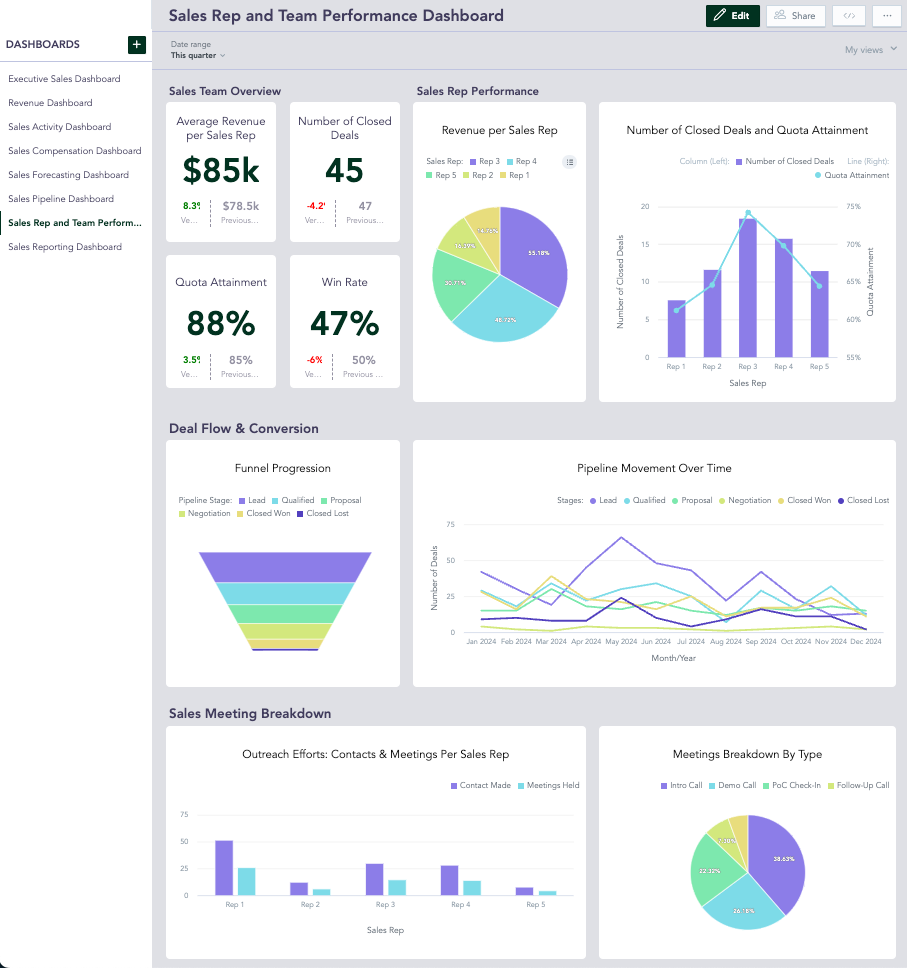
Sales Rep and Team Performance Dashboard
3. Sales Forecasting Dashboard
This dashboard uses predictive analytics to generate data-driven revenue forecasts, helping sales teams anticipate outcomes and proactively adjust strategies. It tracks forecasted revenue, the probability of successful deal closure, and historical sales trends to identify patterns and improve decision-making. By factoring in seasonal fluctuations and their impact, the dashboard helps teams prepare for changes in demand, while pipeline coverage (pipeline-to-target ratio) ensures the sales team has enough opportunities to meet revenue goals. By combining real-time insights and historical trends, this dashboard leads to improved sales projections and better strategic planning.
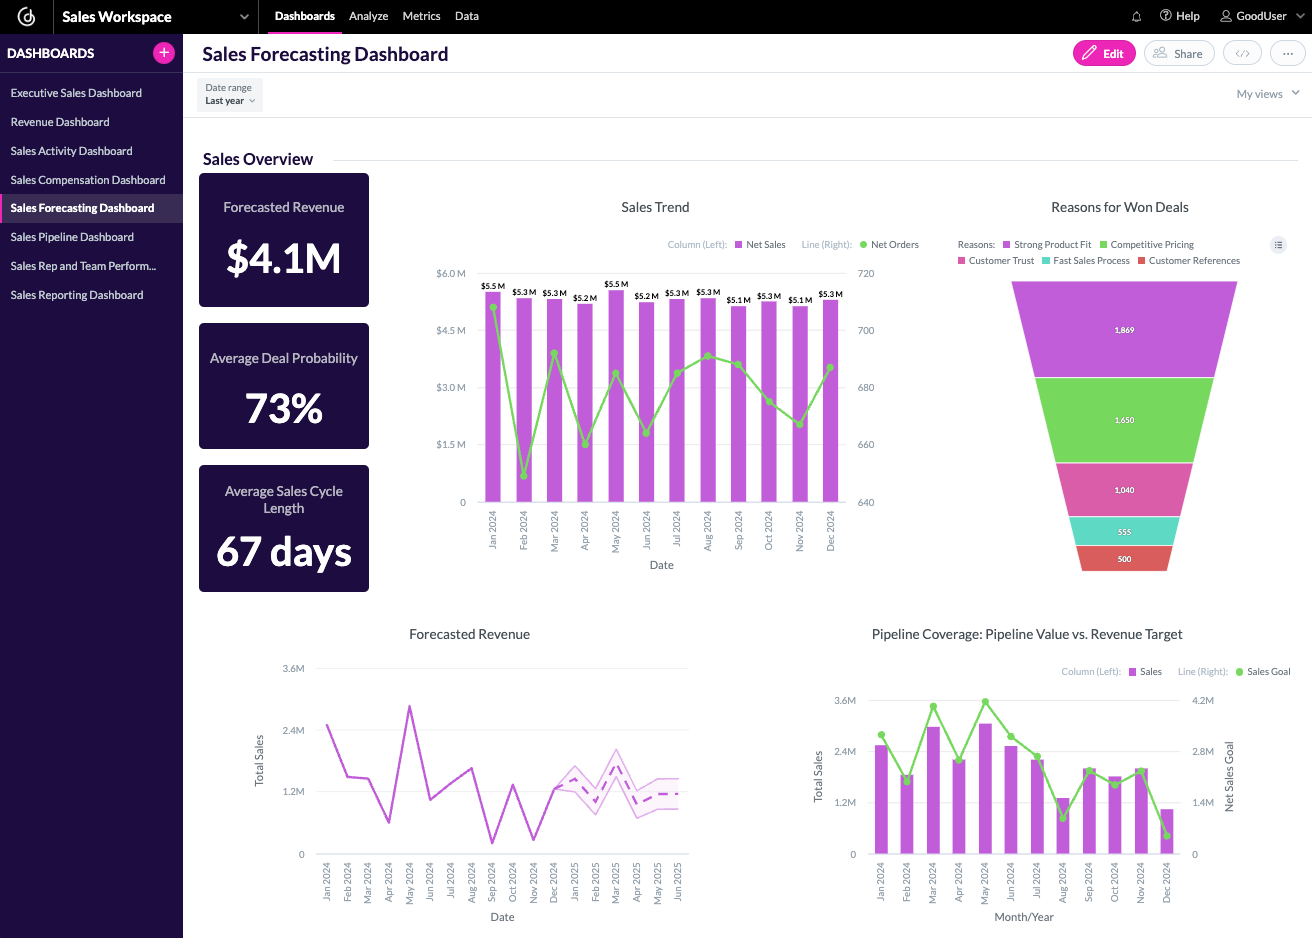
Sales Forecasting Dashboard
4. Sales Reporting Dashboard
This provides an overview of sales performance across different timeframes, offering insights into daily, weekly, and monthly sales trends. It tracks key metrics such as the number of sales activities, open leads, and target achievement rate, ensuring teams stay informed about progress. Analyzing sales by region or segment helps to identify high-performing areas and opportunities for growth. With real-time data, sales managers can track performance and fine-tune strategies, making this dashboard an essential tool for continuous improvement and strategic adjustments.
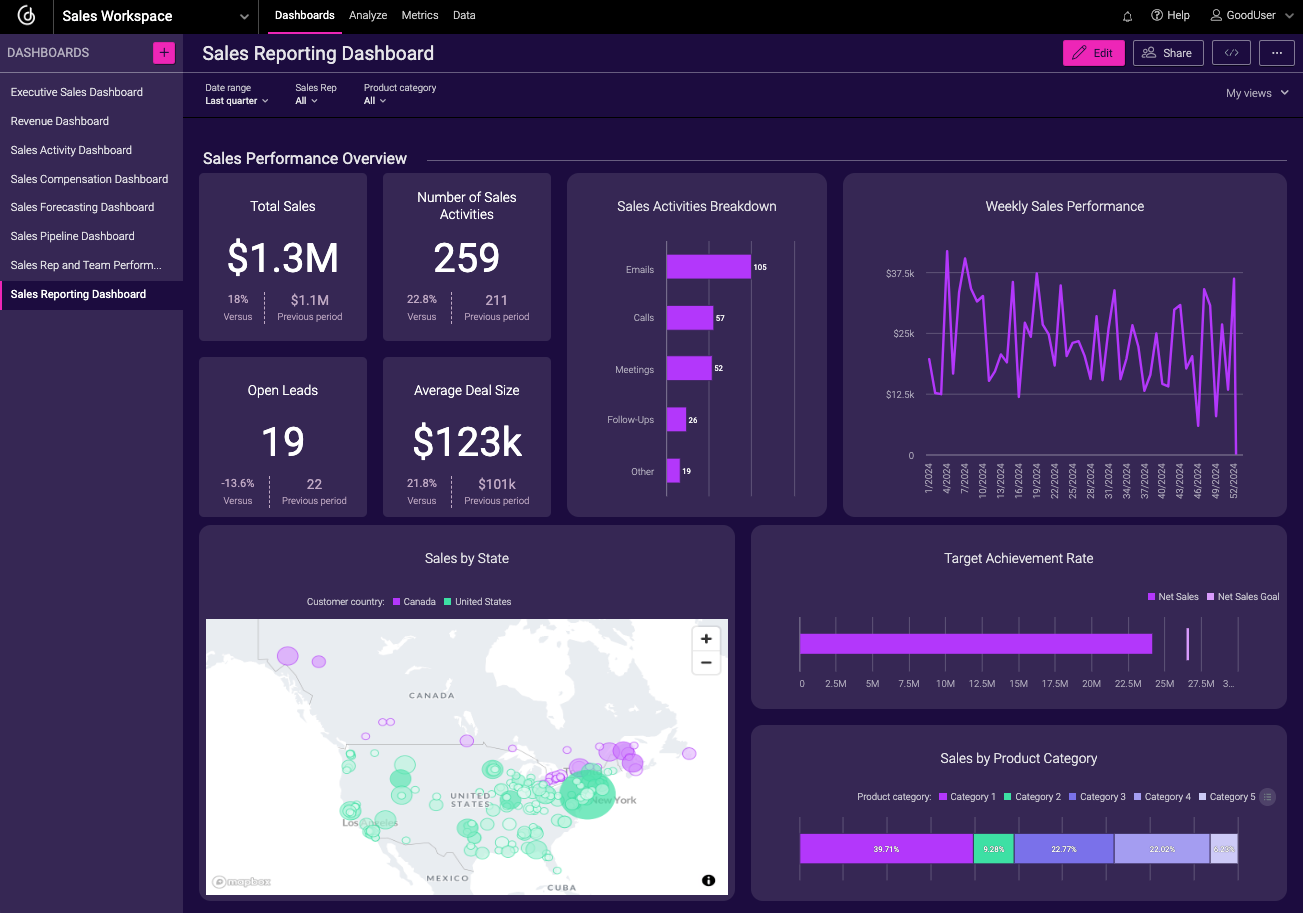
Sales Reporting Dashboard
5. Sales Activity Dashboard
This dashboard ensures consistent engagement with prospects by providing real-time visibility into a sales team's daily outreach efforts. It tracks key activity metrics such as the number of calls, emails, and meetings, helping managers assess productivity and outreach effectiveness. The response rate highlights the percentage of successful interactions, while the number of follow-up activities ensures that potential deals are nurtured properly. Consolidating this data helps sales teams optimize their engagement strategies and maintain a steady flow of interactions to drive conversions.
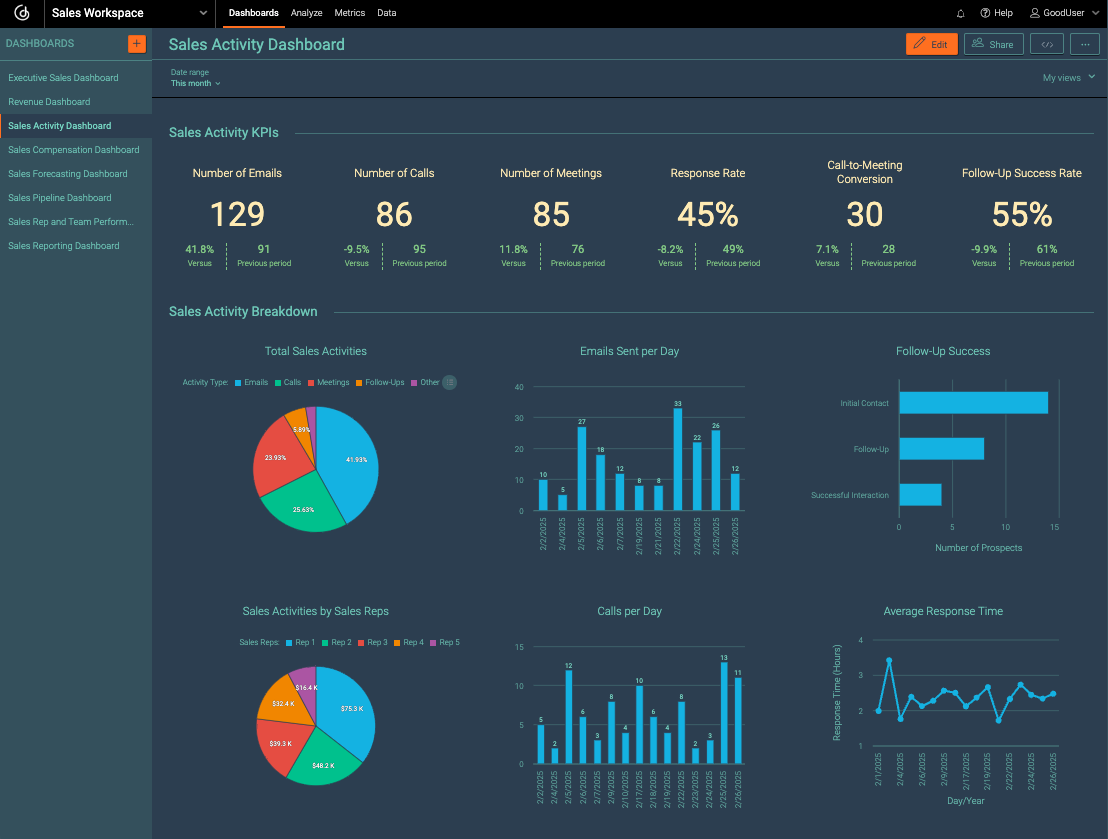
Sales Activity Dashboard
6. Revenue Dashboard
By tracking key metrics across different regions, channels, and products, this dashboard provides a comprehensive view of a company’s financial performance It highlights total revenue, recurring revenue (MRR/ARR), and the impact of upsells and cross-sells. By analyzing Customer lifetime value (LTV) and comparing sales to targets, businesses can assess profitability and the effectiveness of the sales process. With real-time insights into revenue streams, this dashboard helps sales and finance teams improve their strategies and create sustainable business growth.
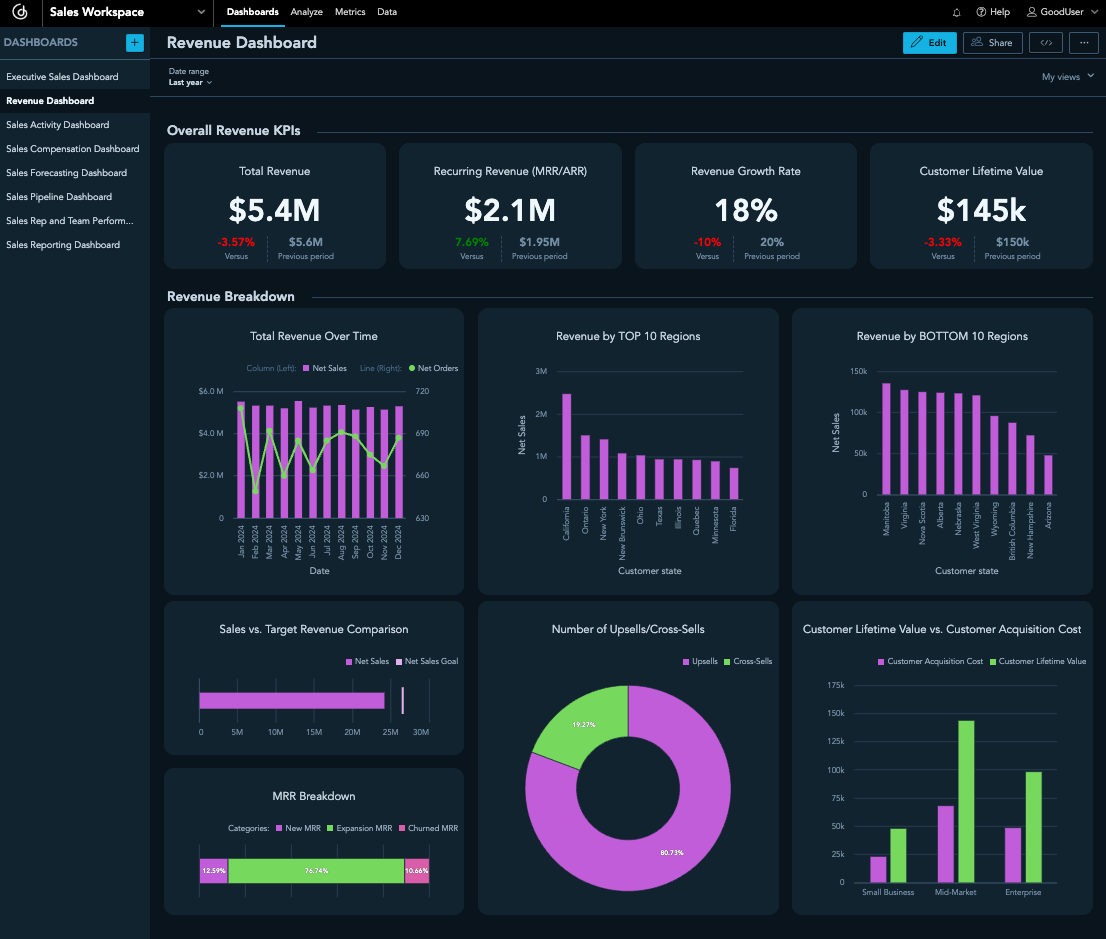
Revenue Dashboard
7. Executive Sales Dashboard
This dashboard gives a big-picture view of sales performance, showing key revenue metrics that matter to CEOs. It tracks total revenue (year-to-date vs. target) to keep business goals on track and monitors win rates to measure sales efficiency. By highlighting top-performing products or services, executives can identify growth opportunities and strategic focus areas. The dashboard also measures the number of new customers, Customer acquisition cost (CAC), and Customer lifetime value (LTV), helping leaders evaluate profitability and long-term sustainability. With this clear, data-driven overview, executives can make informed strategic decisions and increase their chances of business success.
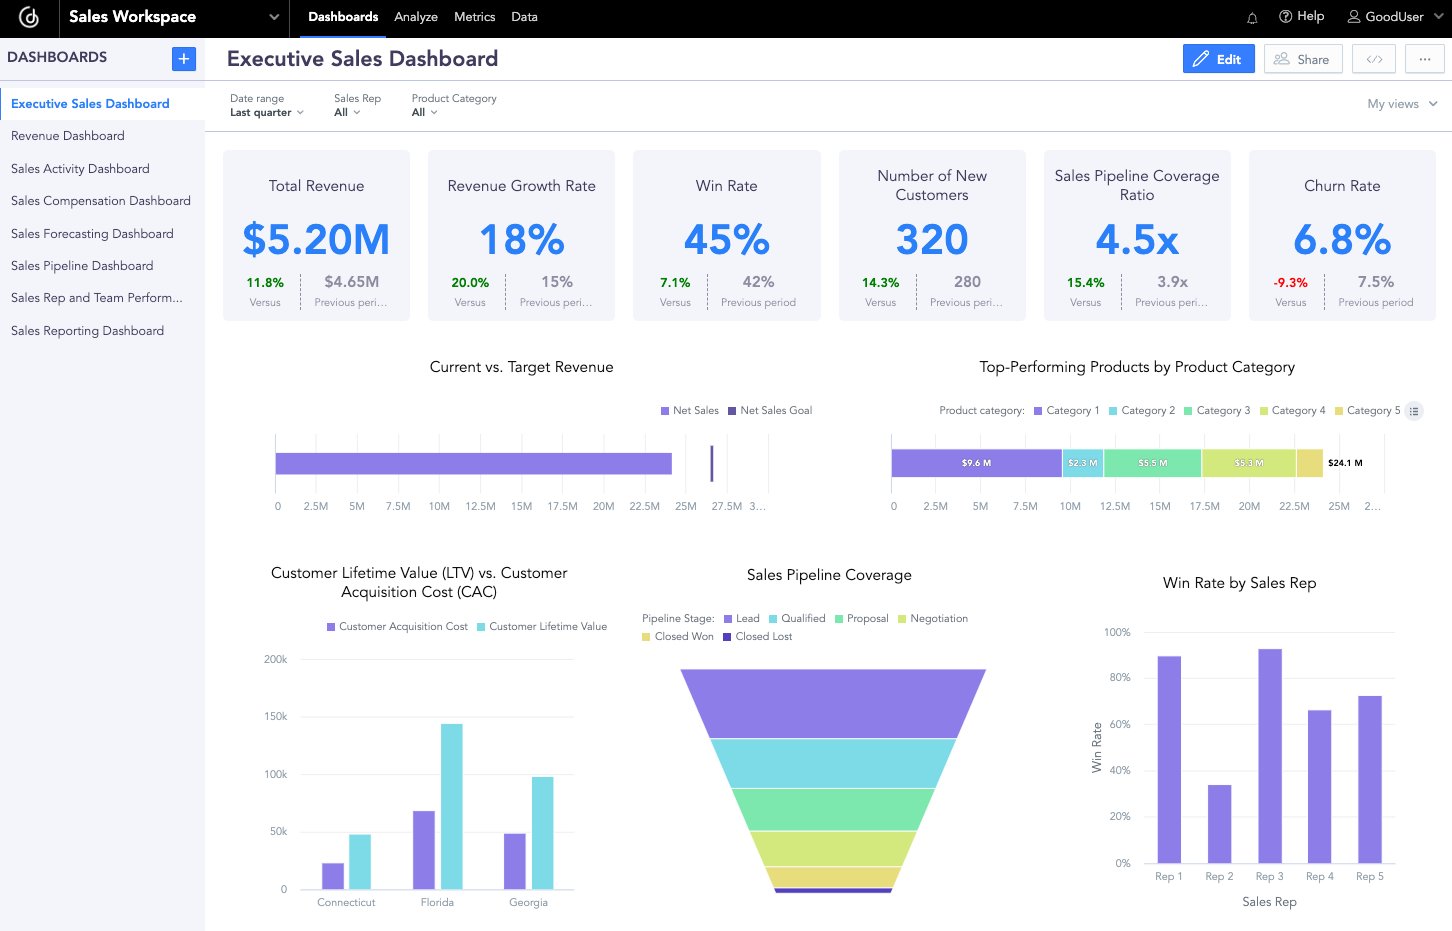
Executive Sales Dashboard
8. Sales Compensation Dashboard
This dashboard gives a clear look at how compensation affects sales performance. It tracks commissions to make sure reps are rewarded for their success and monitors quota attainment to measure overall progress. By analyzing incentivized deals, managers can see if commission-based motivation is actually working. It also measures the ROI of the compensation system, ensuring incentives boost revenue without breaking the budget. With real-time insights, sales leaders can fine-tune commission plans, align incentives with company goals, and keep the team motivated.
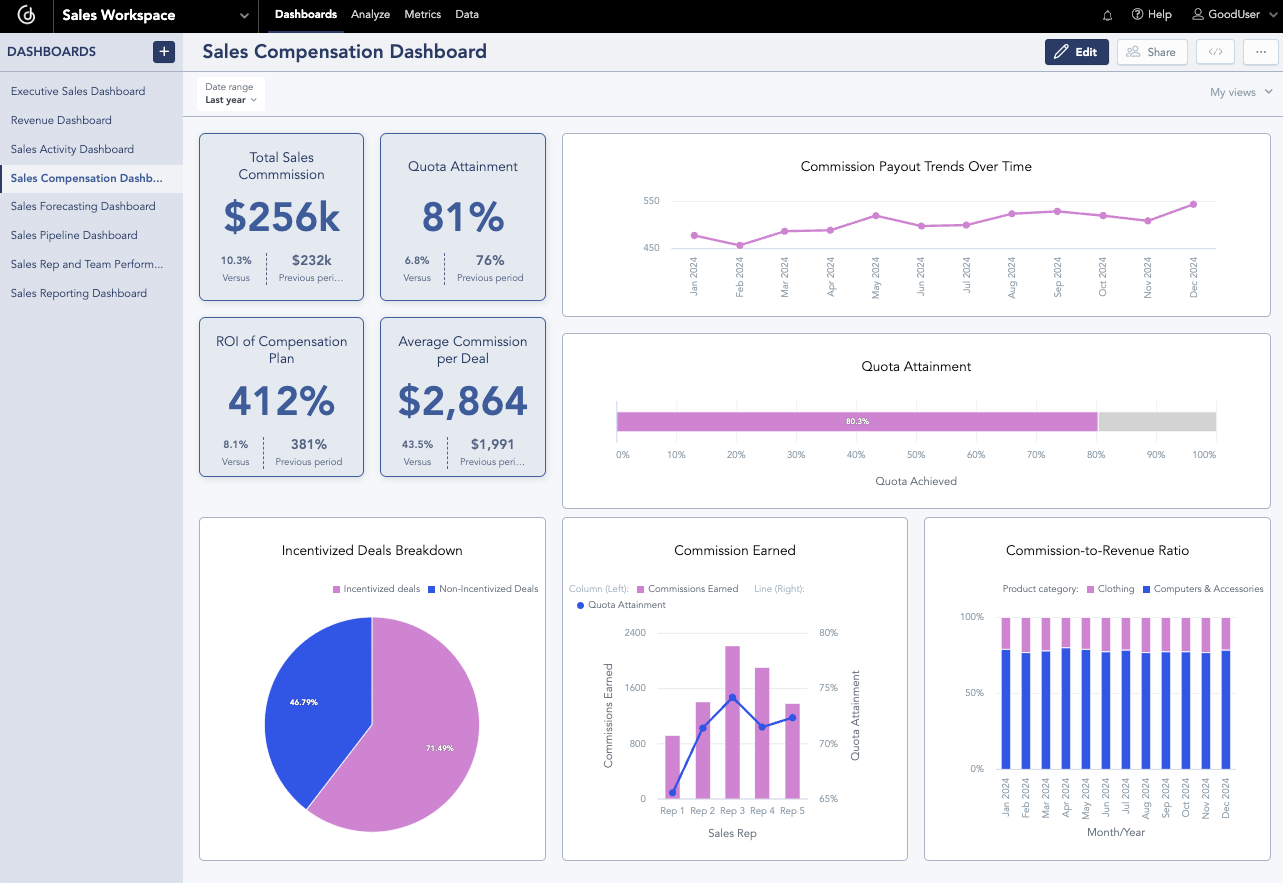
Sales Compensation Dashboard
Create Your Own Sales Dashboards with GoodData
GoodData’s intuitive analytics platform makes it easy to build dashboards like the ones in this article, serving businesses of all sizes, from small businesses to large enterprises. But while dashboards and drag-and-drop tools are essential, they’re only part of the equation. A modern BI tool ought to provide advanced features like data modeling, scalability, automation, AI capabilities, modern embedding options, and seamless integration with your existing tech stack. Check out the 11 must-have features of a modern BI tool for more on this.
Feel free to browse our customer stories to see how real businesses are leveraging GoodData to build scalable, high-performance analytics solutions tailored to their needs. Alternatively, schedule a demo to learn how our platform can optimize your operations with a comprehensive, future-proof BI approach.
FAQs About Sales Dashboards
It visualizes the status of sales opportunities at each stage (from leads to closed deals), highlighting metrics like total pipeline value, average deal size, and win rate.
It tracks commission progress, quota attainment, and incentive alignment so reps and managers stay motivated and focused on revenue goals.
Managers typically view team quota progress, pipeline coverage, forecast accuracy, deal stage conversion rates, and cycle time for efficient oversight.
Drill-down lets users move from broad summaries into granular data (such as performance by rep, region, or product). It helps diagnose issues and uncover opportunities.
They consolidate data across CRM, forecasting, and commission systems into one central view, enabling teams to spot bottlenecks, measure success, and act on actionable intelligence in real time.


