HR Dashboard Examples: The Ultimate Guide for Modern HR Teams


Summary
Modern HR teams face pressure to hire faster, retain top talent, and demonstrate measurable impact. This guide explores how specialized HR dashboards transform people data into actionable insights. From tracking time-to-hire and pinpointing causes of absenteeism to monitoring compensation equity, these examples show how data visualization empowers HR leaders to make proactive, evidence-based decisions that align with business goals.
Most Common Types of Dashboards
HR dashboards have become essential for professionals who need to turn workforce data into actionable insight. By visualizing key metrics, HR teams can monitor performance, spot emerging trends, and address potential issues before they escalate. Effective dashboards support stronger strategic planning, smarter resource allocation, and clearer reporting to leadership. Selecting the right data analytics software for your HR department is the first step to unlocking these benefits. With that foundation in place, here are some of the most widely used HR dashboard types in modern organizations.
Recruitment & Hiring Dashboard
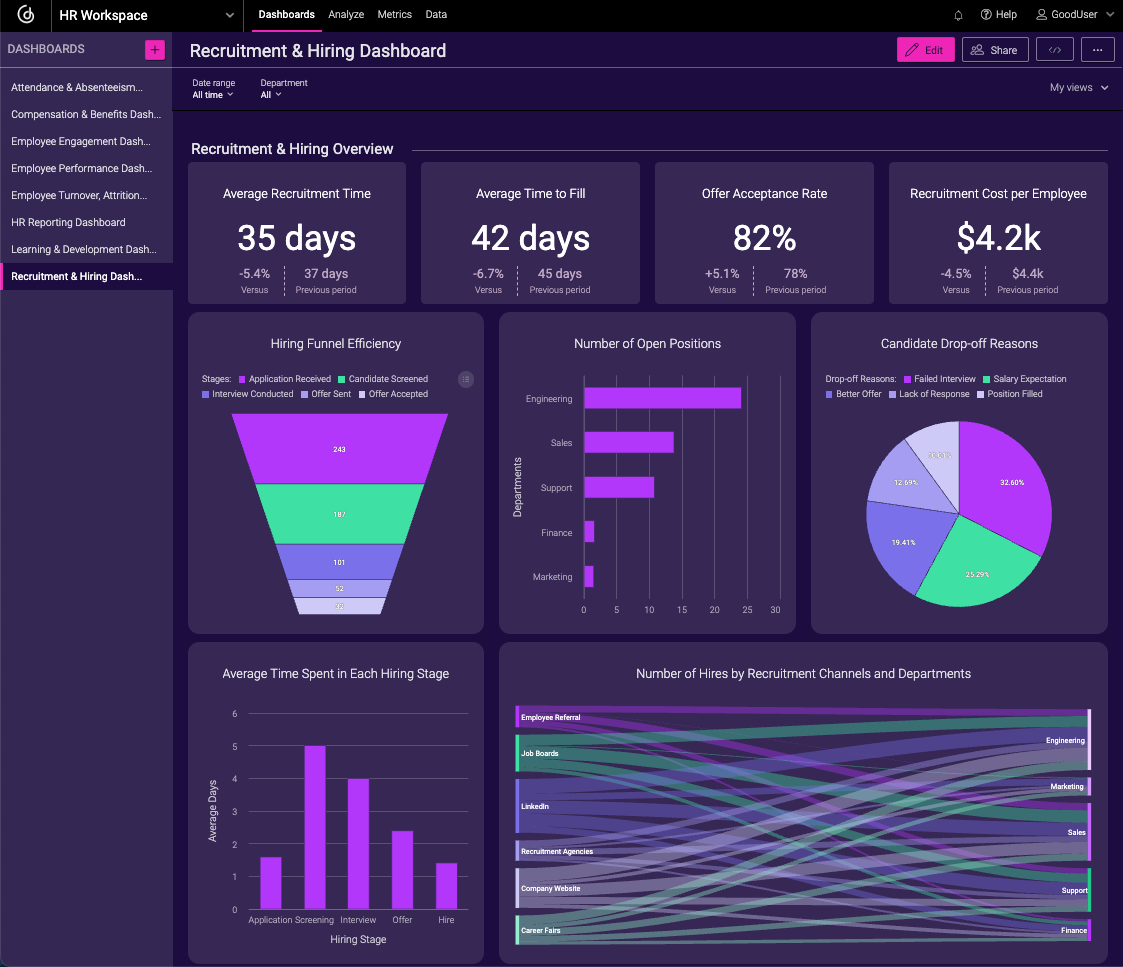
A recruitment dashboard provides real-time visibility into your talent acquisition process, helping to optimize hiring strategies and reduce the time it takes to fill positions. Effective hiring dashboards deliver tangible benefits like lower recruitment costs and improved candidate quality.
Key Performance Indicators on this type of dashboard include:
- Number of open positions helps HR teams manage recruitment workload, while average time to fill positions identifies efficiency in the hiring process.
- Average recruitment time tracks the entire hiring lifecycle, and offer acceptance rate reveals how compelling your job offers are to candidates.
- Recruitment cost per employee quantifies the investment required to attract new talent, and hiring funnel efficiency shows conversion rates at each stage of the recruitment process — from application to offer acceptance.
A well-designed recruitment dashboard allows HR professionals to identify bottlenecks in the hiring process, evaluate the effectiveness of different recruitment channels, and adjust strategies to attract top talent more efficiently. Many organizations report significant benefits from using hiring dashboards, including a significant reduction in time-to-hire.
Recruitment & Hiring Dashboard
Employee Turnover, Attrition & Retention Dashboard
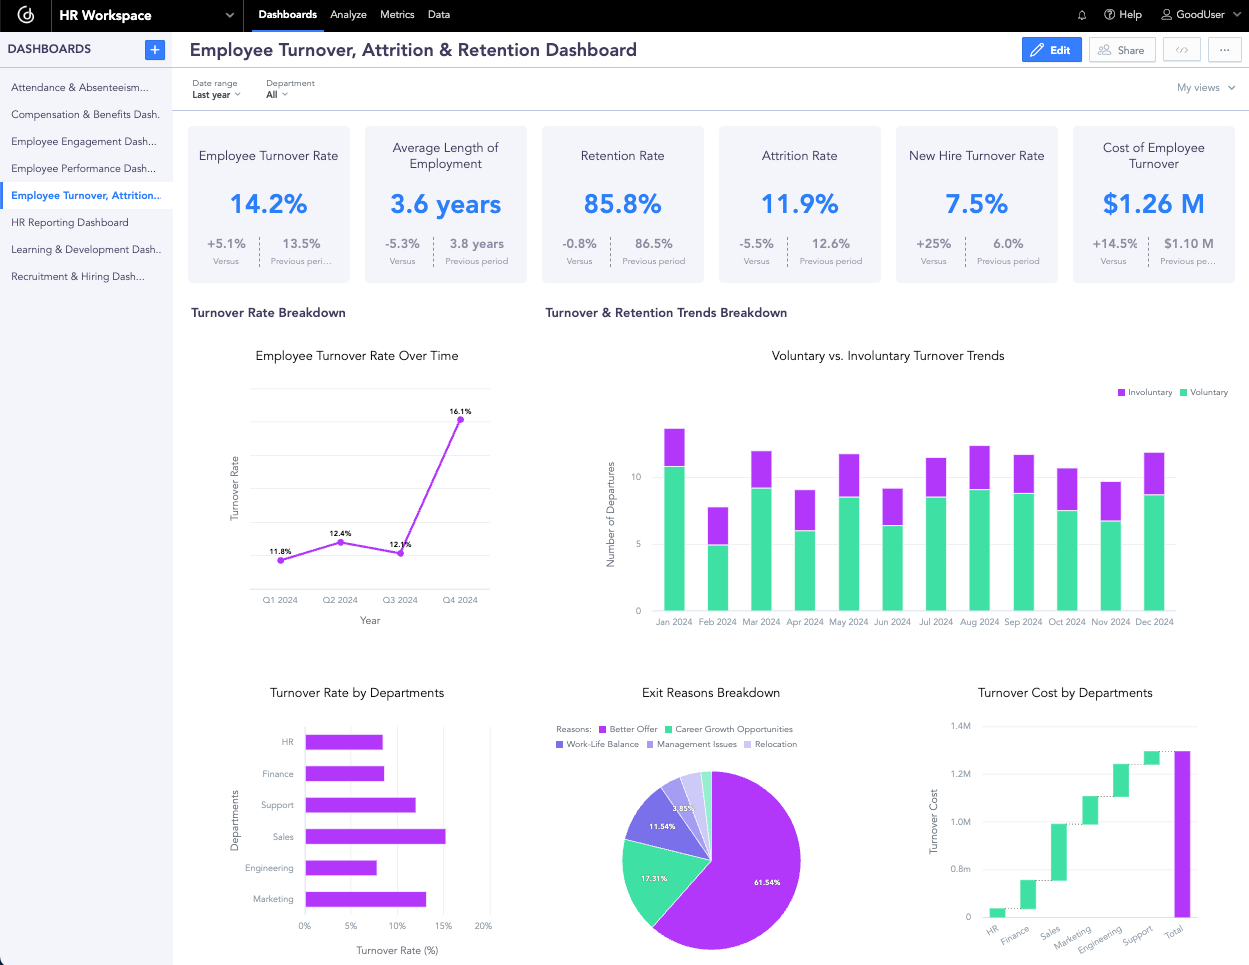
Understanding why employees leave is crucial for developing effective retention strategies. An attrition dashboard helps HR teams monitor turnover patterns and implement targeted interventions. The benefits of tracking turnover metrics include improved workforce stability and reduced replacement costs.
Employee turnover rate distinguishes between voluntary departures and terminations, providing insight into whether employees leave by choice or due to performance issues. The average length of employment indicates workforce stability, while retention rate measures your success in keeping employees over specific time periods. Attrition rate tracks the percentage of employees leaving, and new hire turnover rate monitors early departures — a key indicator of recruitment effectiveness and onboarding quality. The cost of employee turnover quantifies the financial impact of replacing employees, including recruitment, training, and productivity losses.
Employee Turnover, Attrition & Retention Dashboard
Employee Performance Dashboard
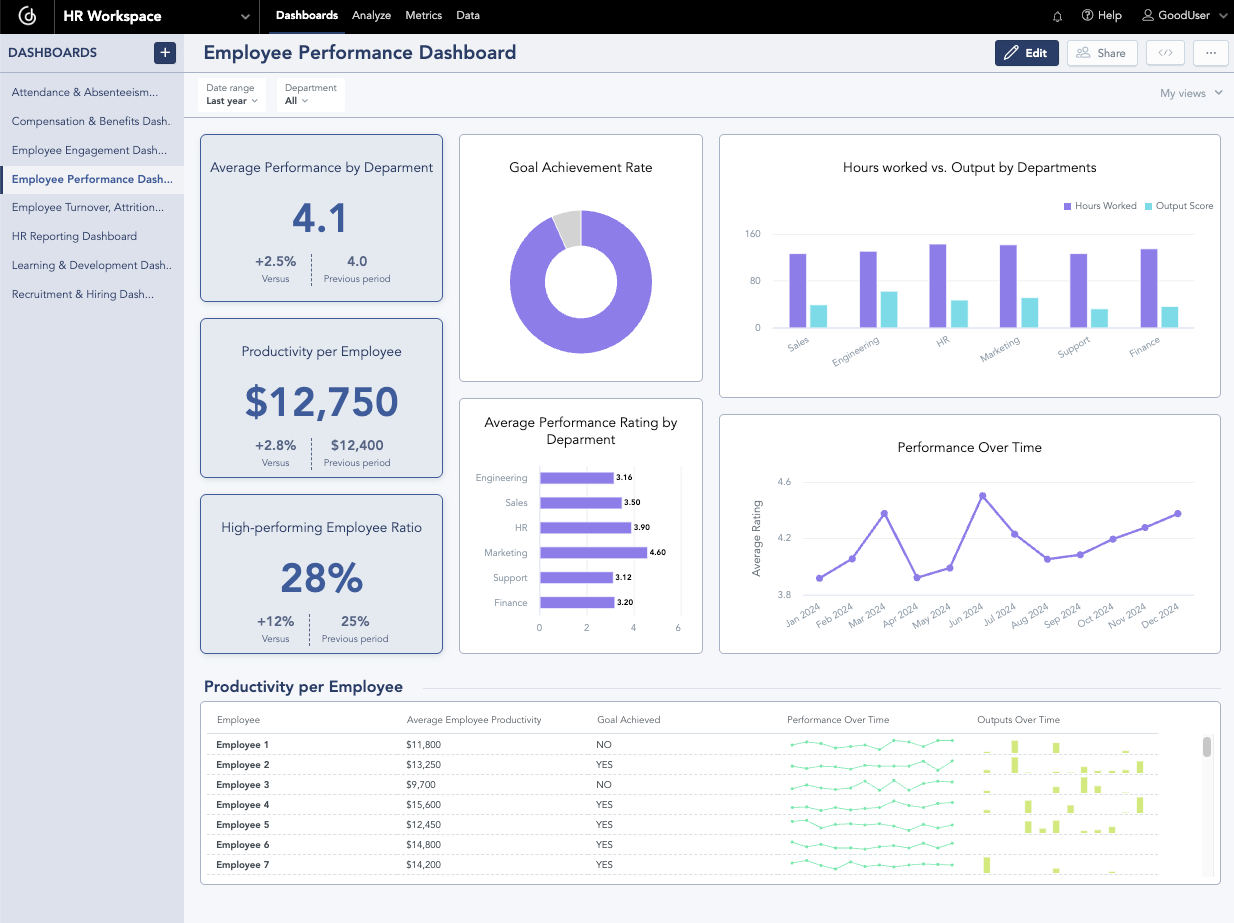
Performance dashboards help managers and HR professionals track individual and team productivity. Regular reporting on performance metrics brings benefits at every level of the organization.
These dashboards enable objective performance reviews, identify top performers, and help create targeted development plans for employees who may be struggling. Automated reporting on performance metrics saves managers time and provides more consistent evaluation standards.
Employee Performance Dashboard
Employee Engagement Dashboard
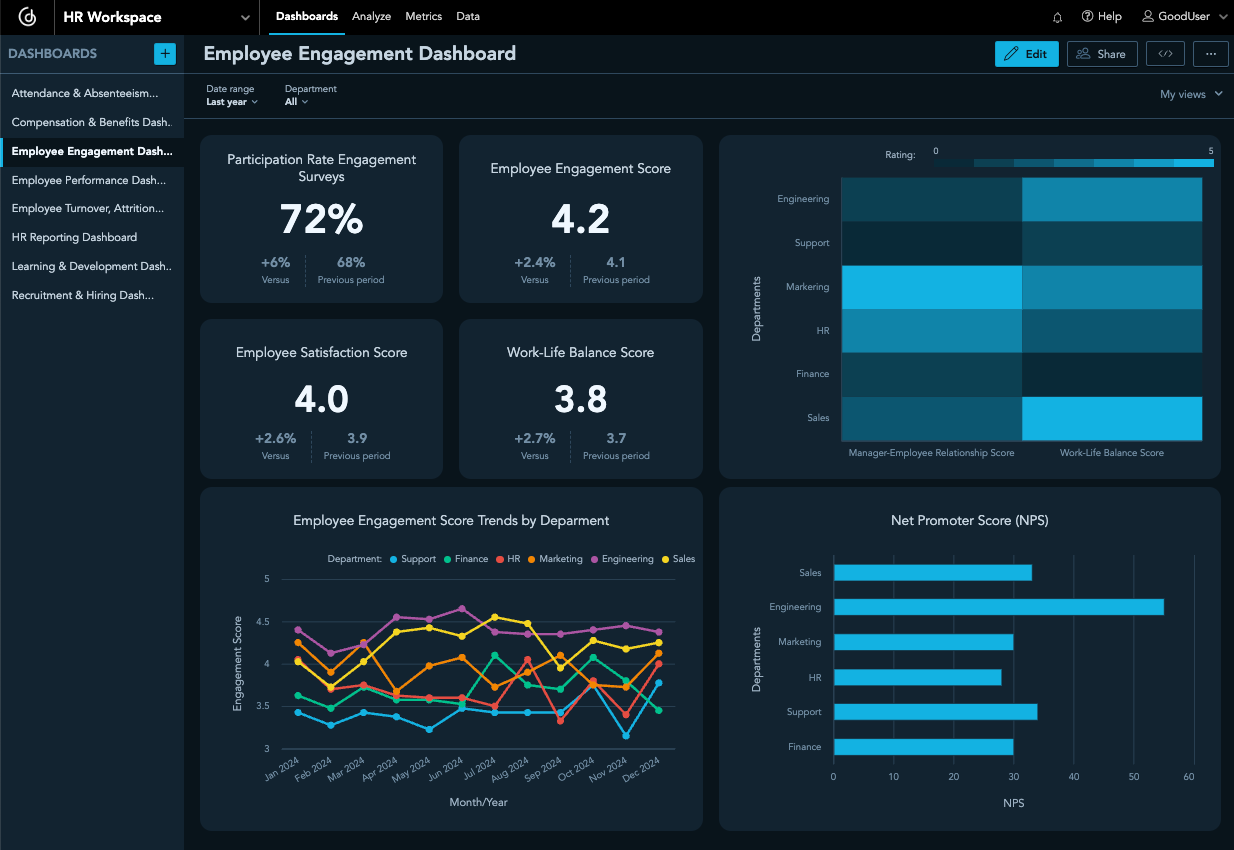
Engagement dashboards provide insights into workforce satisfaction and morale, helping organizations build a positive company culture. The benefits of monitoring engagement include improved retention, higher productivity, and stronger employer branding.
Key Performance Indicators on this type of dashboard include:
- Employee engagement score to measure how connected the workforce are to the organization.
- Participation rate in engagement surveys shows how accurately your data represents the overall employee population.
- Employee satisfaction score indicates how happy people are with the work environment.
- Net Promoter Score (NPS) shows how likely employees are to recommend your company as a place to work.
- Manager-employee relationship scores highlight the quality of leadership interactions.
- Work-life balance scores identify potential burnout risks and areas where flexibility initiatives may be needed.
Keeping an eye on these metrics helps HR teams step in before low engagement starts to hurt productivity or causes higher turnover. Companies using engagement dashboards often see big improvements in retention, thanks to catching and addressing issues earlier.
Employee Engagement Dashboard
Learning & Development Dashboard
Learning and development dashboards help track the effectiveness of training programs and how they help employees grow their skills and advance in their careers. They also make it easier for companies to see what’s working so they can get the most out of their training budgets.
Key Performance Indicators on this type of dashboard include:
- Training participation rate shows employee interest in professional development opportunities.
- Training completion rate shows how engaging and effective the programs really are.
- Employee skills improvement highlights whether the training is helping people grow in their roles
- Training hours per employee shows how much you are investing in developing your workforce.
- Return on investment (ROI) in training helps you understand the payoff: how improved skills translate into better performance and results.
- Internal promotion shows how well you’re growing talent from within instead of always hiring from the outside.
These dashboards help HR professionals justify training budgets, identify skill gaps, and ensure that development programs are aligned with organizational needs. Comprehensive reporting on training effectiveness helps secure continued investment in employee development.
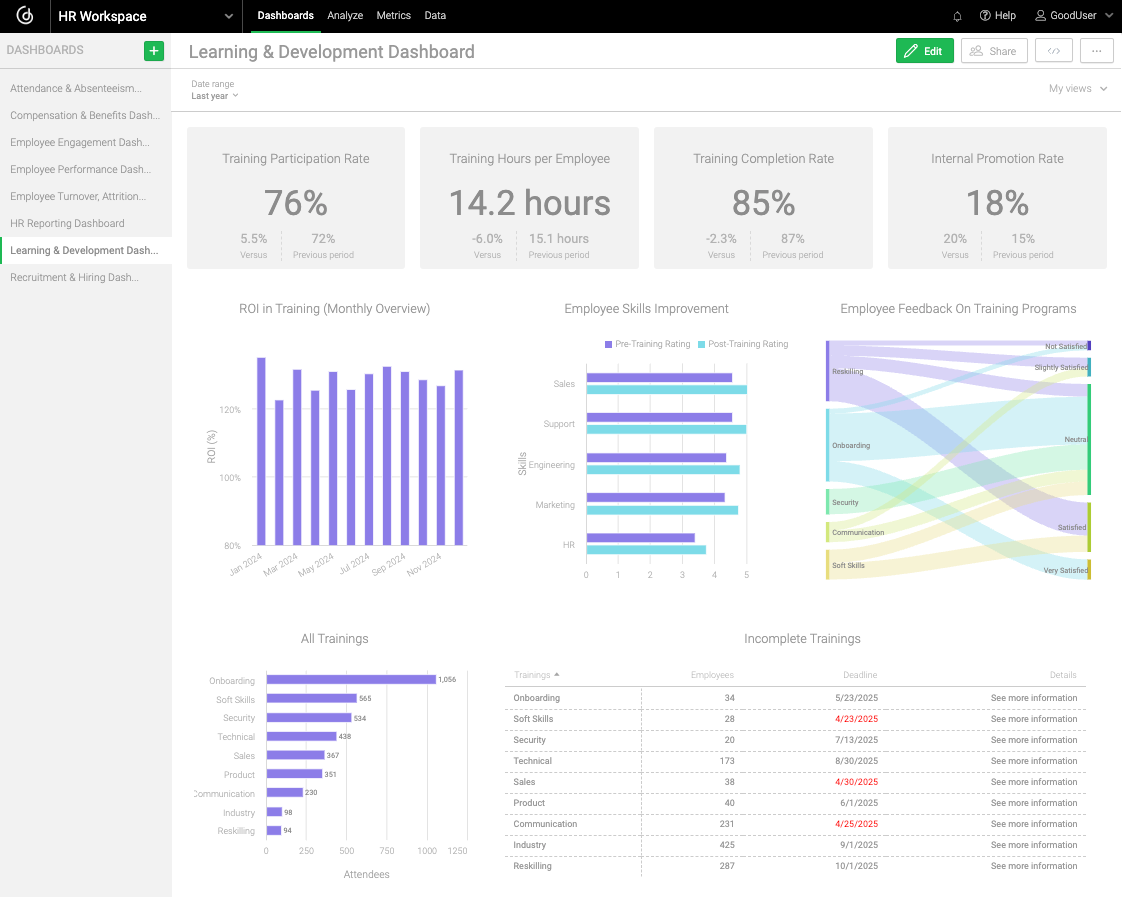
Learning & Development Dashboard
Attendance & Absenteeism Dashboard
Attendance dashboards give you a clear view of employee presence and patterns, making it easier to spot issues — like disengagement — before they start impacting productivity. They’re a great way to catch and address concerns early."
By tracking metrics such as average employee attendance or reasons for absenteeism, HR teams can identify worrying patterns, ensure compliance with labor laws, and implement wellness programs to reduce unnecessary absences. Attendance dashboards often reveal connections between absenteeism and turnover, allowing for more targeted retention efforts.
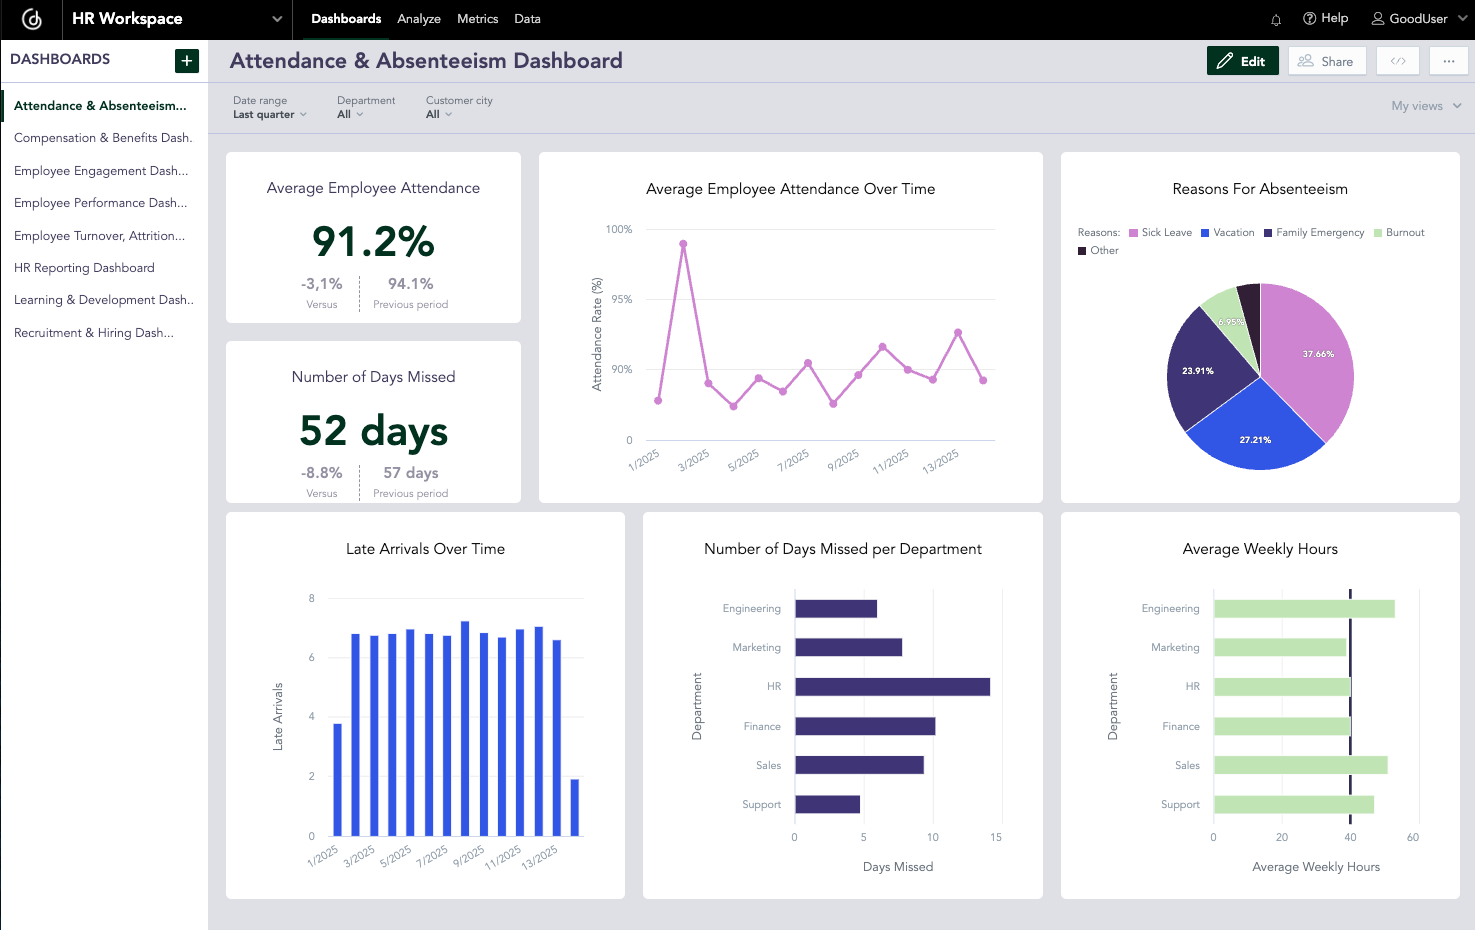
Attendance & Absenteeism Dashboard
Compensation & Benefits Dashboard
Compensation dashboards help ensure fair pay practices and optimize the company's benefits offerings. The benefits of compensation analytics include improved budget planning and more strategic rewards programs.
Key Performance Indicators on this dashboard include:
- Average compensation per employee benchmarks the overall salary structure.
- Compensation-to-revenue ratio ensures payroll costs remain sustainable.
- Employee benefits utilization rate reveals which offerings employees value most.
- Bonus payouts vs. targets helps assess the effectiveness of incentive programs.
- Average compensation by department or position ensures internal equity.
- Salary-to-market ratio keeps your compensation competitive with industry standards.
- The retention impact of benefits measurement shows which programs most effectively contribute to employee loyalty.
These insights enable HR teams to design competitive compensation packages, ensure internal equity, and measure the effectiveness of benefits programs in attracting and retaining talent. Effective compensation dashboards can identify correlations between compensation levels and engagement scores, allowing for more strategic rewards planning.
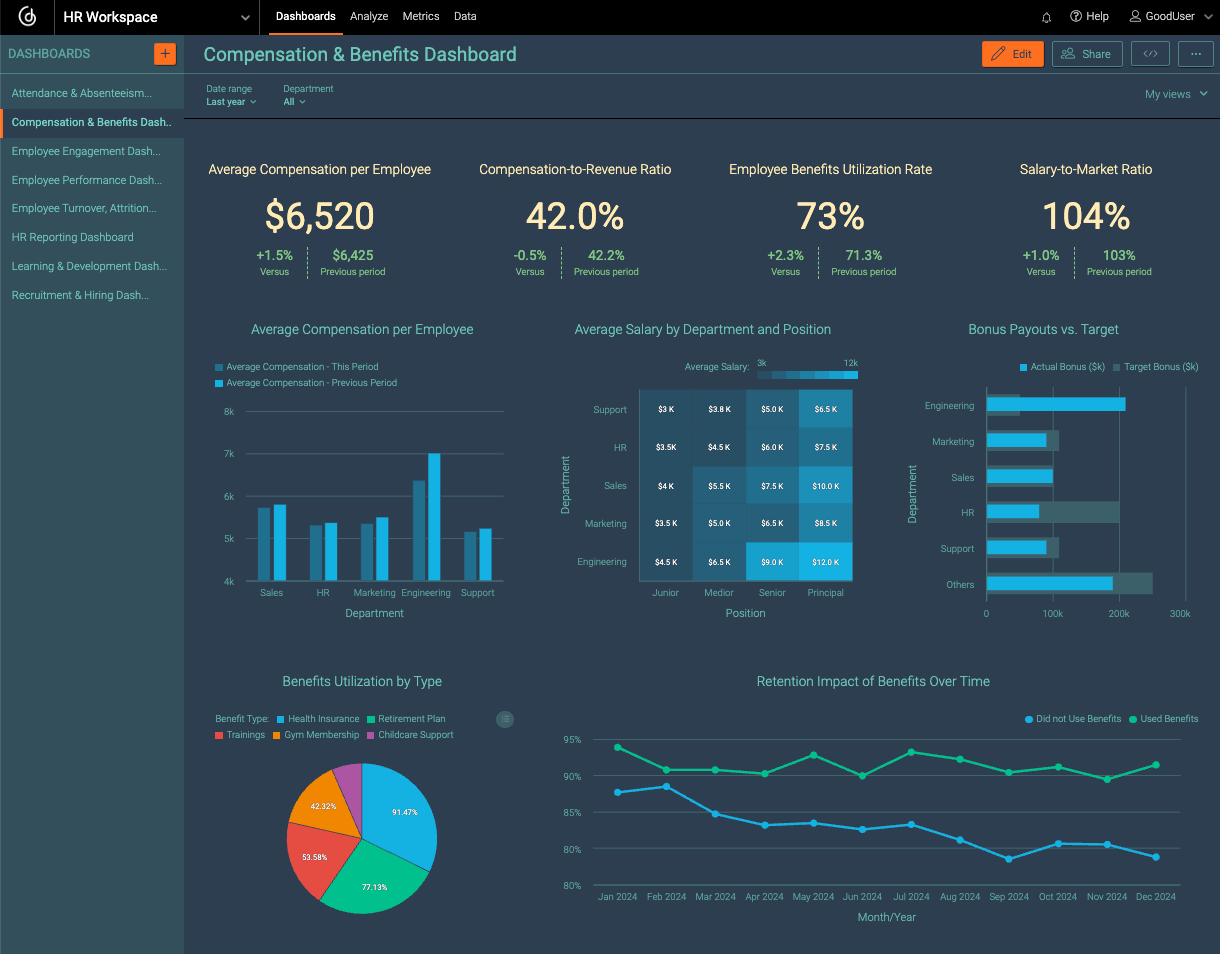
Compensation & Benefits Dashboard
HR Reporting Dashboard
A comprehensive HR reporting dashboard is typically updated monthly or quarterly to provide leadership with an overview of key workforce metrics. Centralized HR reporting benefits include improved strategic decision-making and better alignment between HR initiatives and business outcomes.
This executive-level dashboard works with KPIs such as total number of employees, net employee growth, average time to fill, attrition rate, total employee cost, and employee satisfaction rate. It facilitates strategic workforce planning and helps leadership understand how HR metrics impact business outcomes. Regular reporting on these key metrics helps leadership stay on top of workforce trends and challenges.
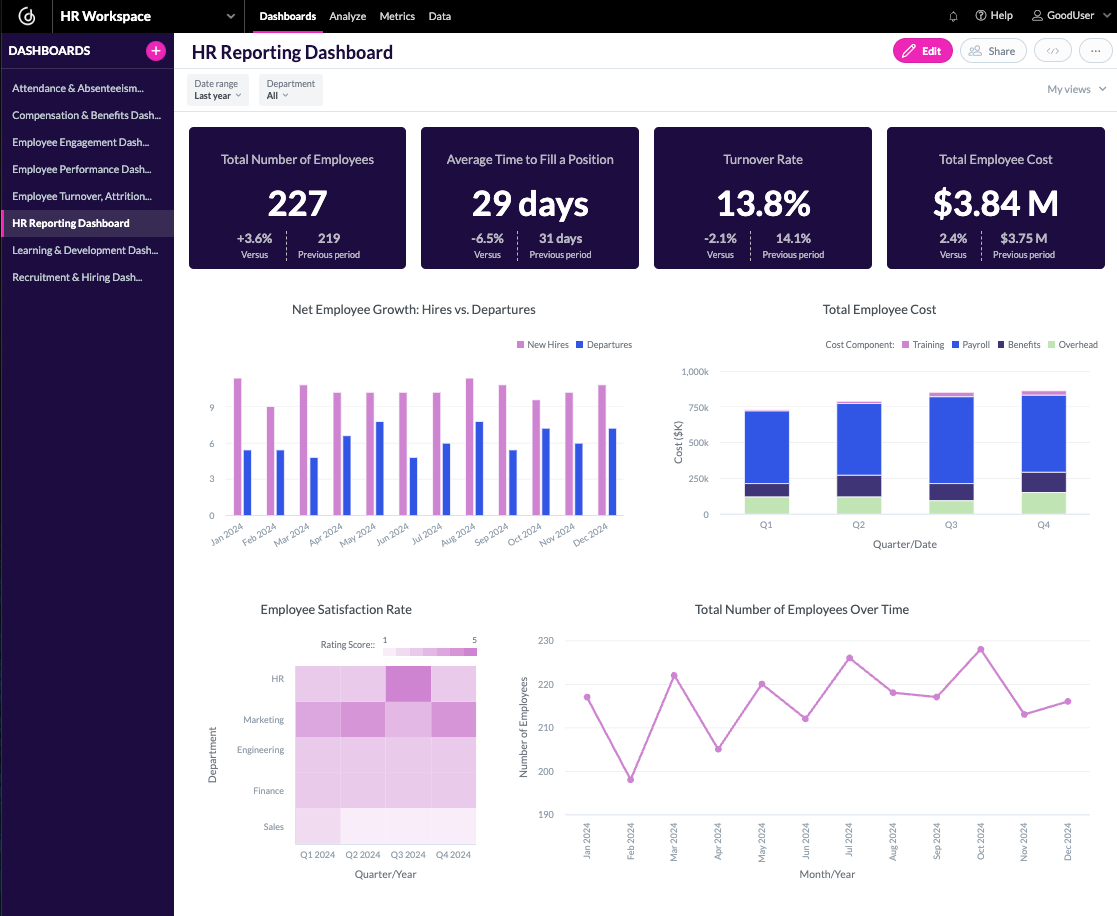
HR Reporting Dashboard
Create Your HR Dashboards with GoodData
GoodData’s intuitive analytics platform makes it easy to build dashboards like the ones in this article, serving businesses of all sizes, from small businesses to large enterprises. But while dashboards and drag-and-drop tools are essential, they’re only part of the equation. A modern BI tool ought to provide advanced features like data modeling, scalability, automation, AI capabilities, rich embedding options, and seamless integration with your existing tech stack. Check out the 11 must-have features of a modern BI tool for more on this.
Alternatively, feel free to browse our customer stories to see how real businesses are leveraging GoodData to build scalable, high-performance analytics solutions tailored to their needs. Or schedule a demo to learn how our platform can optimize your operations with a comprehensive, future-proof BI approach.
FAQs About HR Dashboards
A strong recruitment dashboard delivers real-time insight into application pipelines, hiring funnel performance, and cost efficiency. It helps identify bottlenecks, and allows teams to refine sourcing strategies and fill key roles faster.
Attendance dashboards provide visibility into patterns of absenteeism and lateness. By tracking these metrics over time, HR teams can detect trends early and address burnout, spot scheduling conflicts, or allocate resources more wisely.
By visualizing average pay, benefits-to-revenue ratios, and related stats, HR leaders can ensure equitable budget planning and monitor pay structure health—paving the way for fair compensation practices.
Tracking variables like training hours per employee and training-related ROI helps HR leaders understand the impact of development programs. This insight supports smarter investments in talent growth and internal mobility.
Real-time visualization allows HR teams to respond immediately to evolving workforce dynamics, whether that’s changes in hiring pace, attendance spikes, or compensation shifts. This enables proactive rather than reactive strategies.


