Healthcare Dashboard Examples: Different Use Cases and Their Benefits
3 min read | Published

Summary
In healthcare, timely access to the right information can improve outcomes, reduce delays, and enhance coordination. Dashboards make this possible by transforming complex data into clear insights that support fast, confident decisions. This article explores how dashboards are used across healthcare organizations and includes several practical examples that show how they contribute to better care and greater efficiency.
Introducing the Three Main Types of Healthcare Dashboards
There are three primary types of dashboards in healthcare: clinical, operational, and financial. From improving patient care to enhancing management, these dashboards use data and analytics to provide health and MedTech organizations with valuable benefits.
Building healthcare dashboards requires an analytics solution that can handle complex data, ensuring these organizations have the insights they need. Predictive analytics can also play a key role in anticipating trends and improving outcomes. With this in mind, let's look at the three main dashboard types in more detail.
Clinical Dashboards
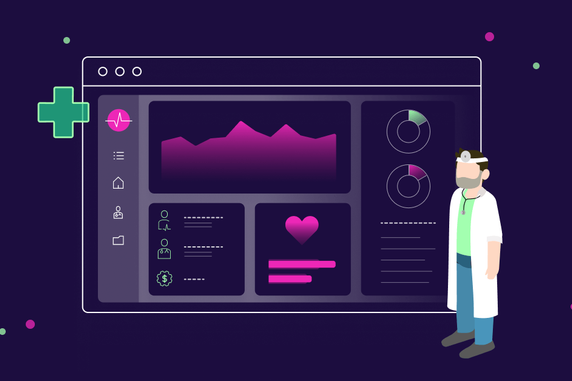
Clinical dashboards provide invaluable benefits by offering a comprehensive view of treatment outcomes, infection monitoring, and patient data. They serve as essential tools in tracking metrics and KPIs that drive quality care and ensure optimal performance.
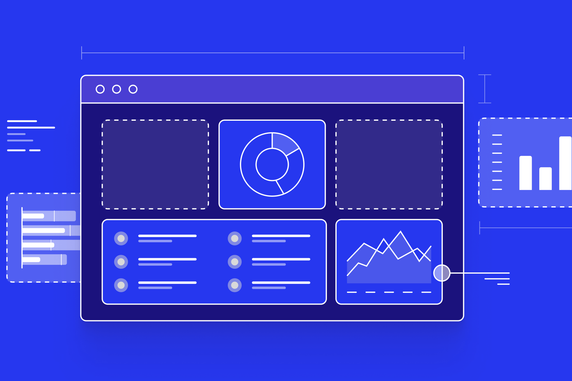
One widely used type is a patient dashboard, which tracks recovery rates, readmissions, and mortality rates, giving healthcare providers a real-time snapshot of clinical effectiveness. Common KPIs here include average length of stay, readmission rate, patient satisfaction scores, and mortality rate.

Patient outcomes dashboard (click the image to enlarge)
Another prevalent hospital dashboard is the infection control dashboard, which helps facilities maintain safe environments by closely monitoring infection rates within the hospital. This allows healthcare staff to track essential metrics like hospital-acquired infection (HAI) rates, antibiotic usage, and infection source tracking, ensuring proactive infection management.

Infection control dashboard (click the image to enlarge)
Other examples of clinical dashboards include an emergency department dashboard, which uses real-time analytics to manage patient flow and outcomes in emergency settings. Meanwhile, a chronic disease management dashboard focuses on the management of chronic conditions like diabetes or heart disease, helping track patient adherence to treatment plans and health outcomes. KPIs could include patient adherence rates, appointment attendance rates, and disease-specific health outcomes (e.g., HbA1c levels for diabetes).
Operational Dashboards
Operational dashboards are often used to track hospital efficiency, resource utilization, and wait times. A hospital operations dashboard monitors key operational metrics for hospital management, covering everything from patient flow to resource availability and capacity. KPIs might include bed occupancy rate, average patient discharge time, surgery cancellations, and staffing levels.

Hospital Operations Dashboard (click the image to enlarge)
Other examples of operational dashboards include staff performance and supply chain management, which typically rely on various data visualizations to display insights. A staff performance dashboard provides insights into employee productivity and efficiency. Metrics might include staff-to-patient ratio, number of appointments, average time per procedure, overtime hours, and training completion rates. A supply chain management dashboard tracks inventory and supply chain efficiency, helping healthcare organizations avoid stockouts and reduce costs. Important KPIs could include inventory levels, supply turnover rate, and supplier lead time.
Financial dashboards
Financial dashboards in healthcare provide executive and management teams with critical insights into the financial health of their organizations, helping them monitor the cost of care, manage revenue cycles, and maintain healthy cashflow. By leveraging data and analytics through these financial dashboards, healthcare organizations can achieve greater financial transparency, optimize resource allocation, and support strategic financial planning.
One of the most widely used examples of dashboards in healthcare is the revenue cycle management dashboard. This helps healthcare organizations track the efficiency of their revenue cycle, from billing to collection. Key KPIs include accounts receivable days, claim denial rate, patient billing turnaround time, and collection rates, providing a comprehensive view of the revenue flow.

Revenue cycle management dashboard (click the image to enlarge)
Another essential financial dashboard is the cost of care dashboard, which offers insights into per-patient costs and highlights areas where cost reductions are possible. Key metrics in this dashboard may include cost per patient, overhead costs, cost per procedure, and expenses for medications and supplies.

Cost of care dashboard (click the image to enlarge)
Other examples of financial dashboards include resource utilization and patient billing. A resource utilization dashboard tracks the use of resources — such as personnel, equipment, and facilities — with important metrics like staffing costs per shift and equipment usage rates. Meanwhile, a patient billing dashboard allows finance departments to monitor patient payments, outstanding balances, and trends in billing issues. KPIs here include outstanding balances, average patient payment time, patient payment rate, and insurance reimbursements.
Create Your Own Healthcare Dashboards With GoodData
GoodData’s intuitive software makes it easy to create healthcare dashboards like the examples in this article. Transform complex data into actionable insights with custom reporting tools that improve patient care and operational efficiency. Check out our healthcare customer stories for real-life examples, or schedule a demo to discover how GoodData can revolutionize your analytics architecture.
Real-time dashboards display live data on vital signs, bed availability, and infection rates. Immediate visibility enables faster interventions and helps prevent complications before they escalate.
Important clinical metrics include readmission rate, average length of stay, infection occurrence, and patient satisfaction scores. These KPIs reflect care quality and highlight areas for improvement.
Yes. Financial dashboards track revenue cycle, billing efficiency, claim status, and cost per patient. This visibility supports budget planning, waste reduction, and financial stability.
Predictive analytics enables trend forecasting such as patient admission volumes or infection spikes. This helps teams prepare for upcoming demands and optimize staffing or resource usage.
Clinicians, administrators, financial teams, and executives all gain value. Dashboards help clinicians focus on patient needs while supporting operational efficiency and strategic decision-making.
An effective dashboard needs reliable data integration across clinical and operational systems, intuitive visualizations, and performance governance to maintain accuracy and trust.