Embedded Analytics: An Alternative to Power BI


We have created this article series to help evaluators of data analytics vendors choose the most suitable solution for their particular use case: with a specific focus on the differences between GoodData and Power BI. In the first article, we introduced the general differences in the ways both platforms approach the world of data analytics. In this article, we will cover the key areas that you should consider when choosing between these two solutions to best meet your embedded and distributed data analytics use case.
What Is Embedded and Distributed Analytics?
Embedded and distributed analytics is about providing data analytics access to stakeholders outside of your company: These stakeholders could include your customers, suppliers, or business partners (and such like). To give you an example, you might be a provider of a platform for customer support management that enables clients to analyze the number of calls or tickets agents attend to each day. Another example could be a destination management company providing their clients -— tourist centers — access to visit, lodging, or payment data useful for the travel industry. The goal of distributing analytics is typically to improve customer retention, provide additional value, and/or monetize data.
If embedding and distributing analytics is not what you’re hoping to accomplish with BI, and instead, you want to know more about building a custom data analytics app with benchmarking, you may wish to skip to the next article directly.
Analytics Right at The Point of Work
How you make analytics available to end-users will make or break the potential success of your data analytics project. You could choose to share static PDF files with a selected audience or give them access to a standalone web portal with data analytics, however, the recommended way by which to distribute data analytics is by embedding it into your existing website, portal, or product. The incorporation of analytics in this way, as part of your users’ workflow, will increase their productivity, increase security by eliminating multiple-login management, and add value to your product.
Embedded Analytics use case: GoodData vs Power BI
While embedding should be a must-have for any company wanting to provide a seamless analytics experience for their users, Power BI sees embedding as being recommended for app developers to use against a shared set of data. This approach, however, defeats the purpose of embedding and inhibits the full potential it can bring. Moreover, white labeling and styling options which, as evidenced in our prospective-customer testimonials, are the major enablers of an embedded use case along with SSO, are limited in Power BI. The limitation of these features means aligning the look and feel of the data analytics solution with your company branding is very much restricted.
GoodData, on the other hand, has been specifically built with embedded and distributed data analytics use cases in mind. With embedding options including no-code embedding via iframe and low-code embedding via developer-friendly JavaScript components, it can easily be integrated into your product once and accessed by your end-users at any time. Its modern, responsive, and highly customizable UI allows you to completely align the look and feel of GoodData and your product.
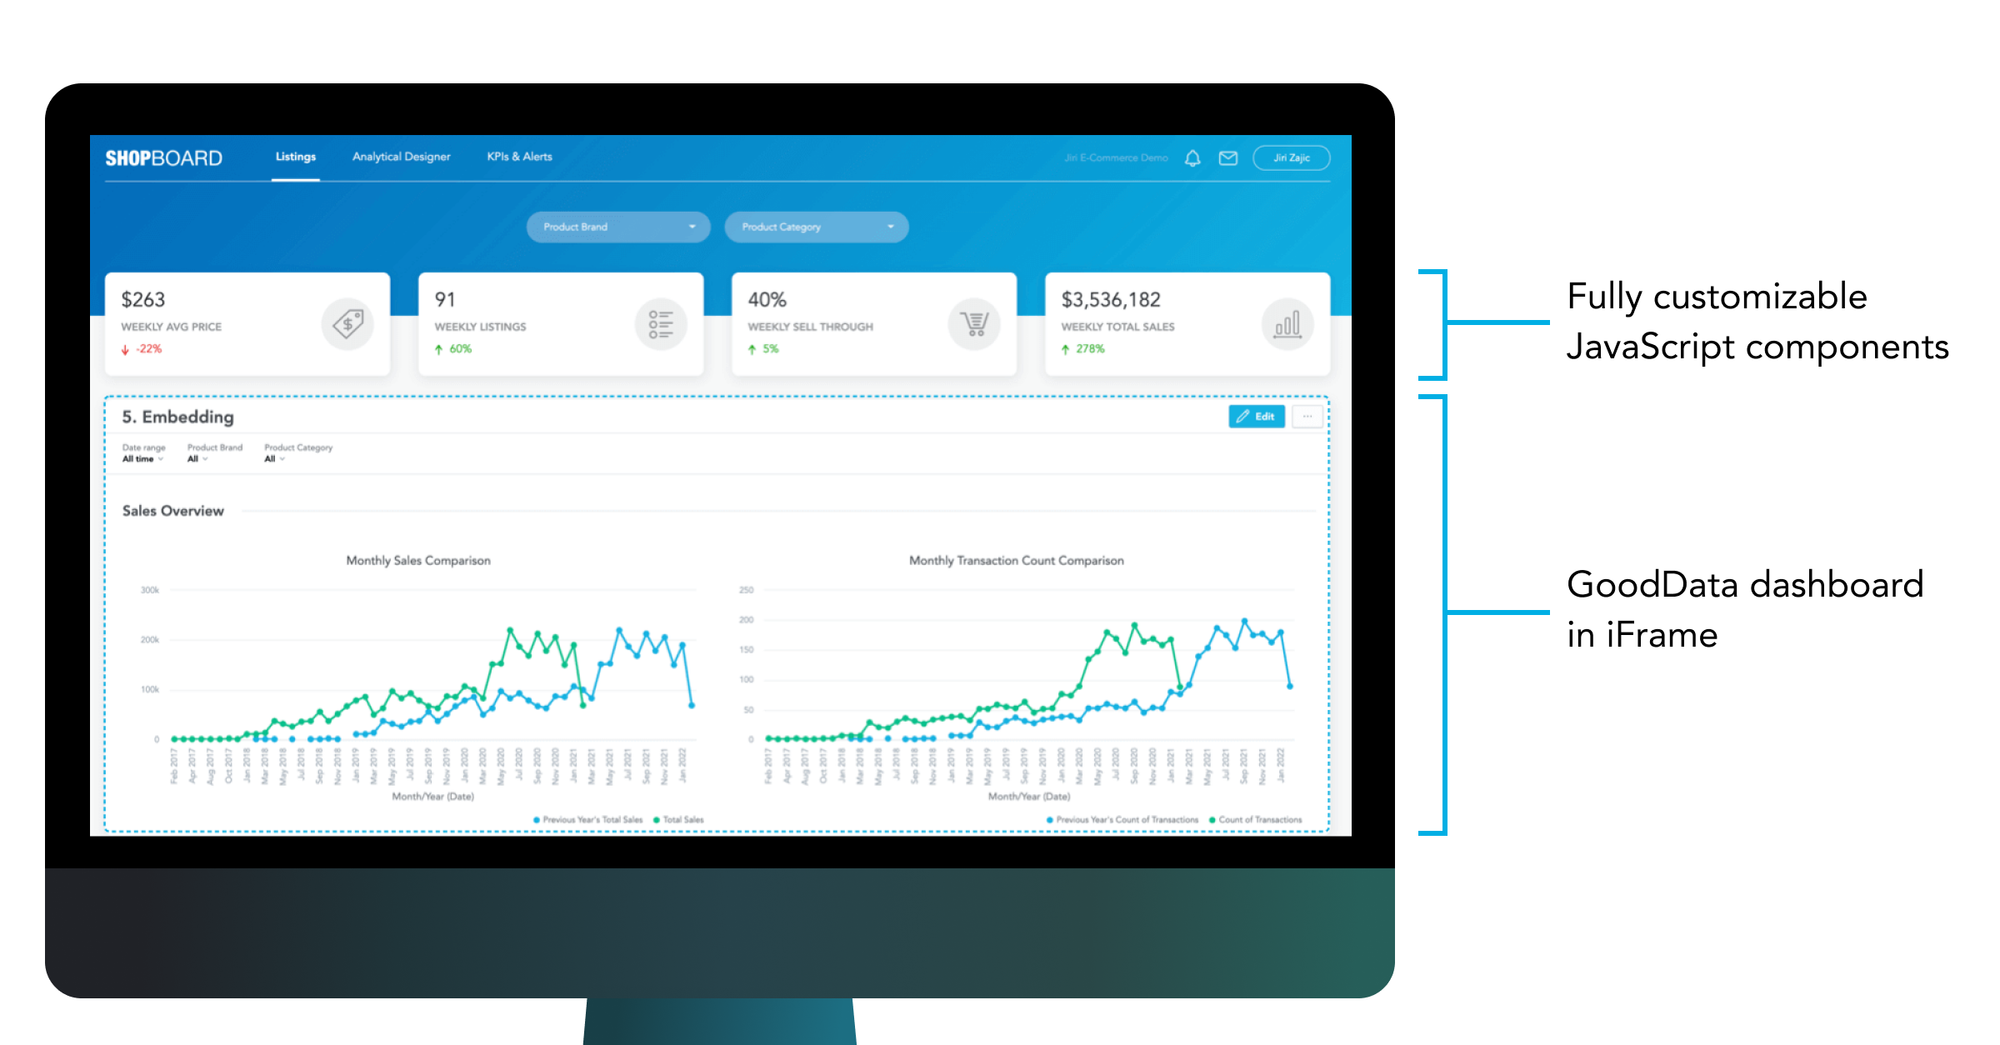
Embedding: A GoodData dashboard in a white-labeled e-commerce app
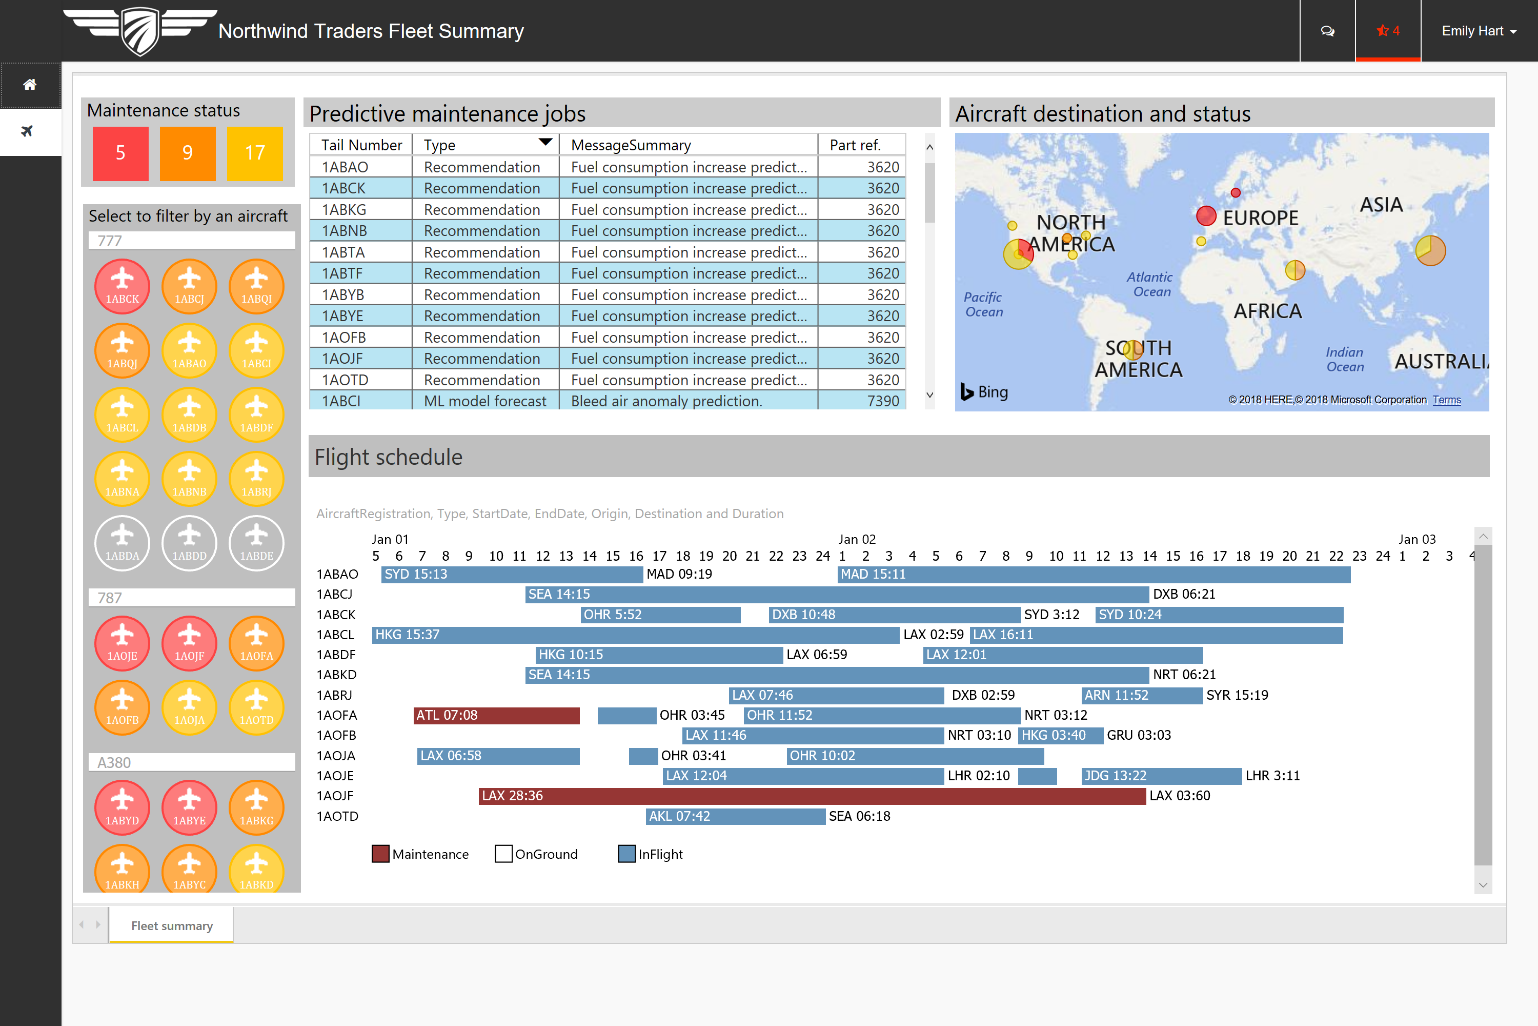
Embedding: Power BI Embedded*
*Source: Microsoft Corporation, "Power BI Embedded in action", G2.com, [26 November, 2021] https://www.g2.com/products/microsoft-power-bi-embedded/reviews. The screenshots used are for identification purposes only and remain the property of Microsoft Corporation. No affiliation or endorsement is implied.
Self-Service Data Analytics
Giving your end-users access to self-service functionalities is a key element in ensuring the success of your data analytics application, especially if your use case involves 1,000s of end-users with differing needs. What does it entail? Enabling easy data exploration and dashboard creation in such a way that the end-user needn’t work with the ETL or underlying databases, develop code, or consult a BI analyst every time they need to define a new metric. In order to achieve this, your solution needs to have at its disposal a strong semantic layer with an underlying query language, thus allowing you to easily compose and reuse existing metrics.
Underlying Query Language: GoodData vs Power BI
This is where MAQL, GoodData’s proprietary query language used for composable and reusable analytics queries, comes into play. With a set of predefined functions, you can use it for simple queries such as aggregations or complex statistical analyses such as skewness or kurtosis. Among its key advantages are context awareness, reusability of metrics, and simplification of multi-dimensional analysis. Speaking in technical terms, the GoodData platform distinguishes between the way data is stored in the database, and the way data objects relate to each other. The definition of relationships made by your data scientists on top of the semantic model, which has primary keys defined, is what is used in queries. In short, this means that you don’t need to write complicated joins and remember in which dataset an attribute or fact lives. Non-technical users don’t require extensive training and technical expertise to use GoodData dashboards but instead, they are able to immediately use pre-existing metrics to create their own, ad-hoc reports, reuse existing metrics, or create new metrics themselves.
This ability to easily compose and reuse metrics is thanks to the MAQL metrics’ context awareness. This is due to the fact that they are sliced by dimension context, eliminating the need to be specified in the MAQL expressions themselves, but instead specified by report and dashboard filters applied to them. The main benefits this reusability brings are the facilitation of self-service analytics for end-users — via the provision of an intuitive drag-and-drop interface for the creation of new data visualizations — and minimal discrepancies in reporting. On top of that, it allows you to approach BI in a headless manner, meaning that end-users can view consistent data results regardless of the visualization layer they use (these can include other BI tools, data science notebooks, etc).
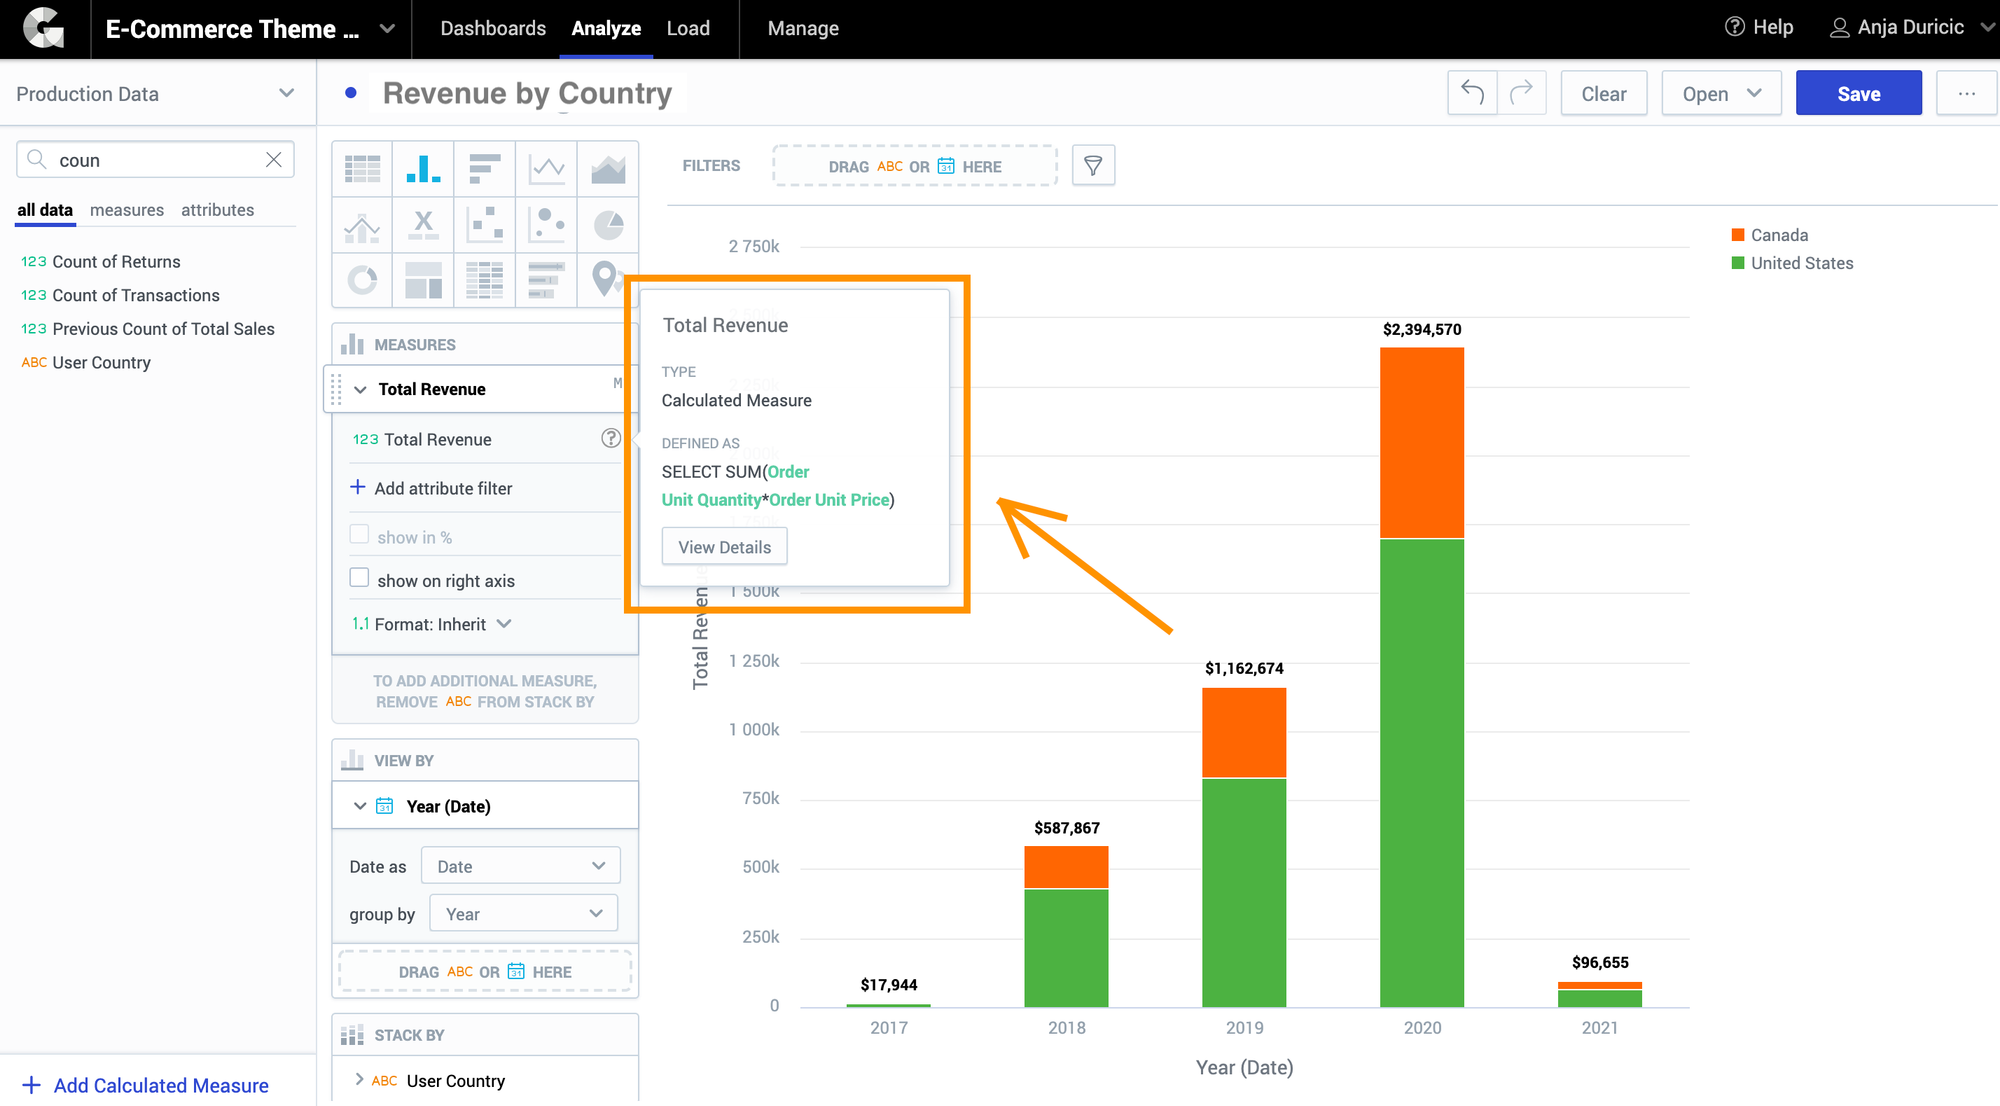
GoodData’s self-service analytics
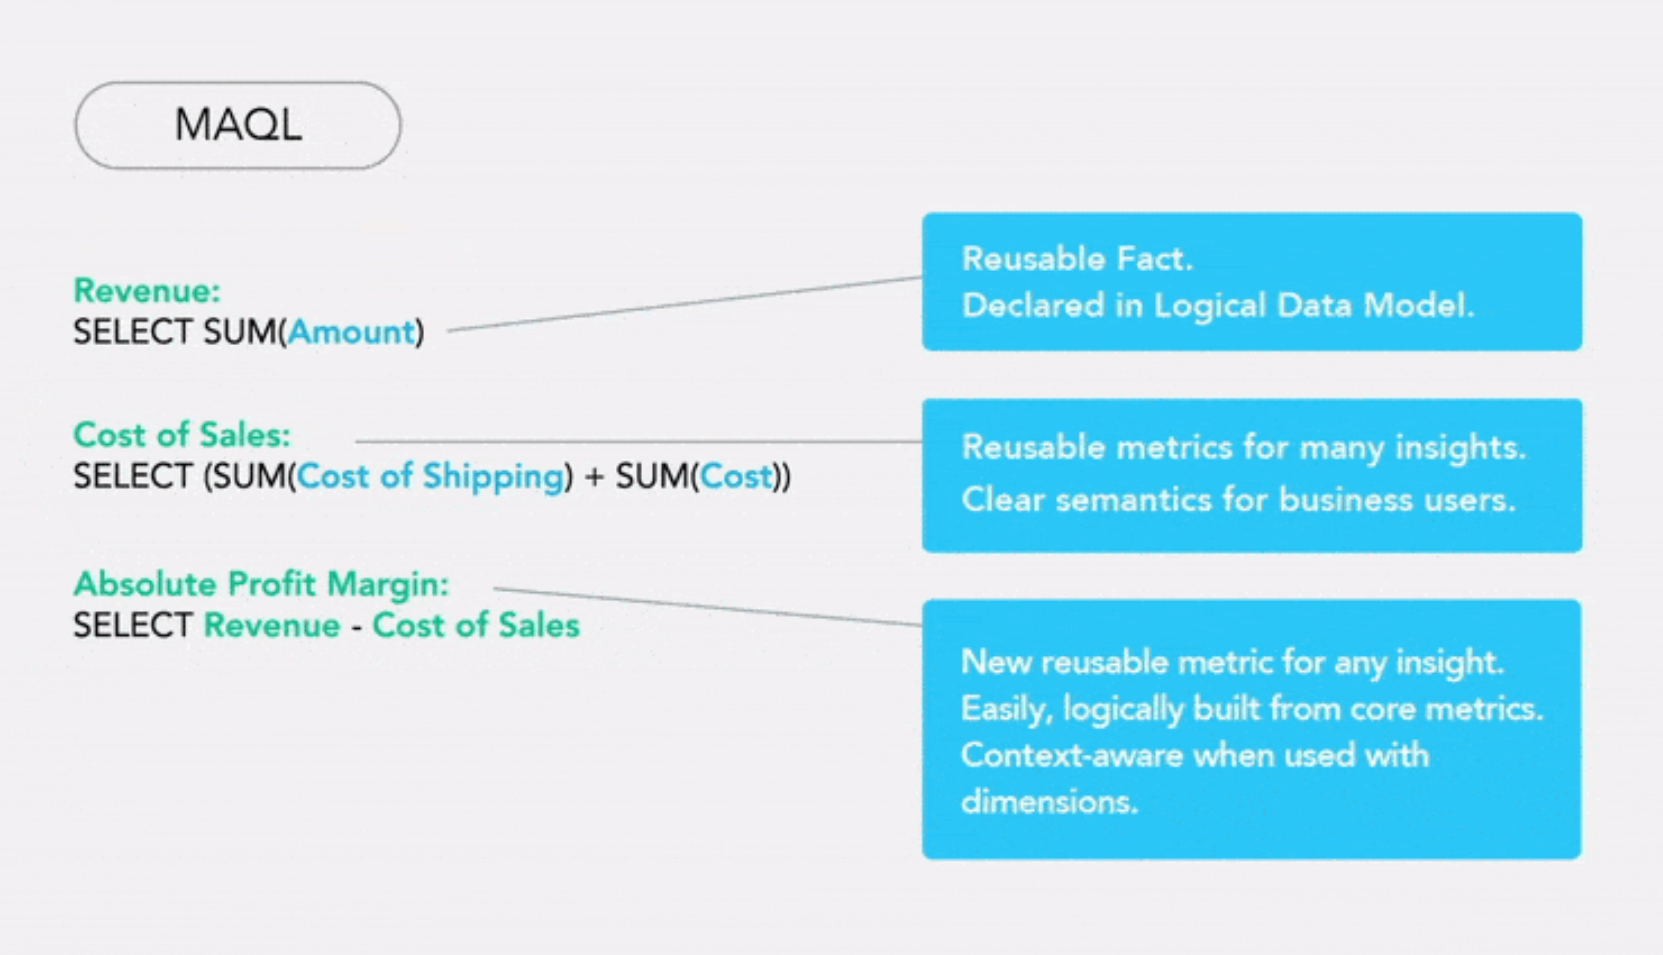
GoodData’s MAQL metrics broken down
Microsoft’s DAX — designed to query multi-dimensional data stored in tabular in-memory models — will allow you to explore data in other Microsoft platforms like Power Pivot for Excel, Microsoft Analysis Services, or SSAS Tabular. For a technical user, mastering DAX may take some time as it requires pieces of code to be written. Moreover, depending on your use case and the audience, DAX can interfere with the added value that the self-service functionalities offer. Adding DAX to dashboards can add a layer of complexity as it requires users who want to do anything more than just consume dashboards to be familiar with the language. As found in Power BI’s documentation, access to self-service functionalities should be limited due to dataset and report limitations and management of customized reports which defeat the purpose of self-service functionalities. If you are writing DAX, and are the only person using such a dashboard, or are sharing it among your technical colleagues only, the issues outlined here may not prove to be a bottleneck for you. However, your business users may find such a dashboard cryptic in nature and the manipulation of it to be complicated.
Experience GoodData in Action
Fully managed, embedded analytics platform. Get instant access — no installation or credit card required.
Explore product toursEfficient Scalability to Tens or Even Thousands of User Groups
The ability to scale is among the top questions asked by our prospective customers when they enter the evaluation stage. You can think of scalability in relation to the following four areas:
- Number of user groups (located in “workspaces”)
- Number of users
- Amount of data
- Price
Architecture and Pricing: GoodData vs Power BI
The architecture and pricing policy of Power BI Embedded poses some substantial limitations to small to mid-market companies. Based on our research and client feedback, Power BI Embedded charges per node type chosen and the number of deployed nodes, and can significantly increase the price of the data analytics platform beyond initial expectations. This creates an incentive to save money by giving access to analytics to fewer users thus constricting decision-making to the hands of only a few only. If your use case is internal, this could also result in the reduced usage of analytics company-wide and, as such, will hinder your efforts at becoming a truly data-driven organization.
GoodData, on the contrary, is designed to support not only enterprise-scale use cases but also growing companies by not limiting the performance, capacity, or number of users. Instead, it offers features that can be easily layered as you go and provides transparent and predictable pricing based on three main pillars: number of workspaces, data volume, and optional, add-on features.
Data Modeling: The Key to Powerful and Reliable Analytics
The first step you’ll need to take before you start distributing analytics is defining your user groups. A user group, returning to the examples given above, would be your support center customer or a tourist agency. Imagine that every group will require access to different analytical outputs: not only different dashboards but also different underlying data and different Logical Data Models (LDM), a crucial component of a worthy analytical solution.
The LDM, the part of the semantic layer that represents underlying data in business terms, describes the structure of the data you want to query, and the relationships between different entities. If you expect to make the most of your data, organizing them into random structures and connections will be insufficient. Instead, your engineers will need a deep understanding of your user group’s structure and business objectives to create a perfectly fitting data model for each group. Such an LDM, aligned with the user group’s goals, will allow for easy data exploration and data-driven decision-making.
Data Modeling: GoodData vs Power BI
GoodData’s powerful LDM represents relationships and joins between the data sets and other objects for a given user group, coming from various data sources. You can understand this type of LDM as a contract between the data loading process and the data warehouse, and between the data warehouse and the analytical queries. As such, the LDM in GoodData provides a layer of abstraction between the information the GoodData user is accessing and the method by which the data is stored. This allows BI engineers to continuously improve and adjust the existing LDM without interfering with the user’s definition of the data architecture.
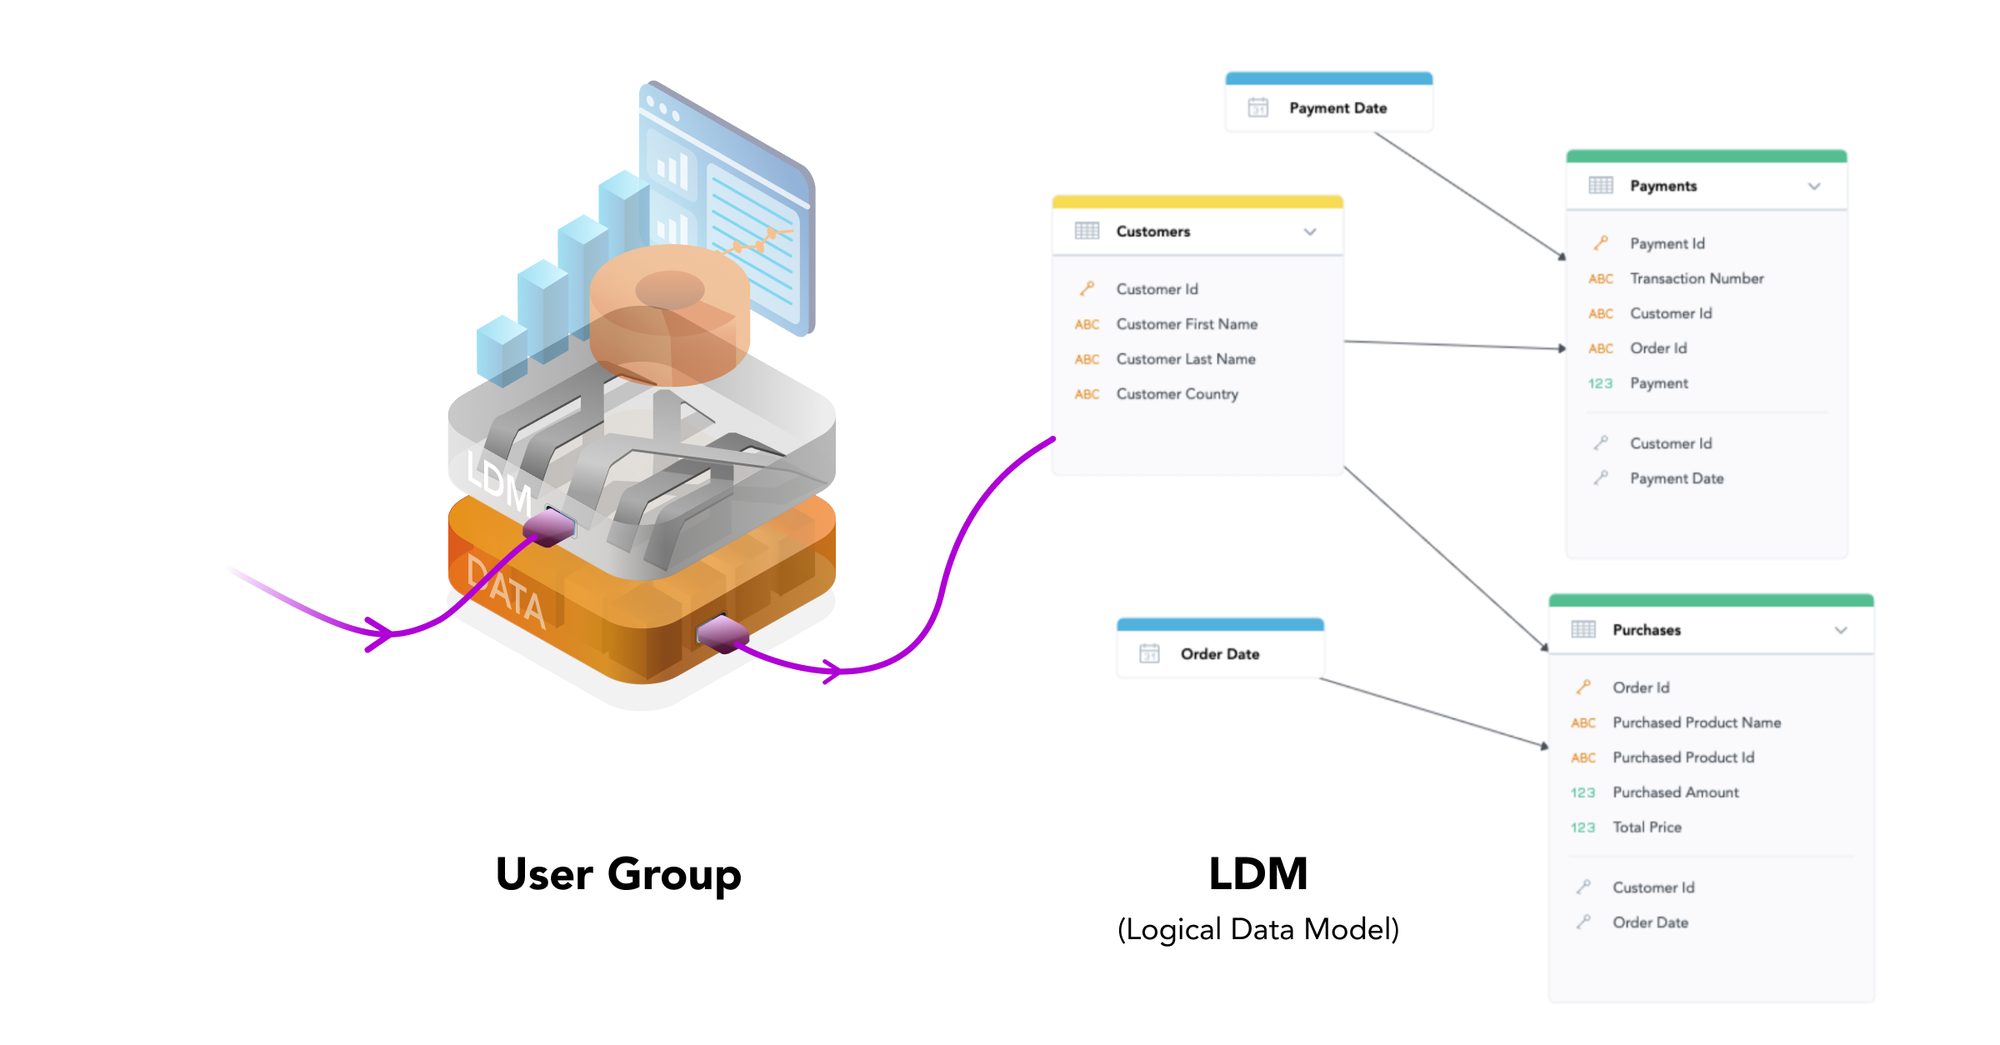
Data modeling in GoodData
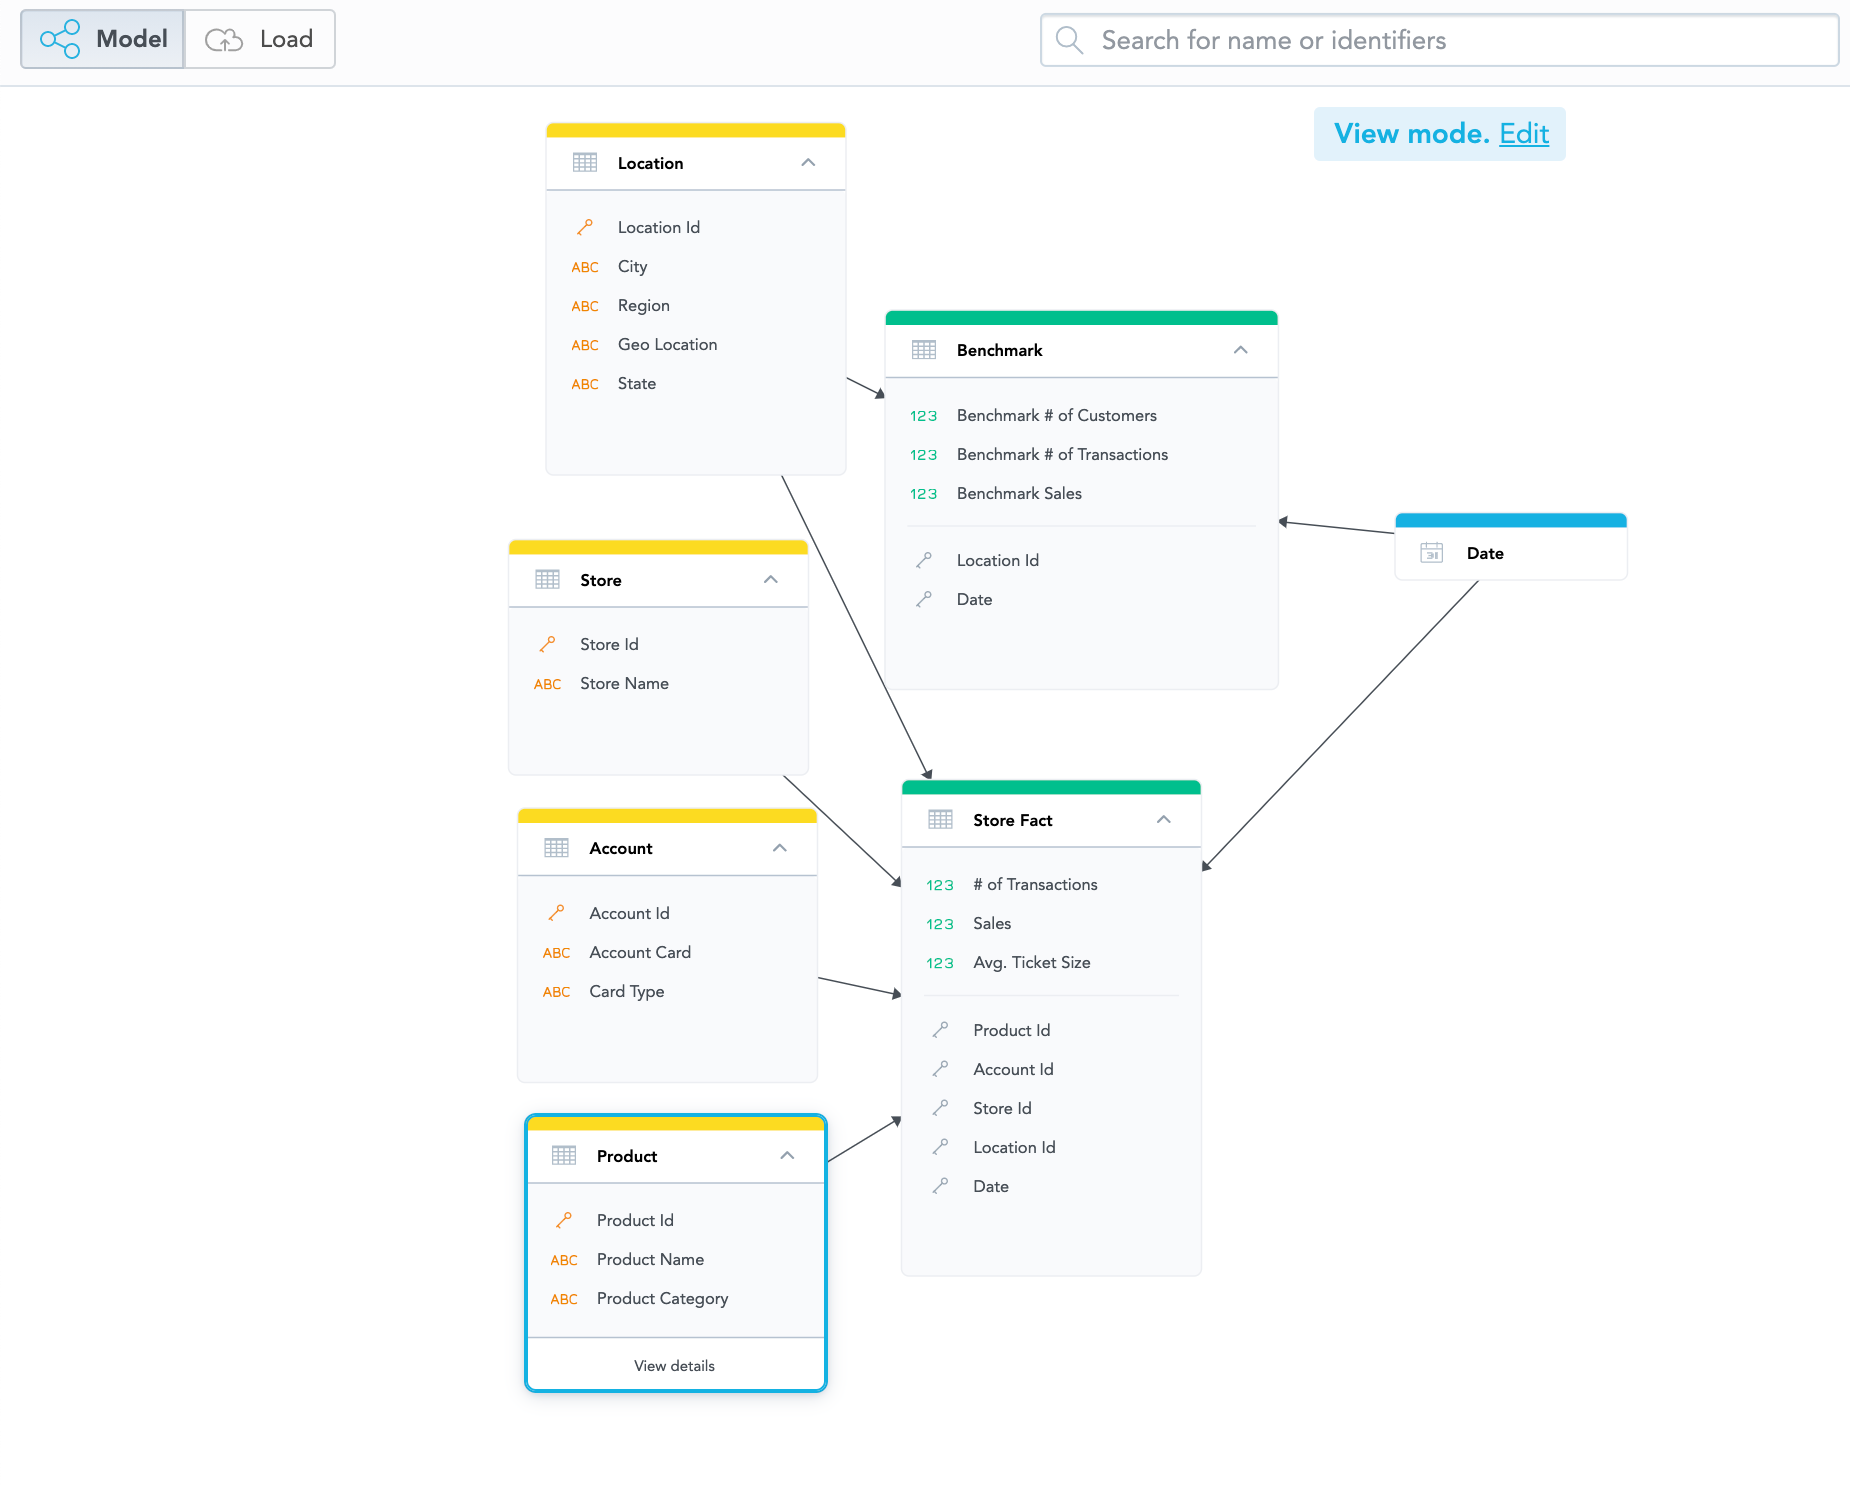
Data modeling in GoodData in a modern, user-friendly interface
Data modeling in Power BI also promises to deliver data from multiple sources that is ready to use. However, our customers pointed to a couple of drawbacks when testing both solutions. Power Pivot, an in-memory data modeling component that claims to provide analysis of large amounts of data, turns out to be insufficient when handling complex use cases. It seems that it is too rigid when needing to handle complicated relationships between tables in an LDM. Moreover, if your data scientists need to make an adjustment to the existing data model and proceed to refresh it, Power BI turns your data model into a single huge table. GoodData, on the other hand, enables adjustments to be made at any time; in order to reflect the company’s development and objectives. The existence of objects and joints in GoodData makes data modeling straightforward and provides better and more stable performance of the analytical queries. Although Power Pivot can be used as an add-on to Microsoft Excel in addition to Power BI, it’s best utilized for less complex use cases.
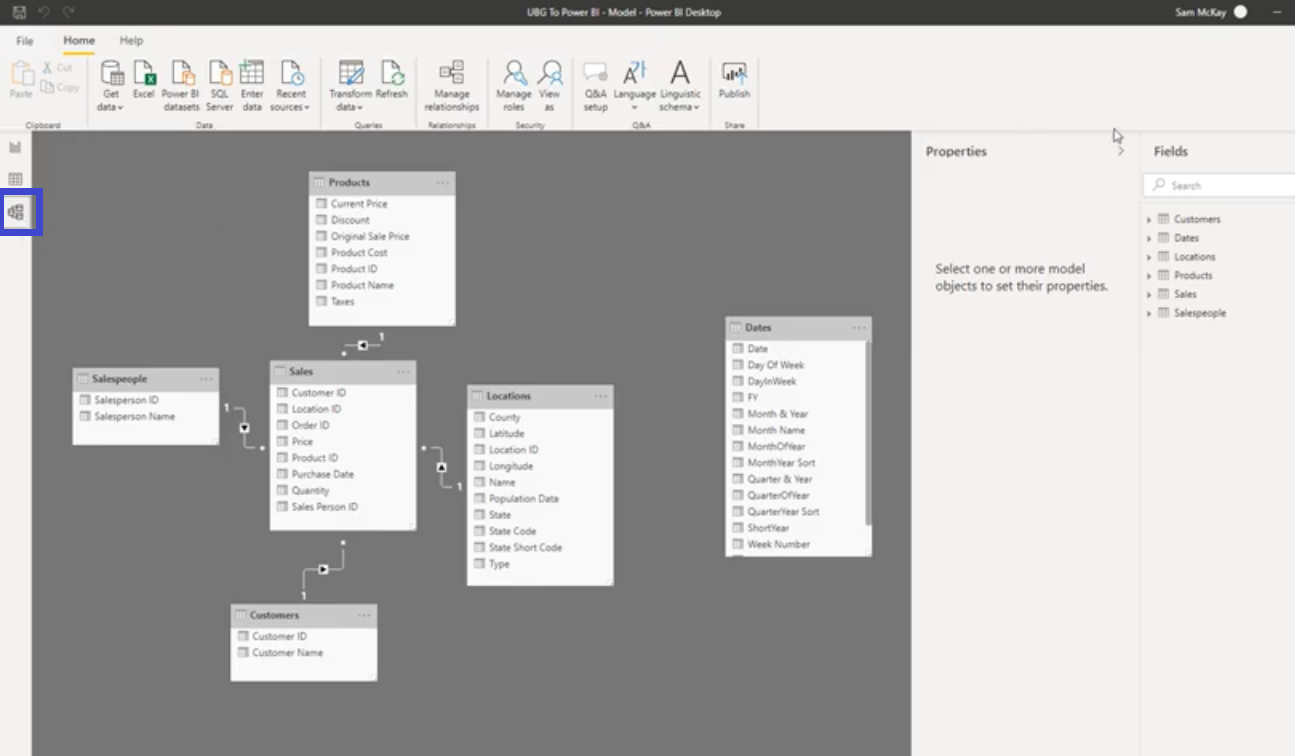
Data modeling in Power BI*
*Source: Microsoft Corporation, "Data Modelling In Power BI", community.powerbi.com, [26 November, 2021] https://community.powerbi.com/t5/Community-Blog/Data-Modelling-In-Power-BI-Helpful-Tips-amp-Best-Practices/ba-p/1977956. The screenshots used are for identification purposes only and remain the property of Microsoft Corporation. No affiliation or endorsement is implied.
Bonus Capability: Efficient Governance and Version Control
One of the biggest obstacles to scaling data analytics efficiently is ensuring strong governance and version control of your solution. This entails establishing:
- Efficient and reliable management of all your customers
- Full control over users, roles, data permissions, and security
- Efficient and automated management of complex analytics components
- Clear visibility on analytics usage, adoption, and security
- A unified release process for analytics and your product
Since available automation tools will have an impact on your developers’ ability to manage the analytics solution as smoothly and efficiently as possible, you’ll likely want to explore the automation capabilities of the platform you select to ensure efficient version control of your data analytics.
Operating Change Management: GoodData vs Power BI
Power BI offers automation only for a single-tenant solution, stating that managing many artifacts at scale can be too complex. Power BI only offers an automated copy of a single report for multiple tenants via dynamic binding, omitting the remaining aspects of strong governance. Instead, Power BI advises introducing workspace retention policies for user-specific content to manage the content’s flow and deletion when necessary.
This is unlike GoodData, which offers unique and strong governance capabilities and version control through its lifecycle management (LCM) functionality. A reusable solution to operating change management for multiple customer segments in a secure manner should be one of the main pillars of embedded and distributed analytics. It ensures your data analytics is provisioned, versioned, and released to production in an automated way. When it comes to the management of workspaces and their updates — a unit in which a user group is located — you can easily create copies of workspaces containing the same metadata (dashboards, LDM, etc.) while displaying data specific to that particular user group. Meaning that end users will still be able to create their own metrics, custom visualizations, and so on, but without breaking the dashboards that were provided to them via LCM. In addition, LCM can also be used for automated provisioning and de-provisioning of individual end-users and user groups, making the management of new and old customers safe and secure.
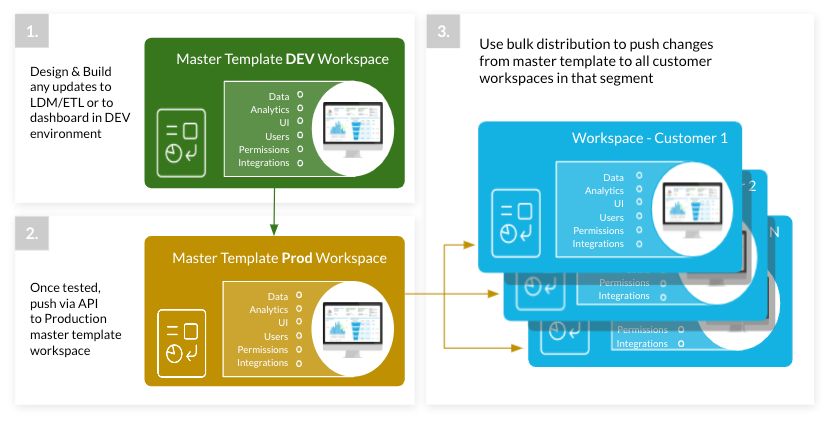
Lifecycle management diagram
Want To Know More?
In this article, we covered the differences between GoodData and Power BI in key areas related to a distributed and embedded use case. As our research and customer testimonials show, although a robust solution, Power BI has specific features, functionality, and price limitations when it comes to efficiently distributing and embedding data analytics at a large scale. If you’d like to continue reading, and learn more about how the two platforms compare when it comes to building your own custom analytical app with benchmarking, continue reading here!
Ready To Try GoodData?
See for yourself how GoodData compares to Power BI and build a proof of concept with your own data sample. Register for the free GoodData trial and start building your first GoodData-powered insights, commitment-free. Or schedule a demo with GoodData experts who will walk you through all of the GoodData platform’s capabilities, and answer any questions you may have.
Experience GoodData in Action
Fully managed, embedded analytics platform. Get instant access — no installation or credit card required.
Explore product tours

