Building an Analytics Experience for Your Customers in a SaaS Product
6 min read | Published

You Have the Data Your Users Need
If you’re a product manager in the SaaS space, we don’t need to tell you the importance of a good data analytics experience. Data is already your bread and butter. You need it to provide the insights that help you perform continuous delivery, design, user research, and prioritization.
But if you're a part of a team that builds SaaS products — even if you’re not specifically building a data product — it’s important to remember how important analytics is to your customers.
SaaS products, like any other product, are typically designed to do one particular job and to do it very well. No matter the audience or vertical that they target, most SaaS products aim to serve one or maybe two specific user needs. And regardless of their product type, they are collecting tons of data.
Your end users likely need and want access to their data, as it tells them important information about the problem they’re trying to solve, or the goal they’re trying to achieve with your tool. Sometimes this need is obvious, and it's a top priority as a feature of a SaaS product. Email marketing tools provide data that helps teams to perfect their funnels, and heatmap tools provide key data to help teams build better websites. Having access to the data gathered by the tool is non-negotiable for the end user.
However, sometimes the need for the data gathered by a SaaS product is not quite so clear. This is particularly true for products that teams are only supposed to use internally, such as HR tools or project planning suites. Users may still need access to this data to measure their output/team performance. If there are any credible use cases for a data analytics experience within your product, it’s worth doing well.
Bring the Data to Your Users
More often than not, your users will have to export the data out of the product in order to manage and analyze it. This puts you at risk of losing your users to competitors who may have a less powerful tool than yours, but one that provides a better analytics experience. If a competitor is able to, for example, allow users to generate their own reports within the product, your product may feel incomplete in comparison.
It goes beyond the simple fact that the more users can do with your product, the more they’ll like it. Of course, when the ability to track, manage, and analyze data is included within the user experience of your product, users stay engaged with it. And this helps you to maintain your competitive advantage.
Being able to provide a more complete analytics experience gives you more opportunities to upsell. For example, you can provide freemium users with 50% of your analytics capabilities and leave the other 50% behind a paywall.
So, now you know the value of analytics, and you know the value of keeping your customers engaged and out of your competitors’ reach. The natural conclusion is to provide your users with a great data experience within your product.
Want to see what GoodData can do for you?
Get a guided tour and ask us about GoodData’s features, implementation, and pricing.
Request a demoProviding the Right Analytics Experience
Depending on how seriously you plan to bring an analytics experience to your users, you have the option of providing them with differing levels of analytical tools.
On the first level, you can provide simple reports and charts that you place on a relevant product screen. Although this effort looks like an easy engineering investment, connecting to the database and visualizing the graph with any JavaScript library on the market poses a big challenge for product management. You have to plan carefully which reports and charts are essential and valuable for all of your users, without cluttering your product experience with a slew of charts for any occasion. The scope of analytics usually leads to new change requests, either in the range of the data or the format. If your customer base is not homogeneous, you will have difficulty prioritizing which reports and charts to include.
Moving up a level can include bringing charts and reports into a dashboard experience. Your product engineering team can create dashboards according to the use case or the user persona, which allows for better personalization than just a simple chart for everyone. To narrow down the search, a user should apply filters within the dashboard, such as date or attribute filters. However, with dashboards, you will invest more effort due to the responsiveness of any device. And also, here, your users will likely seek different stories than the dashboard conveys, eventually ending at your support team’s desk with a change request.
Dashboard experience. Source: GoodData
The final stage is at the point where the analytics can extend the product use cases right to the point of work as a prompt for a decision, such as approving or denying a claim based on a specific measure. Here, instead of going to the dashboard to get acquainted with current numbers, the user sees the result directly within the step of the product user flow, simply as a simple number or help.
Finding the Right Solution
All of the approaches above bring a great analytical experience but pose a risk for the product teams — overloading them with customers’ requirements for additional reports or change of scope. Maintaining such an environment with custom queries for each of the customers is unmanageable for any growing product.
The solution is to provide self-service analytics. With self-service tools (where users can drag and drop measures, attributes, and filters to create their reports that they can add to their own or their team’s dashboards), you will save your backlog from the clutter of change requests. But, this approach requires an enormous development effort if built in-house.
Besides the obvious security concerns — meeting all the compliance requirements and ensuring that the users see and query only the data they are entitled to — you need to ensure that users understand the information they use. However, understanding the meaning of all the data artifacts is difficult if your database schema is not a simple schoolbook example with one fact table and four dimensions. You have to introduce a catalog for your users that corresponds with the business semantics and translates the requests to the back-end and the data sources — this concept is called a semantic model. A further step to take is in allowing the ability to compose predefined metrics; in order to simplify the creation of ad hoc queries and minimize the risk of your users making decisions based on incorrect data, which can lead to even more of a headache than just having no analytics.
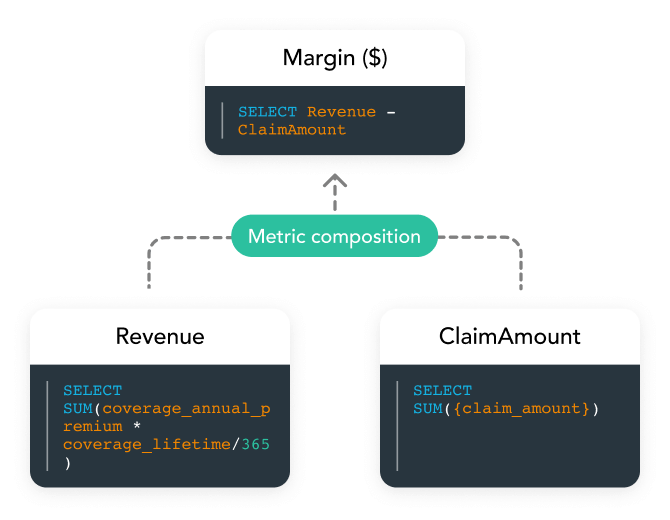
Metrics composition. Source: GoodData
Unless your SaaS product is primarily a data product, you likely won’t have the engineering skillset to build an application with scalable-friendly architecture. Moreover, you should not limit your roadmap to analytics features since your main value proposition focuses on different use cases.
To achieve a complete analytical experience while not jeopardizing your core product roadmap is to integrate with a third-party embedded analytics platform. Such a platform should work either as a hosted service or as a cloud-native application. With cloud-native architecture, your teams can deploy it to your current product stack, ensure real-time data processing, and skip the data copying between servers. Embedded analytics is a data analytics software integrated into another business software solution, where two individual elements are brought together as one. Typically, the embedded analytics is so seamlessly integrated that the non-technical user is unaware that they are working with two pieces of software.
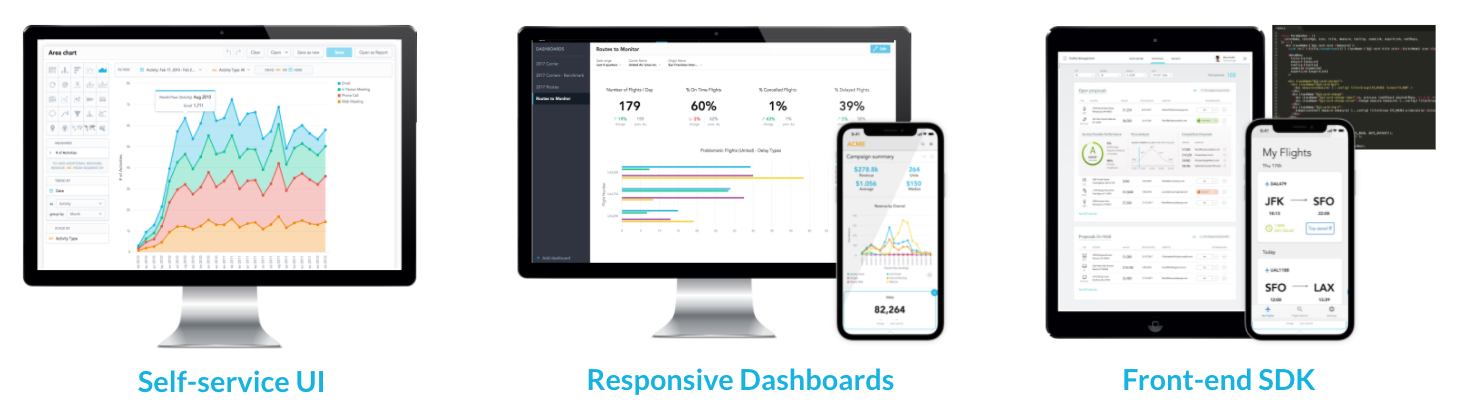
Examples of embedded analytics. Source: GoodData
Still, it is not only about having static dashboards and reports embedded into another business application or portal. In particular, it’s about integrating and managing all the pieces of the puzzle that make accurate, interactive, and attractive data visualization possible. That includes connection to various data sources, including federated queries; fast, accurate updates and changes of your analytics scope; and meeting data privacy and security standards such as GDPR or CCPA. These technical aspects that your users don’t see — unlike self-service or visualization — are crucial for the product’s operation.
It’s preferable to use a solution that provides a front-end SDK for rapid development of the analytical interface and open and declarative APIs to the analytical platform, with low-code and no-code services built on top of these APIs that can be combined and composed as needed. This approach is also called composable data and analytics, where the core element — headless BI — ensures the core BI capabilities, such as metrics consistency and management. It empowers your product developers to build features that can fit into your core application — either by predefined building blocks or with custom code — making the delivery of analytics into your product just another software development project that fits into your engineering teams’ lifecycle.
Integration of analytics as code into your existing product is the most seamless way of embedding, one where your customers and users won’t be able to recognize that they are using another piece of software. It also gives you endless possibilities in building the feature set that you and your users require, allowing your teams to work with APIs rather than embedding a fixed dashboard or report.
A Strong Provider to Complement Your Product Team
To succeed in the world of SaaS products, you need to be able to rely on your product team and on the technology you provide to your customers. For analytics, building it from scratch in-house brings numerous risks; as a result, it is preferable to partner with a third-party analytic provider. A provider, such as GoodData, is able to bring the power of composable data and analytics as well as headless BI to your developers. Keep in mind that on your end, a strong product vision and the ability to execute it are required, so investing in your product team is paramount. Where that investment lies is enabling your team with education — enter Product Management certifications — in order to teach the essential skills needed for building any digital product.
This article was originally published on the Product Management Blog.
Product School author bio: Ellen Merryweather is a Content Manager at Product School. As co-host of the Product Podcast and #ProductCon MC, she’s passionate about helping more women into tech and spends her free time trying (and failing) to learn how to code.
Want to see what GoodData can do for you?
Get a guided tour and ask us about GoodData’s features, implementation, and pricing.
Request a demo