Headless BI: Achieve Consistent Analytics Results
4 min read | Published

There are multiple ways by which analytics and BI are currently being consumed. End users are using analytical dashboards, creating their own ad-hoc reports, using reports as a data source for their machine learning models, and scheduling reports via email, and opening them in a PDF viewer or spreadsheet.

BI consumption options
Catering for all these options and implementing them in your application or portal is no simple task. And it’s for this reason that many companies approach it simply by using multiple tools and platforms that sit on top of a shared database. The main problem with this ad hoc approach is that ensuring the consistency of analytics across these tools is very difficult. Why? Because of the different data models and query languages used across these varying tools, further compounded by the fact that each tool uses snapshots of the data from different times (i.e. before or after the data has been refreshed). Read on to see how best to tackle this problem of inconsistent analytics.

The result? — different analytics tools and platforms yield different outputs. Meaning one team or group of end users is acting on different results to the next.
Experience GoodData in Action
Discover how our platform brings data, analytics, and AI together — through interactive product walkthroughs.
Explore product toursThe Answer to Inconsistent Analytics
As highlighted, achieving consistent analytics across these different tools is hard, with the challenge of executing consistent data access permissions, being something even harder to achieve.
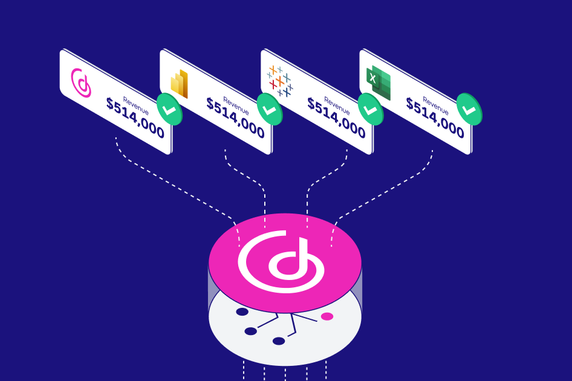
The answer to these problems? Headless BI. Headless BI provides a single source of truth via metrics and a shared semantic model that effectively means all the different analytics consumption methods mentioned above work with the same calculations and datasets and, as a consequence, users, teams, and the entire organization get access to the same results regardless of the way in which they are consuming the data.

Headless BI — consistent results across multiple tools and platforms.
We can demonstrate the key concepts of Headless BI using GoodData Cloud Native (GoodData.CN) as an example.
Multichannel Analytics Consumption
GoodData.CN supports pretty much any existing analytics/BI tool or platform, machine learning console or notebook, and programming language. Below are just a few examples:

Power BI connected to the GoodData semantic model

Qlik connected to the GoodData semantic model

Tableau connected to the GoodData semantic model

DBeaver, RStudio, Zeppelin, Jupyter...
By using the OpenAPI standard, GoodData.CN allows for the automated generation of programming language bindings, and SDKs for Javascript, Java, Scala, Python, .NET, Kotlin, Ruby, and other languages, as well as fully supporting database querying protocols like JDBC, ODBC, DB-API, and more.

GoodData.CN integration layers
GoodData also provides the open-sourced GoodData.UI library enabling the convenient development of React, Vue, and Angular UI applications.

GoodData.UI code example
Semantic Model and Metrics
The semantic model streamlines data management, translating the complex data structures within your data storage into easy-to-understand, highly reusable abstractions that define the relationships between datasets and require no prior SQL knowledge from your users. The semantic model can be easily built from physical data-model fields or pre-built views, with the entities mapped to one or more data sources (e.g. Snowflake, Azure SQL, BigQuery, Redshift, Dremio, Drill, Kafka, etc.).

Semantic model and metrics
Metrics are defined on top of the semantic model.

Context-aware and reusable metrics
GoodData metrics are context-aware, which, in short, means that you can use them with any combination of dimensions and other metrics and, subsequently, they will compute a correct result. You can define hundreds or even thousands of reports with just a handful of (reusable) metrics. What is more, the metrics are executed in real time and thus, reports, dashboards, and machine learning models also benefit from this.
Declarative Definitions
GoodData.CN supports both visual and declarative editing of all analytics objects (e.g. dashboard, report, metric, semantic model, etc.). Both visual and code editors save an object’s definition to one metadata server. Both work instantly with the same declarative format, so there is no need for any synchronization. The declarative definitions can be automatically generated in any programming language and published or modified via API. They can also be versioned in any version control system (e.g. Github), helping to simplify the deployment and development process, as well as allowing for easy integration with DevOps pipelines (e.g. GitLab, Jenkins, Travis, etc.).

Headless BI and continuous integration pipeline
Multitenancy: Separated Workspaces
GoodData.CN supports many tenants (your customers, business partners, branches) from a single deployment. The analytical solution that you create can be deployed and rolled out to many tenants, with the tenant-specific solutions being inherited from the base package. This means that all changes, like for example bug fixes or new versions of your objects, are instantly propagated to the tenant instances (also known as workspaces). Also, individual tenants can extend and override the base package. These tenant-specific changes are private to each tenant.
GoodData.CN also allows for partitioning data to individual tenant solution instances using data conditions (SQL WHERE clause). Each tenant’s users then only see data that are owned by or related to the tenant.

Multitenant solutions are inherited from a base solution. Data is partitioned by a SQL WHERE clause
There are numerous other important aspects to consider in a headless BI solution, aspects which GoodData.CN fully supports. Some of these key features include; intelligent caching, which ensures scalability and low execution latency, strong data security and privacy, single sign-on, and integration with user management platforms.

GoodData.CN: Key capabilities
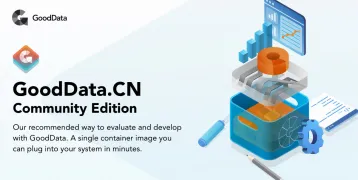
Ready To Learn More?
This article provides just a small glimpse into the benefits of headless BI and GoodData Cloud Native. To learn more and see how GoodData can seamlessly fit into your data stack, take a look at our headless BI webinar recording or simply download GoodData.CN Community Edition and get started today.
Experience GoodData in Action
Discover how our platform brings data, analytics, and AI together — through interactive product walkthroughs.
Explore product toursIf you are interested in GoodData.CN, please contact us. Alternatively, sign up for a trial version of GoodData Cloud: https://www.gooddata.com/trial/