Architecture for Large-Scale Analytics Deployments
6 min read | Published
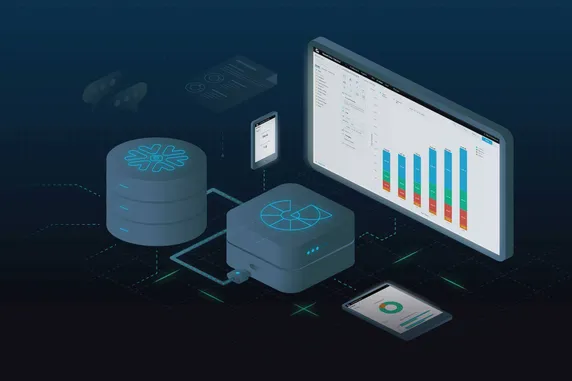

This article will help you understand how the GoodData and cloud data warehouse technologies, such as Amazon Redshift or Snowflake complement each other, and how to design architecture large-scale analytic deployments of the kind for which GoodData is known.
Let me illustrate two of the most dominant large-scale analytics use-cases:
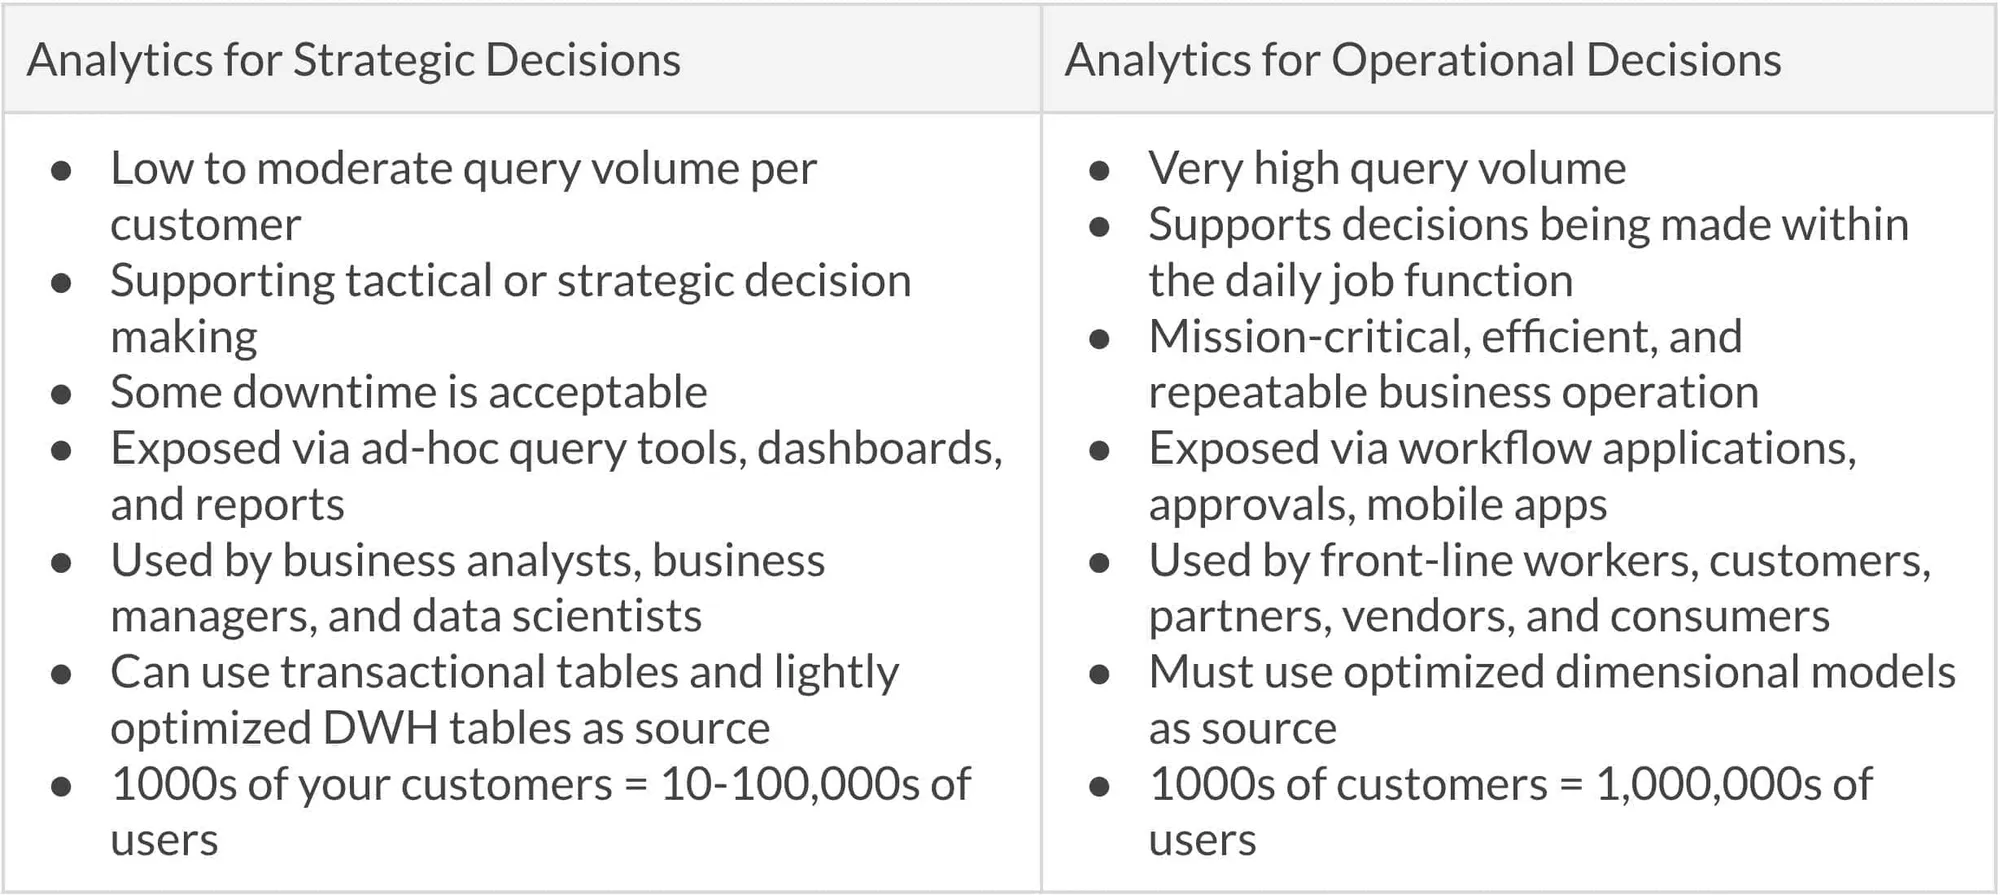
Interactive Dashboards, Self-Serve Analytics
Your company delivers dashboards to a distributed group of users: customers, partners, and a business network. You need to equip skilled business users and analysts with the ability to interact with dashboard insights and manipulate data (slicing and dicing them to produce beautiful visualizations). While the query volume can be moderate for each customer, for dashboards as well as ad-hoc exploration, the size of the business network still implies a much higher number of interactions and queries than if you were providing traditional analytics for a handful of internal teams.
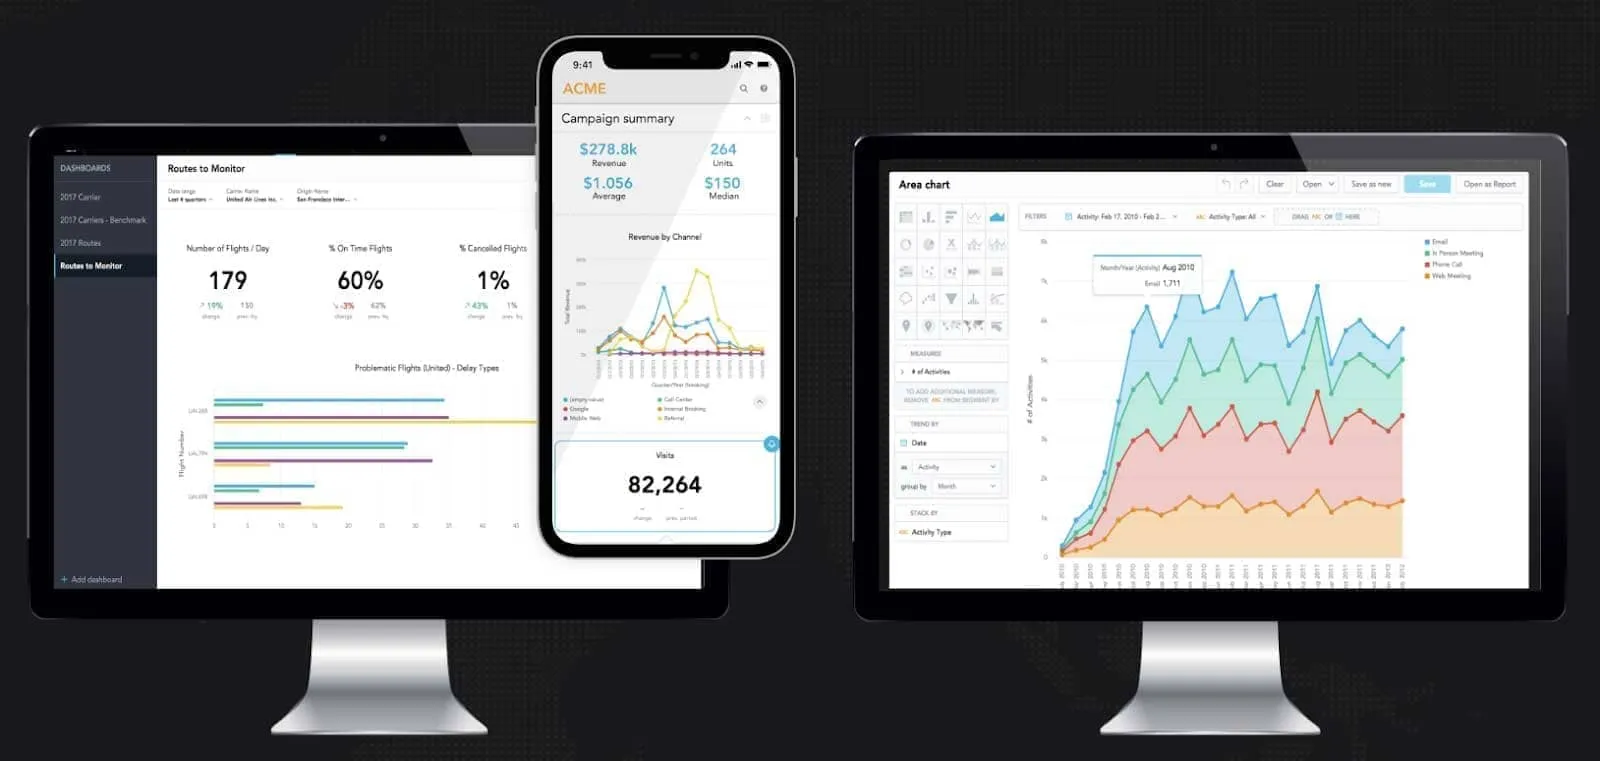
Web, Mobile Dashboards and self-service exploration.
Interactive Analytics at the Point of Work
When analytics is delivered at the point of work to support operational decisions, it’s no longer just a tool used by analysts and a handful of business users. Its impact is much bigger as it involves every user of the application. This increases adoption and utilization to new levels — more users and more decisions are aided with insights. The more users make decisions based on insights, the more data comes back into future insights which are presented, closing the loop and improving business performance and impact. The decisions are mission-critical as they increase the efficiency and consistency of business operations. These are the on-the-spot credit decisions such as the mobile service employee deciding whether to repair or replace a broken product or the traveler stuck in bad weather making a flight change on their mobile phone. High query volume, high value, and a lot of self-service by everyday users.
Want to see what GoodData can do for you?
Get a guided tour and ask us about GoodData’s features, implementation, and pricing.
Request a demoLarge-Scale Analytics with Your Cloud Data Warehouse
Imagine the scenario where you develop an analytic application for a large user base, the next multi-tenant SaaS app. Your platform has both web and mobile apps, serving 1000s of customers and growing. But each of your customers has 1000s of customers or users of their own which means that easily 1 million users are accessing those analytics!
Based on our experience, to manage this large-scale, customers need the best technology to: consolidate and bring all data (yours, your customers’, and 3rd parties) into a single warehouse, build common and custom parts for analytical schemas and models (metrics, attributes, insights, …), use highly efficient data and metadata distribution (for usability, customizations, performance), integrate or build an analytics application (from embedding dashboards to highly individual insights).
What’s the impact of large-scale analytics on your systems?
Bring All Your Data Together
A cloud data warehouse is the choice you made, or are about to make, for warehousing your internal data. And to serve relevant insights to your customers and business network, you are likely going to integrate with additional data — from your partners and third-parties. The powerful data warehousing coupled with your favorite data prep tools will help you prepare your data for large-scale analytics in no time.
Whether you need to run machine learning models to train them, segment or prepare benchmarks, all your data are getting closer to your product and analytics users.
Large-Scale Analytics Change the Rules of the Game
The large scale brings additional requirements to the table. Whether you integrate analytics into your application or deliver an analytics application on its own, the analytics are becoming a full-fledged product of its own, with customers, users, and their requirements. This new product follows the lifecycle of changes, improvements, and new features just like any other product would.
From an analytics standpoint, there are some key requirements to take into consideration, making sure you not only build but also maintain everything for the large scale, making it useful, and providing a superior user experience. This is all made easy with GoodData’s eXtensible Analytical Engine (XAE), which makes it easy to manage and use analytics in these environments:
- Logical Data Model abstracts the complexity of the data structure (the tables and joins) while clearly defining the business and analytics context within. The logical data model follows the best practice of star, multi-star, or cloud data warehouse schemas, unlike transactional models. When you have an analytics-ready schema in your cloud data warehouse, the process of building a Logical Data Model is much easier and can even be automated.
- Highly reusable measures and dimensions ensure consistency (same results for everyone) and high efficiency when creating and maintaining analytics — with strong analytical functions powered by MAQL, your developers don’t have to rewrite all SQL queries every time a change is needed.
- Enable model and measure customizations while keeping the agility of managing changes throughout the lifecycle of your analytics application.
- Business users will interact predominantly with the top of your semantics; insights which are both pre-built or created, and shared by the more skilled business ones. The business measures are well understood, while the technical ones might be hidden to prevent arriving at the wrong conclusions.
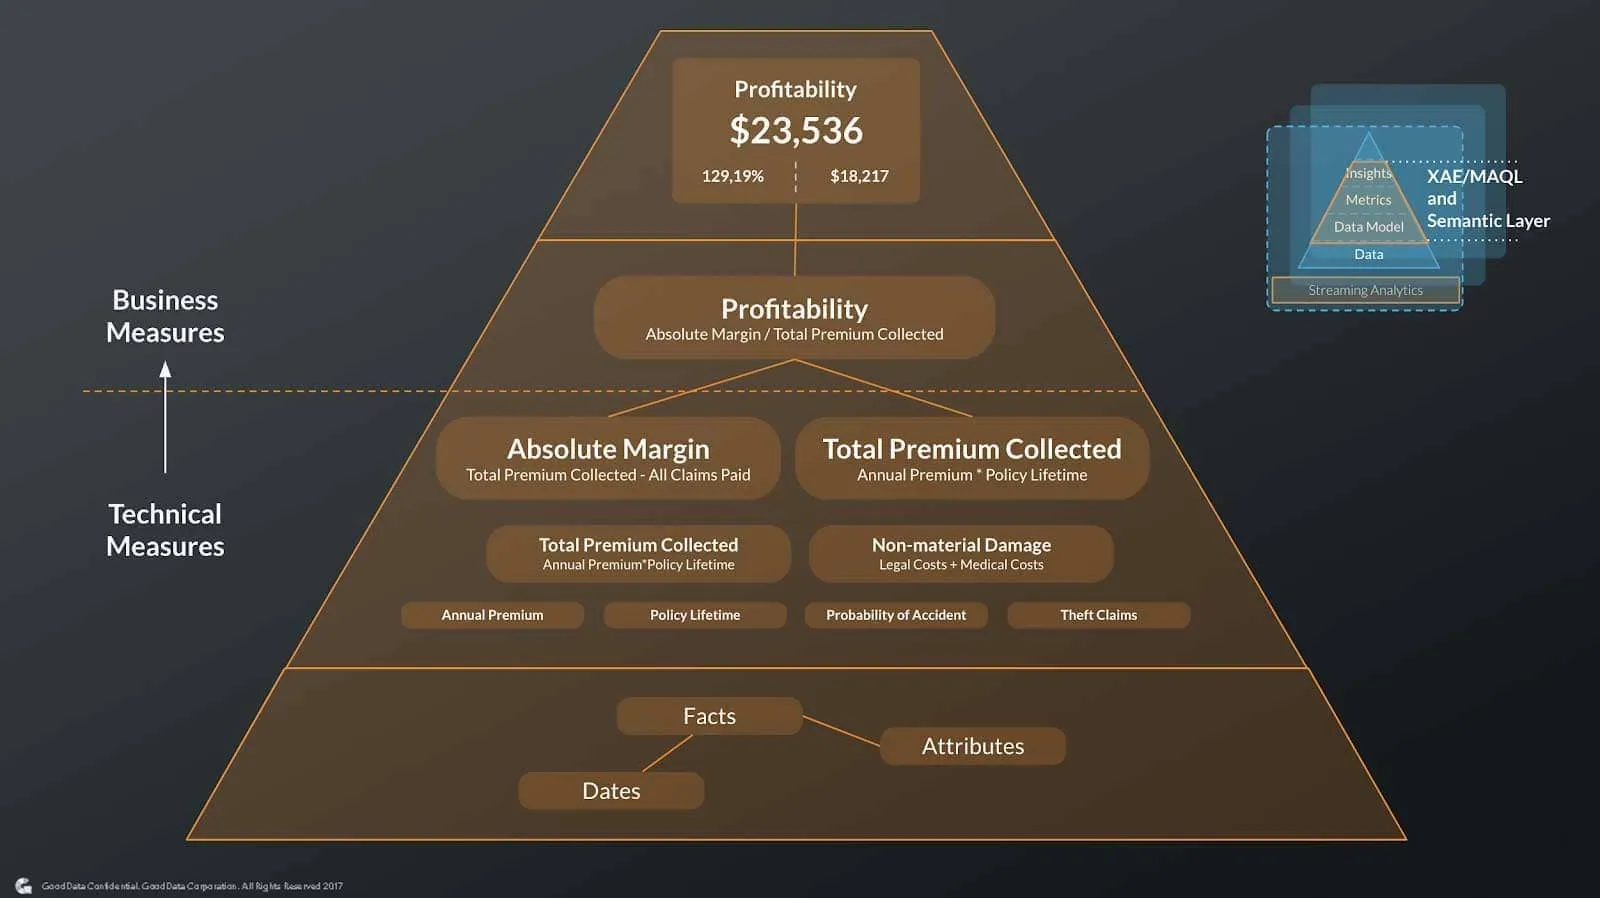
Semantics over data = business context for users.
Each of these components remains highly resilient and keeps your users, analysts, and developers productive. When you want to introduce new data or new metrics you don’t need to rework the entire solution or break insights that your customers have already built.
Large-Scale Data and Metadata Management and Distribution
One of the key enablers for large-scale analytics is the managed distribution of data, metadata, and configurations. Here’s why:
Each insight in your application means there is a set of queries, typically 3–4 with query optimization in place, which has to run and combine into final results with sub-second latency. Now scale out the number of insights to 1000s of customers and 100s to1000s of users per customer, multiple times a day. To deliver the best user experience, GoodData uses multiple techniques. The first is to distribute the data and query load, then using powerful query optimization, smart caching, and powerful backend hardware specially optimized for analytics to make sure the results will arrive in the shortest time possible. The data distribution also automatically addresses common concerns when working with your customer data; each customer’s environment is isolated for security and privacy.
All analytical applications begin with the same semantics (metrics, attributes, insights, dashboards, …), and use different data for each customer to make management easy. When your customers explore, they begin to ask for custom reports or want to build on their own. You could say “no” to these requests, but you can also use GoodData’s ability to manage changes to common parts of your semantics, such as the logical data model, out of box metrics, attributes, insights, and dashboards, and let your customers or customer success teams fulfil these customization requests without threatening the ability to stay agile and keep releasing your product on a frequent basis. The resiliency of what you build meets the flexibility your customers are demanding. Also, offering self-service exploration with Analytical Designer will help your teams reduce the number of custom report requests received.
The same large-scale distribution method works with other metadata; your tenant, user, roles, and permissions provisioning. More importantly, you don’t have to manage them manually.
Instead, you can use GoodData’s APIs to ensure your product defines what needs to happen when you onboard or offboard new clients, provision access, or adjust roles.
Storytelling Your Way
Embedding insights into your applications is a great design challenge. All customers are looking to meet design guidelines and styles while maintaining as much flexibility as they can. GoodData gives product and development teams the ability to choose from a wide range of integration options for web and mobile applications:
Interactive dashboards
Dashboards can be built with a drag and drop environment and embedded with a few lines of iFrame code into your web or mobile application. Or you can use GoodData.UI SDK to build highly custom interactive dashboards with their own design, visualizations, and more.
Insights at the point of work
GoodData.UI SDK doesn’t only give you the flexibility to build dashboards; on the contrary. You can combine your existing JS components and libraries with insight components that are easily and quickly built with the SDK and deliver a fully custom application and experience. Or you can use the data layer APIs and your own visualizations and make it part of your application.
Intuitive self-service analytics
Insight or customer success teams have to cope with a long list of custom report requests. If that’s your situation, there is a simple solution — adding self-service tools like Analytical Designer for your users to explore, build, and share insights on their own. I strongly believe that 80% of users can get away with what you offer out of the box through interactive dashboards, and you can reduce the next 20% to 1% just by giving the business users intuitive tools to explore. The remaining long tail of 1% will be the true custom requests (which is much better at large scale).
Combining multiple approaches
To test the waters you could choose a dashboard-first approach, combine it with self-service analytics and end up building insights into the application workflows.
My question to you: How do you build your analytics for individuals and customers outside of your organization? Do you give pre-baked dashboards or self-service exploration? Share your thoughts below.
Want to see what GoodData can do for you?
Get a guided tour and ask us about GoodData’s features, implementation, and pricing.
Request a demo

