eBooks
Best Practices for Building a Data Product With Embedded Analytics
17 min read | Published
About
Do you aspire to help your customers easily understand what is behind the data they use every day? Do you want your users to make data-driven decisions in your product? Do you want to tell stories through the data your product generates? Do you want to take your product to the next level by bringing data-driven decision-making tools to its core?
This e-book digs into several key aspects of an embedded analytics solution, focusing on the best practices you should employ.
Key Points to Consider
A data product is an enterprise’s information assets wrapped in engaging analytics that drive significant value to its business network. The solution for engaging analytics in a software product is called embedded analytics.
Embedded analytics represents a set of analytical tools seamlessly integrated into your existing product. Subsequently, the user will see the tools as an inherent part of your product, despite the former running as a third-party analytical platform within the backend.
But why even consider a platform and then build the analytics on top of that when your teams can build it all from scratch? The answer is simple. Focusing on your key competencies is the best way to succeed on the market with your product.
A data product is an enterprise’s information assets wrapped in engaging analytics that drive significant value to its business network. The solution for engaging analytics in a software product is called ‘embedded analytics’.
Embedded analytics represents a set of analytical tools seamlessly integrated into your existing product, in a way that the user will see it as an inherent part of it, despite running as a 3rd party analytical platform within the backend.
Why even consider a platform and then build the analytics on top of that when your teams can build it from scratch? The answer is simple. Focusing on your key competencies is the best way to succeed in the market with your product.
Unless analytics is your primary focus, relying on a strong partner will always prove to be the better option than being burdened with development and operations that are neither your area of expertise nor your primary business case.
Here are the most important points you need to consider when building an analytical experience in your product:
- Focus on your product, don’t struggle with security and standards
- Control and manage your analytics for all your customers with out-of-the-box tools
- Get a hand from professionals
- Transparent and predictable pricing for your growth
- Self-service: Prevent change-request overload
- Build a solid analytical model fast — for 10s, 100s or 1000s of customers
- User interface integration, seamlessly
- Integrate with your production data quickly and reliably
Covering these points will be easiest with an embedded analytics platform, unless you already have strong expertise in your engineering and data teams. So, let’s take a look at what the best practices are, and what to look for in an analytics solution.
Focus on your product, don’t struggle with security and standards
Building a solution based on data will require that you meet various security requirements and regulatory standards. These requirements evolve, with new regulatory standards, for different regions or industries, being introduced over time. Moreover, you might consider entering a market that requires a higher set of standards than you originally planned. Implementing such rules to an existing solution might negatively impact the roadmap of your core product features.
The ideal embedded analytics platform should cover all the problems above, with the highest level of data security and protection, in order to strengthen trust, provide full transparency, and enhance governance, risk management and compliance for companies of any size. Every solution owner must oversee and properly plan all of the security aspects - cloud and physical, data and operational security.
Let’s take a look at three layers of security and the best practices surrounding them.
Cloud and physical security
- Enterprise-class SOC 2 Type II-audited and ISO 27001-certified facilities that include 24/7/365 managed security and physical access control.
- Monitoring the platform and all of its underlying operating components for security incidents, including alert notifications generated by the platform systems, industry and open source alerts, and community alerts.
- Three-level support team on-duty 24/7 and trained to provide systematic and efficient responses to incidents including security and availability issues.
Data security
- Ensuring all data remains confidential, available, and backed up for governance and disaster recovery purposes.
- Security zones are defined and implemented with specific enforcements, such as protocol enforcement, intrusion detection and monitoring, and the platform is subjected to regular penetration testing.
- Customer data is both isolated and encrypted in transport as well as at rest to further enhance its defense.
Operational security
- Access to the production environment is under strict control
- Administrators are allowed to invoke platform-specific functions but not to directly interact with the platform’s underlying components.
- Access logs are monitored and regularly inspected.
- The measures detailed above meet the best practices for ensuring secure operation of any analytical solution. With a 3rd-party solution, you have the freedom to choose which service-level support your business needs:
Basic out-of-the-box security – Covers industry standard best practices for data protection in the cloud, including SOC 2 Type II report, ISO 27001:2013 compliance, GDPR compliance and CCPA compliance.
Regulatory add-ons for specific use cases:
- HIPAA, including BAA and additional arrangements, to ensure customers comply with the HIPAA regulatory requirements.
- GDPR Article 9 add-on including DPA and additional arrangements to ensure compliance with requirements for processing of special categories of data under Article 9 EU GDPR.
Control and manage your analytics for all your customers with out-of-the-box tools
Once your analytics is up and running as an inherent part of your product, with a successful go-live launch, you will be facing the reality of everyday operations - understanding what is happening and striving to automate your operations as much as possible.
You should also be able to understand how users are consuming your analytics. The data will help you with both quantitative and qualitative research that your teams will conduct when improving the products. The final goal is clear - maximized user adoption and satisfaction; yielding increased usage of your product. The second point; automation, needs to cover daily administrator tasks to minimize the risk of human error and keep operating costs, related to analytics, as low as possible to maximize the solution margin. Let’s take a look at how to best solve these challenges.
Analytics over analytics
Your analytics experience will need analytics in its own right to help you not only proactively monitor your environment but also to answer key questions such as:
- I’ve released a new dashboard. What is the rate of adoption?
- I've been in analytics for a while already. I have dozens of insights, dashboards... I would like to understand: Which ones are actually being used? Which should I focus on? What can I delete (impact analysis)?
- Some of my users have ad-hoc capability. Which parts of my model do they use? How often? What data are my users interested in? Is the adoption/usage actually better compared to canned analytics only?
- Are there specific areas of analytics with high utilisation? Should I focus on / optimize for them?
- I would like to see my overall contract utilisation - all environments, all instances (including personal and development ones). What is the trend?
- I’m refreshing the workspaces frequently. Is it necessary for all of them? Which are frequently used? (I would like to optimize the costs, prioritize the ETL…)
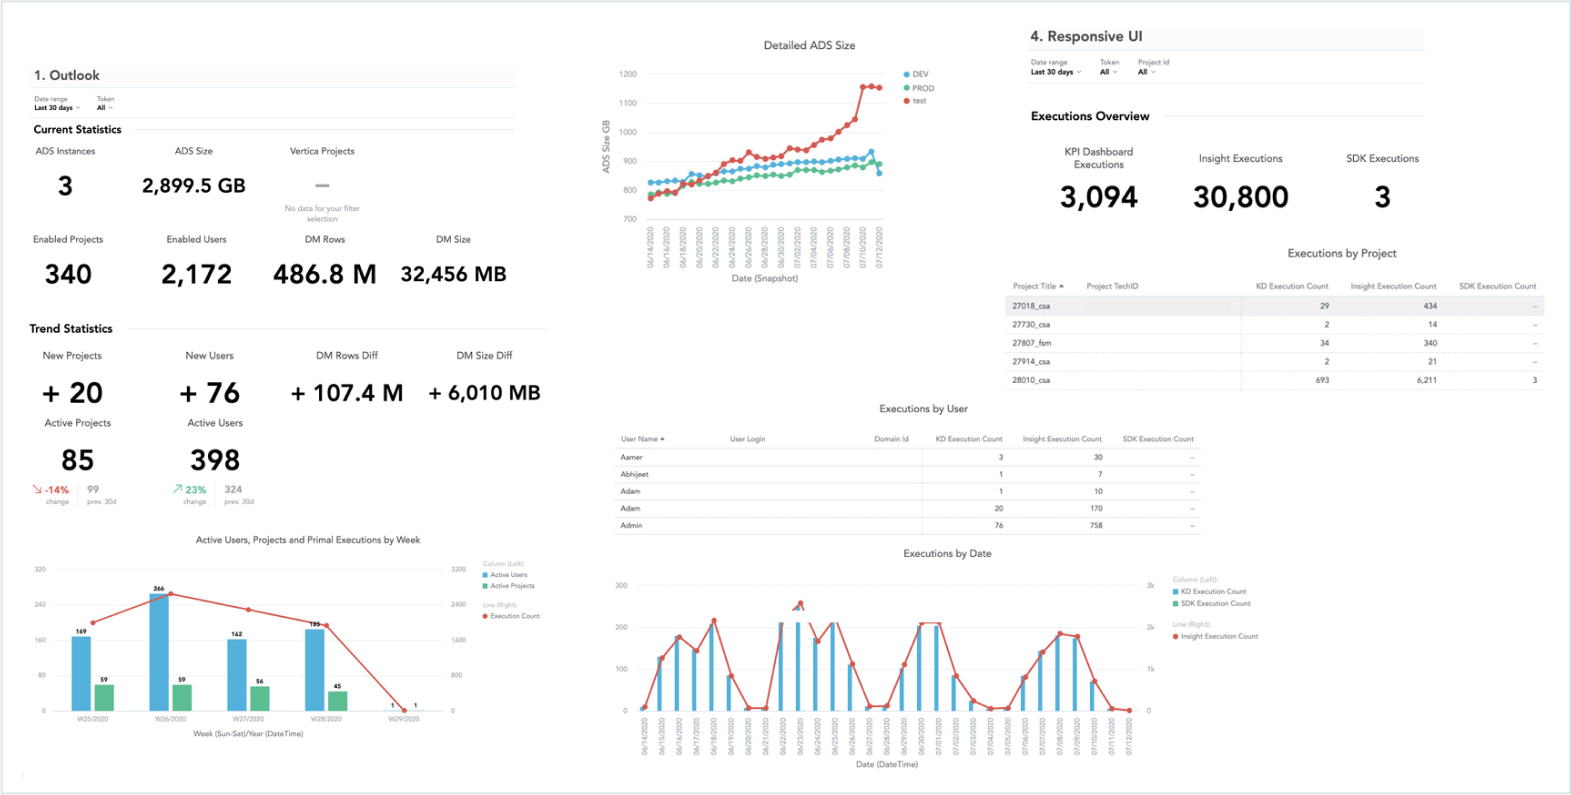
With properly set up analytics you will get the answers and understand how your data product works among your customers and users. You will see the patterns that might lead you to a change in your solution. You will also be able to prototype a new analytical function and study how it’s being used or find product champions, among your customers, that can help you with your user research.
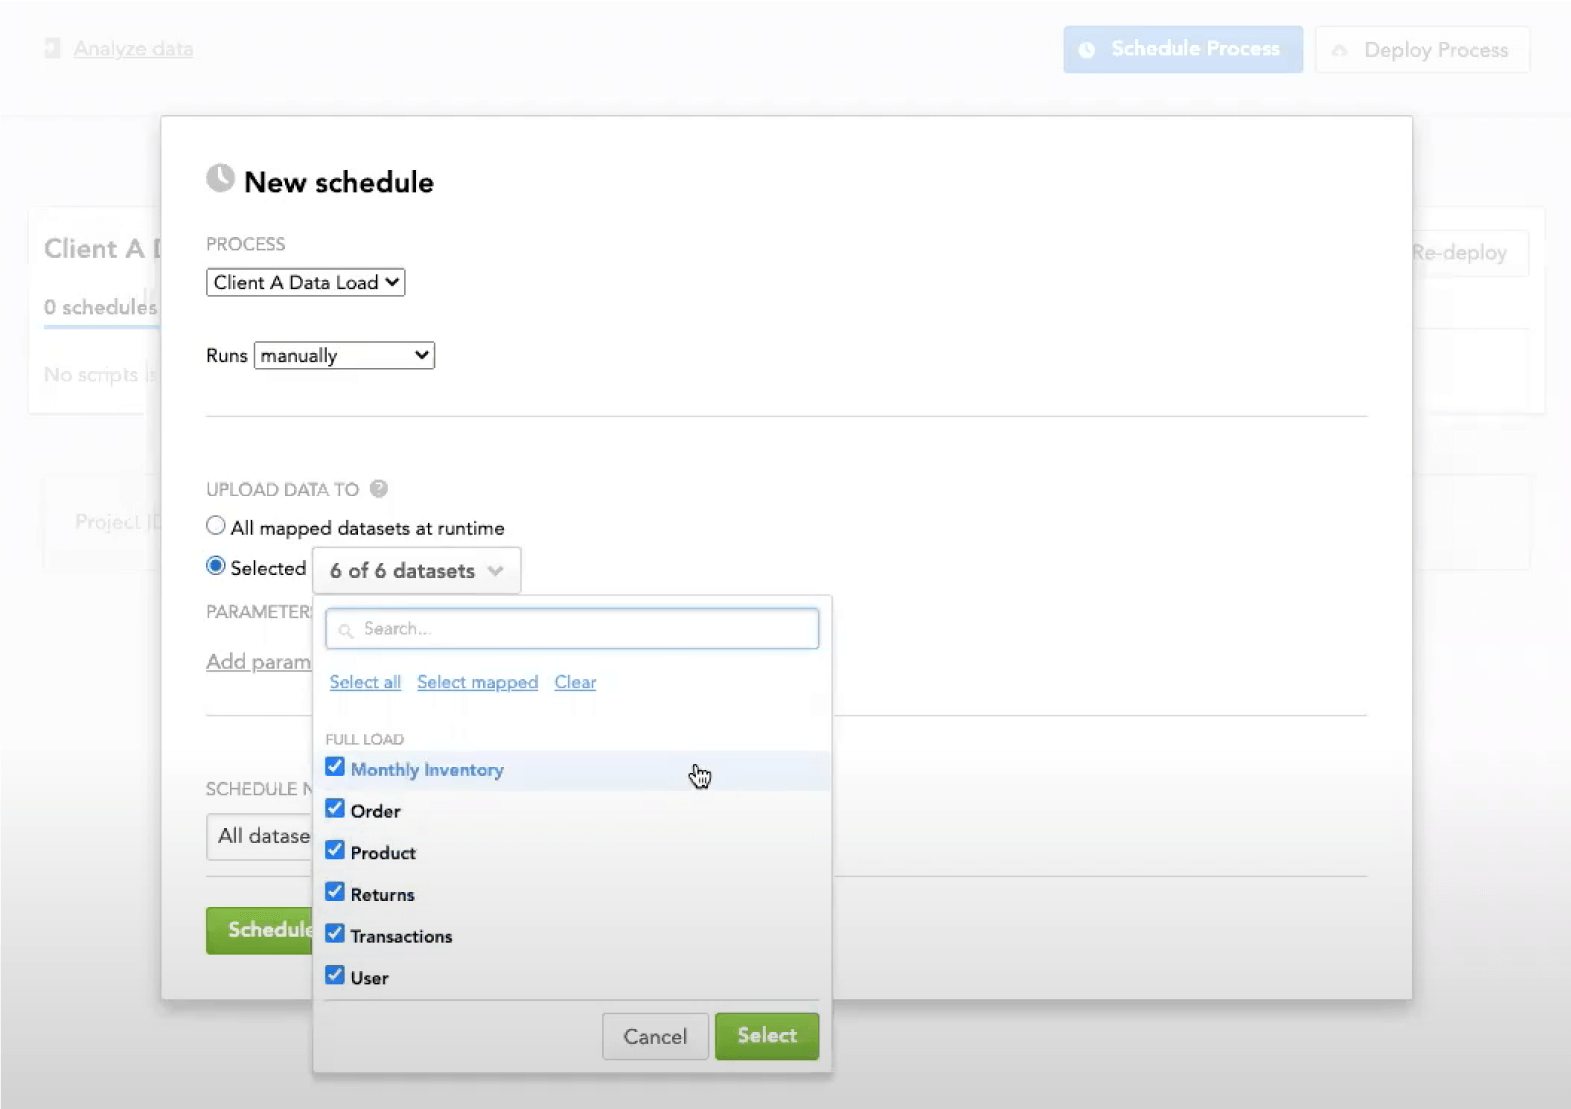
Operational automation
Product teams need to plan for how to change analytics at the same pace as their application, and how they will make analytics instantly available, how they will comply with security and regional regulations, support localization and disaster recovery. Your embedded analytics platform should address these issues by providing an end-to-end managed service, including runtime, operation, security, and management of the platform. This lets organizations focus on their core business instead of managing the components and costs needed to support analytical solutions.
Once a business implements an analytical solution, they will need to continuously address several ongoing tasks. These responsibilities include; change management and the management of updates across many different versions and customers, handling local customizations, and onboarding new customers while ensuring that they have the correct authorizations.
Let’s take a look at a common flow:
- You will create the 1st version of your analytics (Easy)
- You will create multiple variants for different customer tiers; basic, premium, .... (Easy)
- Then you allow your customers to make their own reports and customizations (Easy)
- Then you push new versions of the Data Product to the right customers without breaking their own reports and customizations (Difficult)
- And most importantly, you need to do this for each and every one of your six thousand clients (Very difficult)
While creating the first versions of an analytics experience, with different variants, is straightforward, the harder challenge is to roll-out a seperate version to each of your customers’ application instances at regular intervals - without overwriting changes they made within self-service mode.
The automation tools of your analytics platform should therefore primarily cover the following governance processes:
- Agile change management enables the fast release of insight application changes to the hundreds or thousands of customized analytical workspaces.
- Dynamic provisioning of workspaces, and users’ roles and permissions.
Ideally, the automation tasks should be scheduled, and available via APIs and SDKs that can be used for integrating change management and provisioning with a continuous delivery process.
Moreover, the automation tools should enable agile change management with the inclusion of a development environment, a testing environment, and a production environment, providing the ability to propagate changes to clients in production without disrupting the end-user experience. The agile change management automates the entire change management process of moving the data model, metrics, insights, and other metadata mentioned above, from dev, to test, and production, all while maintaining localized customizations.
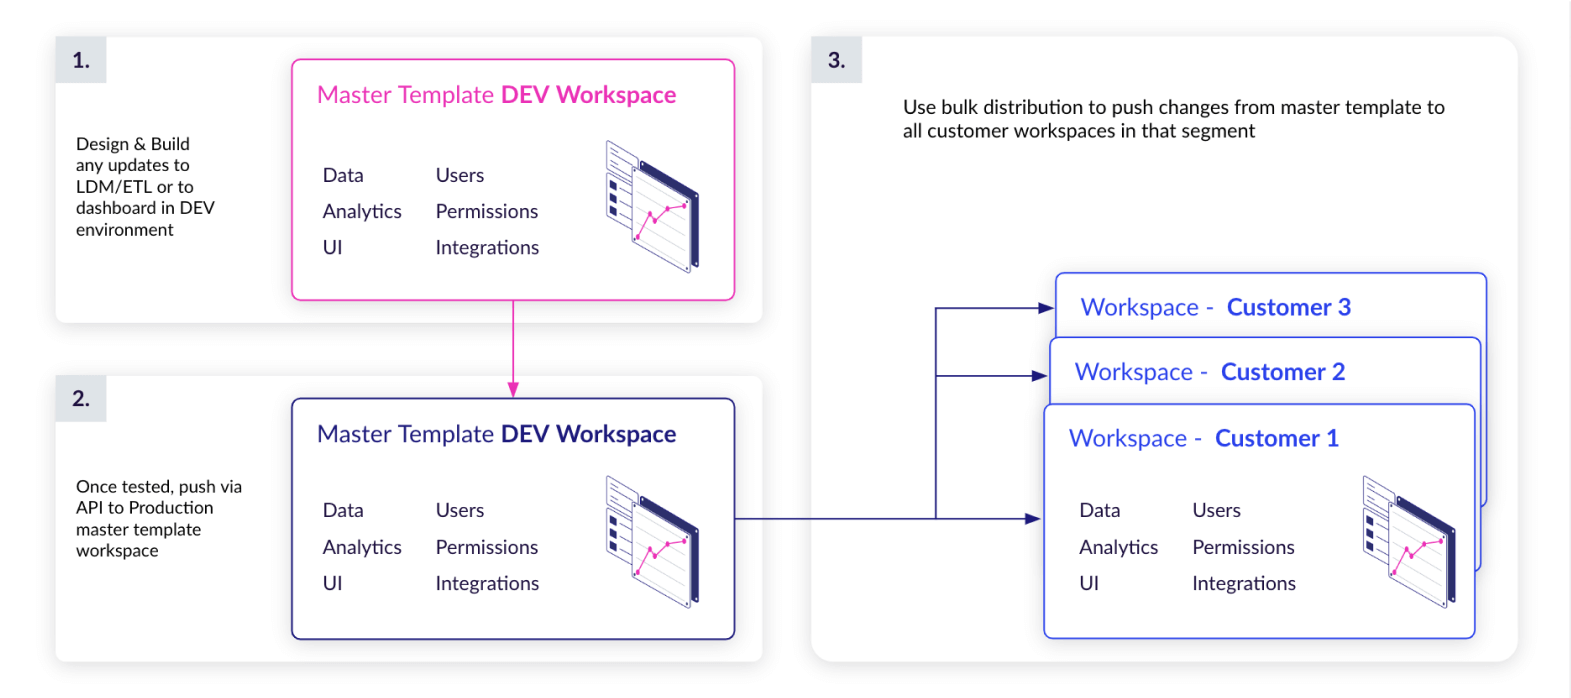
While the clients still have the ability to develop custom insights and dashboards inside their own workspace, the automation processes also allow you to create standardized reports, distribute them to clients, and manage all their later changes.
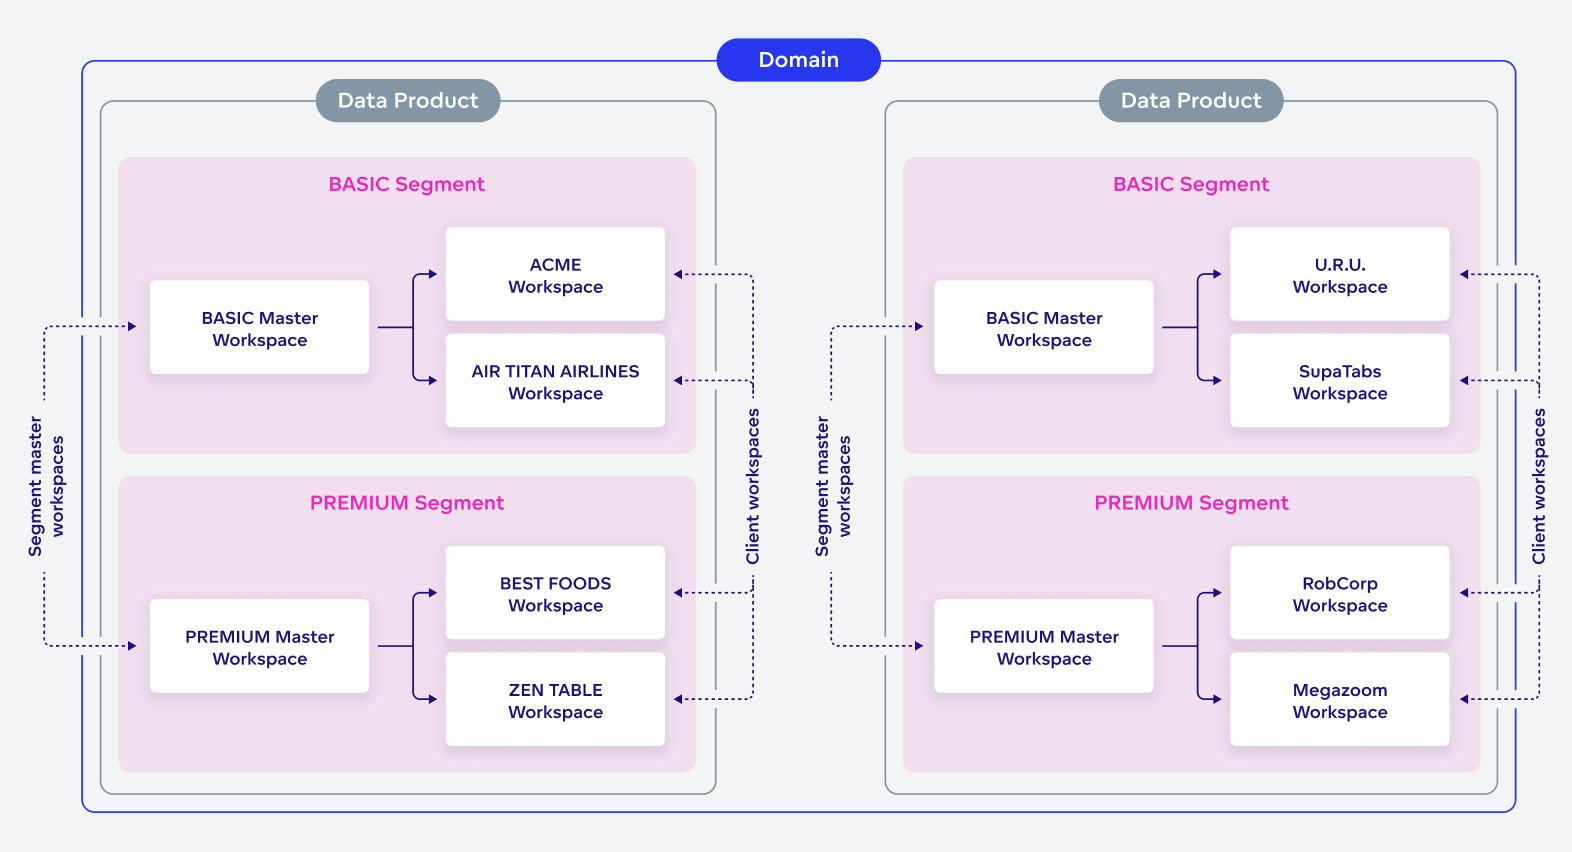
Further, your platform should include a suite of rollout tools giving the possibility to segment customers by subscription tier, or by their use preferences. With this capability, you are able to roll out different versions of your data analytics to different users, creating tiered pricing models to the benefit of both your business and your customer base. The roll out of these different versions of analytics won’t invalidate or overwrite the customizations and unique user preferences that your users may have already created, further underlining this feature’s added value.
Onboarding new clients can be a fully automated process. If you can provide the list of clients as part of the data feed, the platform will create, and decommission, workspaces without any manual intervention. The same goes for users, which can be automatically added and removed from workspaces based on declarative input.
Automated user provisioning tools are another important aspect of automation. The goal is to integrate with pre-existing user management tools using standard security protocols to automate the entire user provisioning process in real-time, by means of an extensive API set. The tooling can also be used without integrating with pre-existing user management tools for instantly adding or terminating profiles, and updating access rights.
Get a hand from professionals
Regardless of the implementation’s straightforwardness, your company just might not have the resources, capacity or team to focus on implementation of analytics instead of focusing on your core business.
The ideal embedded analytics provider offers the expertise of a Professional Services team that will partner with you in order to launch a successful analytical experience within your product. They can help you through inception, development, testing, launch and maintenance, to ensure success across the entire data and analytics production lifecycle. There are four main ways in which the Professional Services team can help you:
- Acceleration: Complete your initial implementation in weeks, not months or years. If you miss analytical expertise in your team, the processes of defining requirements might slow you, and your roadmap, down.
- Expertise: Leverage the business and technical expertise of the provider to define a path for the ongoing success of your analytics projects.
- Collaboration: Extend your team with a dedicated group of experts by designing value-driven partnership programs that exceed your expectations.
- Risk Mitigation: Increase the likelihood of achieving the desired outcomes and dramatically reduce the chance of time and cost overruns with focused implementation and success plans.
Whether you seek guidance to implement your data projects, or entrust the provider to take the lead, the approach should help you to design, build, launch and improve projects with significant time to value.
The provider should be able to help you move up the analytics maturity curve by enhancing your existing data projects, providing world-class round-the-clock technical support, and offering extensive training programs to get you up and running in no time.
Transparent and predictable pricing for your growth
Inability to transparently predict future costs can quickly erase your margins if calculated wrong. There are threetwo very common ways by which analytical platforms charge for their services, neither of which will help you predict your future costs:
- Pay per user: With this type of pricing, you will have to charge per every user of every customer. Unless you are going to charge your customers for using analytics per user also, your costs will grow unpredictably (based on the current customer user base) and your margin calculations will become increasingly difficult - a nightmare for your CFO.
- Pay per query: While user numbers may be predictable at the time of customer contract signing, traffic will not. Whenever an end user displays a dashboard, insight or simply explores information from the data in a self-service analytical tool, they will hit a pay-as-you-go database (a requirement from almost every query). This again, means unpredictable costs, finance team headaches and lost margin.
- Pay per customer workspace, allowing you to bring analytics to each of your customer’s end-users, predict price per customer and update your pricing accordingly. The pricing can then be easily calculated by number of workspaces, need of additional data storage and specific feature add-ons.
For instance, with GoodData, which employs the pay-per-workspace model, if your product is being used by 10 different customers and you need 25 GB of additional data to distribute among them, your yearly costs will be: $20 per workspace X 10 customers + 25 X $3.5/1GB = $287,5 X 12 = $3,450 / year. Learn more at www.gooddata.com/pricing.
Self-service: Prevent change-request overload
Depending on the industry, and the customer base, it is very likely that a wide variety of users will need to be catered for and, therefore, a wide variety of use cases and user requirements. It, therefore, goes without saying, that the SaaS embedded analytics needs to be accessible to every type of user that the application supports. Your customers and their variety of users will always require a different scope of insights than your product allows out of the box. Starting with an additional datasource, changing of visualization type, offering additional filters, slicing by a different dimension, to a completely new dashboard - all these requests will lead to a backlog of change requests, that will probably not yield any reasonable profit, but rather, burden your team with huge workloads.
The embedded analytics platform should provide self-service capabilities that will allow your customers to create their own reports, insights or dashboards on top of your out-of-the-box analytics - the same toolset used for building an analytical experience in your product, with your customers simply building on top of it.
Business users will be able to reuse your pre-existing metrics and insights and tailor them with the drag-and-drop tool. Data analysts on your customer’s side will drill deep into the datasets searching for fresh insights that can, in turn, be digested and used business-wide to fuel decision making and wider business strategy. Both roles will benefit from advanced features, with the unrestricted ability to manipulate reports, visualisations and key metrics. The capacity to create entirely new reports from scratch and share them with their teams right from inside your application is also of key importance to them.
Your platform should ideally contain a certain level of intelligent tooling within the user interface in order to guide users throughout the analysis. The tools should have the ability to suggest recommended reports to be created as well as showing only the relevant attributes according to the data model, therefore making it impossible to create a meaningless report by mistake. This, in particular, helps less data-literate users build reports on combinations of metrics and attributes that make sense.
For your product, customizations made by your customers in self-service mode, or data pipeline adjustments made by your team, shouldn’t present an integrity risk, as a well-designed embedded analytics platform will detect all customizations when releasing a new version of your product, as described. Thanks to self-service analytics, you can focus on your core product, while your customers create and share their own reports within your application without having to export data externally.
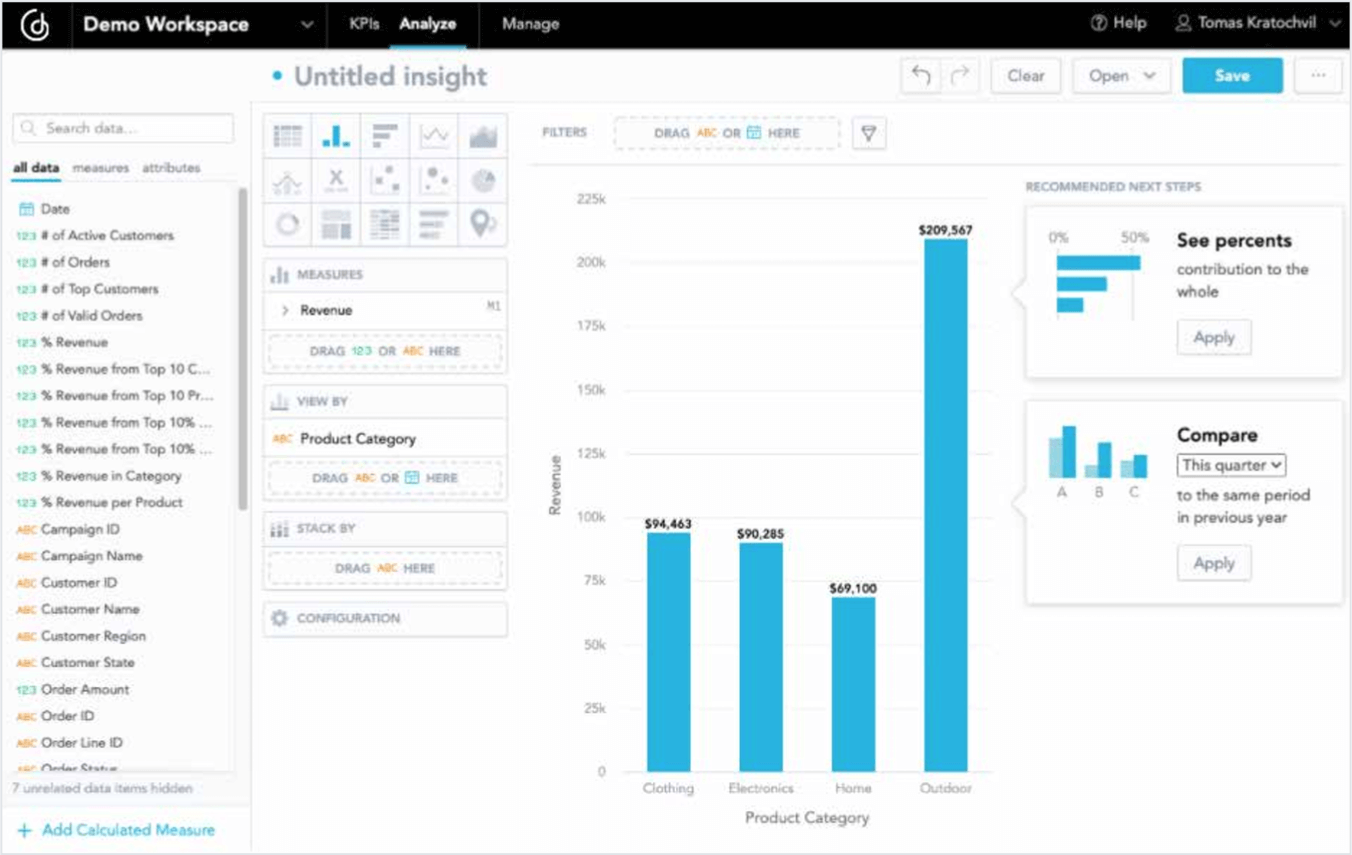
Build a solid analytical model fast – for 10s, 100s, or 1000s of customers
Your team doesn’t have to worry about how complicated writing queries is, as long as you have just a few static reports with a few consuments. However, when building an analytics solution your business can rely on, with self-service for your users and insights integrated right at the point of work, you will need to keep your time investments at a reasonable cost. Reports that cannot be reused sufficiently slow down the overall performance and productivity of your teams.
For every simple variance of an existing report that's defined by attributes, metrics and filters, you need to change as few lines of code as possible. The less you need to change, the less you can break and the less complicated maintenance will be. So, if your metrics have to be written again, just to accomplish simple report requests, your solution will quickly become difficult to maintain as your user base grows. A query language and semantic model that abstracts the physical data and creates an understandable layer for common business users is invaluable.
The properties of such a query language include:
- easy to understand expressions for business users
- context-awareness, meaning, for example, that one metric can be reused for ten thousand reports, generating the specific query base needed for a specific context. In short, you don’t need to create individual metrics or queries for each report - create your base technical metrics once and make them widely reusable for end-users in different contexts .end-users with the ability create their own custom metrics expressions, from existing ones, to save and use later as needed
One defined metric can replace plenty of SQL query scripts making it easier to write and maintain your data model. This alternative type of query language allows you to assemble a new metric from existing ones without the need to know how underlying data is structured and how related metrics are connected. Therefore, insights built in a platform of this type are context-aware, meaning that a specific metric performs different computations on entities with a many-to-many relationship to prevent double-counting, further enabling ease of use for metric creation and reusability.
Let’s take a look at an example of MAQL - a query language used in GoodData - and compare it to a standard SQL based query.
Your goal is to get the sales data from your database. In SQL, the query might be the following:
SQL: SELECT SUM(Amount) FROM sales_data;
The result will be 1 000 000 - the total value of products you have sold.
With MAQL, it’s much easier to deliver the same results:
MAQL: SELECT SUM(Amount)
So where is the sales_data table? With MAQL, it’s not necessary, all relevant amounts are summed from the appropriate datastore, according to the logical data model.
The complexity difference is best seen in detailed queries - for instance how much was generated from shoe sales?
SQL: SELECT SUM(amount) FROM sales_data JOIN product_data ON
sales_data.product_type_id=product_data.product_type_id WHERE
product_data.name = "shoes";
The result is 500 000. To get the number in a SQL-based environment, you need to understand the table and column structure, understand the relational algebra and how data is stored in your database.
With MAQL the difference is even more obvious:
MAQL: SELECT SUM(Amount) WHERE Product Type = shoes
As you can see, you don’t have to remember how to join tables to get the results; you can easily reuse the metrics as you want with business semantics.
So what is the Semantic model? It brings meaning to physical data and allows low data literacy end-users to work in self-service mode without the help of experienced analysts.
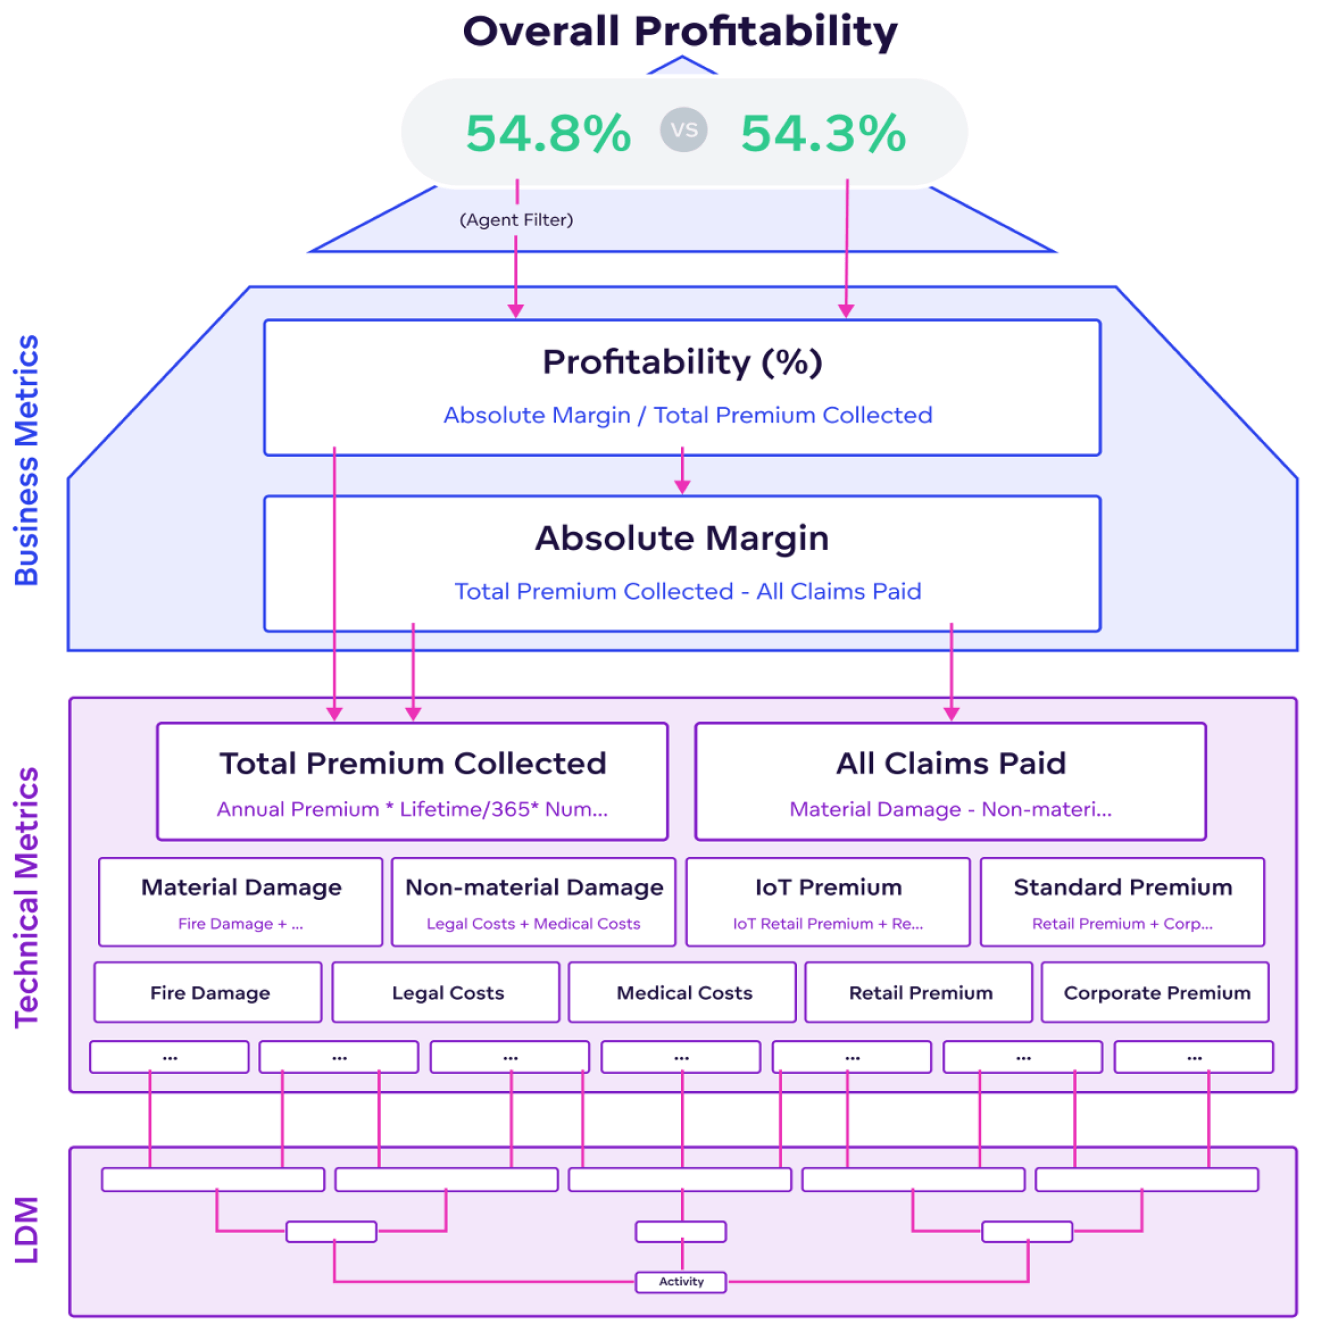
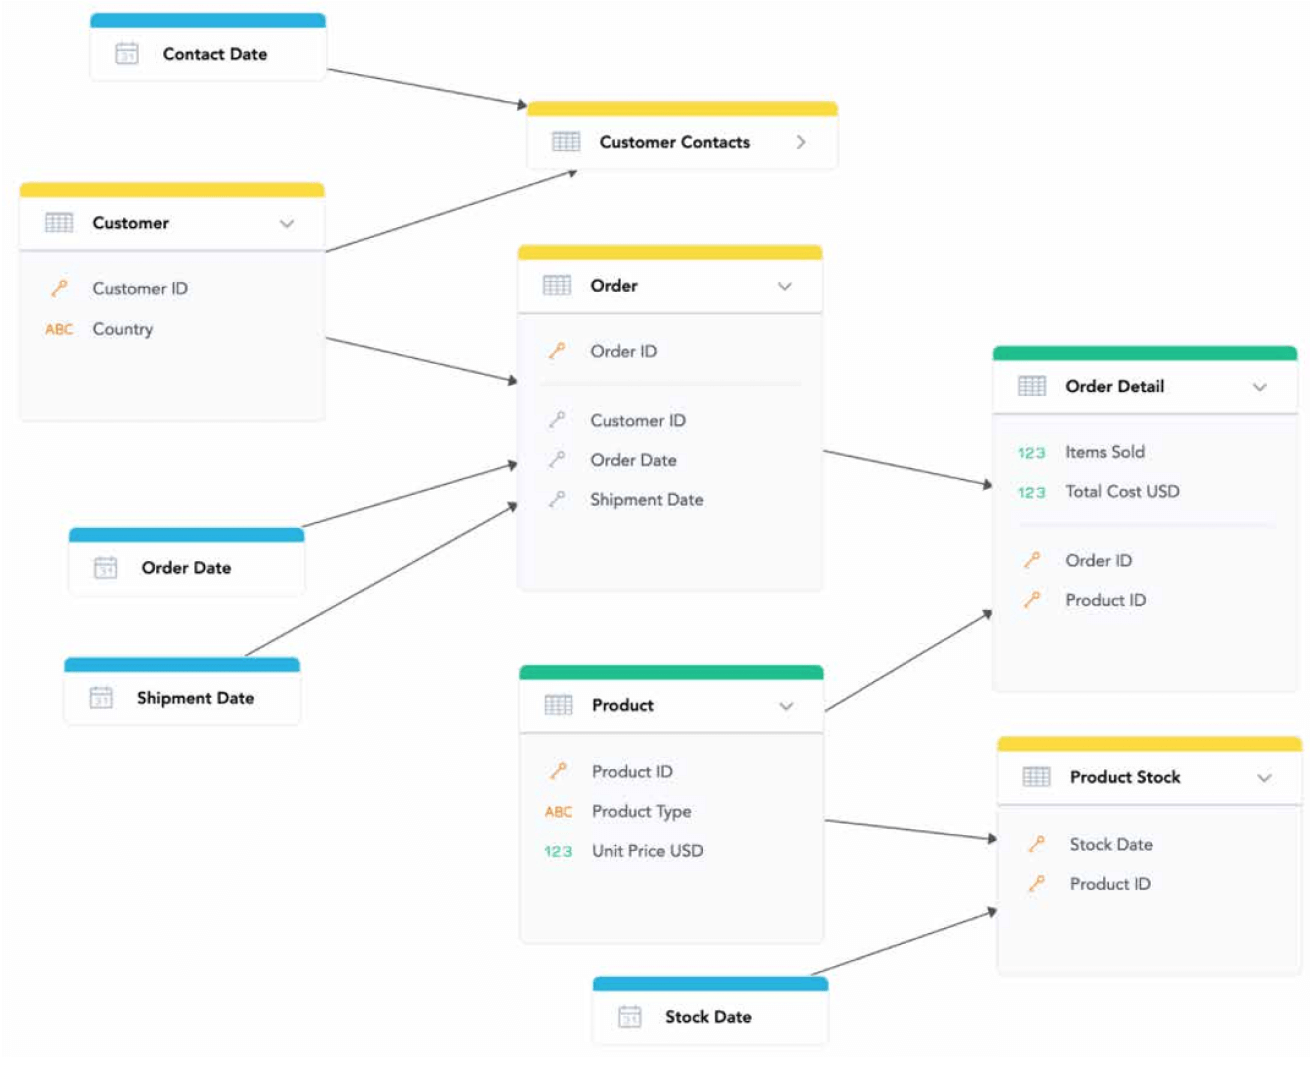
The semantic model serves as a common set of definitions for everyone, including developers, who work on the product. The semantic model includes a contextual logical data model (LDM) and defined calculated measures. The logical data model describes dimensions, facts and their relationships in the semantic model and simplifies complex physical data models into a compact, aggregated analytical model that helps end-users to understand the data. The LDM describes the way your data is structured in the workspace, defines objects and their relationships and therefore, what will be possible to calculate and what will not be possible. Also, it allows the reuse of metrics in different contexts as well as ad-hoc analysis and, as such, is a key part of the analytical solution’s design.
The LDM modeler, ideally web-based so that it’s integrated within the product, coupled with the possibility of data modelling with CSV files, or datasets from your Cloud Datawarehouse, lets you quickly and easily prototype, edit and publish a data model in the analytics platform. This allows you to get up and running quickly, mapping the logical model to physical data, without the lengthy time frame of connecting an external data warehouse or writing long queries.
The web-based LDM modeler brings drag-and-drop functionality to your data analysts and allows them to easily communicate and explain the data model to the rest of the team. And due to it all being integrated into a single interface, data engineers, data analysts, and business users can all collaborate and work together in one unified environment. Thus, you spend less time on setting up analytics within your project, and more time testing and refining your product before roll-out.
User interface integration, seamlessly
Making analytics an inherent part of your product is your ultimate goal. Your customers and users should not see any boundary between your product and analytics. The easiest way to achieve this is to use a single platform with a single SLA and support that brings all the necessary tools for integration of analytics into your product. We have already covered areas that ensure the smooth delivery and operation of the solution. So the questions that follow are - “How do we get our data to the analytics platform?” and “How do we integrate the UI seamlessly into our product and infrastructure?” Which forces you to ask the following questions:
- What data sources do we have and how are planning to query them?
- Do we already have a data warehouse or data lake that runs on Snowflake, Redshift, BigQuery, S3, Athena or something else?
- Do we need integrated login to our product and analytics, or is separate login to a data portal sufficient?
- How should the analytics UI fit to our brand? What styles, fonts or colors will we need?
- Do we need to control interactions between our product and analytics, such as controlling filters or drilling within the product menu?
Unless you are building a standalone analytical application for your business partners that will work fine with a separate login, you will probably want to eliminate any visual or experience boundaries between your product and analytics. This is primarily made possible by two things:
Single-sign-on (SSO) - ensuring that the analytics running within your product, but operated by the 3rd party platform, doesn’t require any other login. The analytical platform ensures automated user and access rights provisioning, so that all users are connected properly.
The most commonly used types of SSO that an embedded analytics platform should support are SAML 2.0-based authentication: Fluig, Okta, Auth0, Salesforce, AD FS. Optionally, the platform might support a PGP-based authentication mechanism based on PGP keys.
Flexible UI embedding - with rich styling and localization options that allow customization of interaction, styling and overall look and feel meeting the UX guidelines of your product perfectly. With the ideal embedded analytics platform, customers won’t be able to recognize that you are OEMing analytics.
Moreover, you will not only be able to integrate analytics that is consumed but also a set of self-service tools, bringing users the power to create their own reports and dashboards. This will bring both innovation and competitive advantage to your product, while allowing fast time-to-market, thanks to all of the aforementioned out-of-the-box tools. And of course, everything is responsive, so you build it once and it works for both desktop and mobile devices.
So what are the different ways of integrating analytical UI into your core application?
Stand-alone analytical portal (white-labeled)
The first, and easiest, option is a stand-alone white-labeled analytical portal adapted to your brand’s look and feel, allowing you to skip UI integration. This is the right choice for companies building analytics portals as standalone products for their business partners or employees, since they don’t have software where the analytics could be integrated. Here you will rely primarily on dashboards and drag-and-drop self-service tools for building reports.
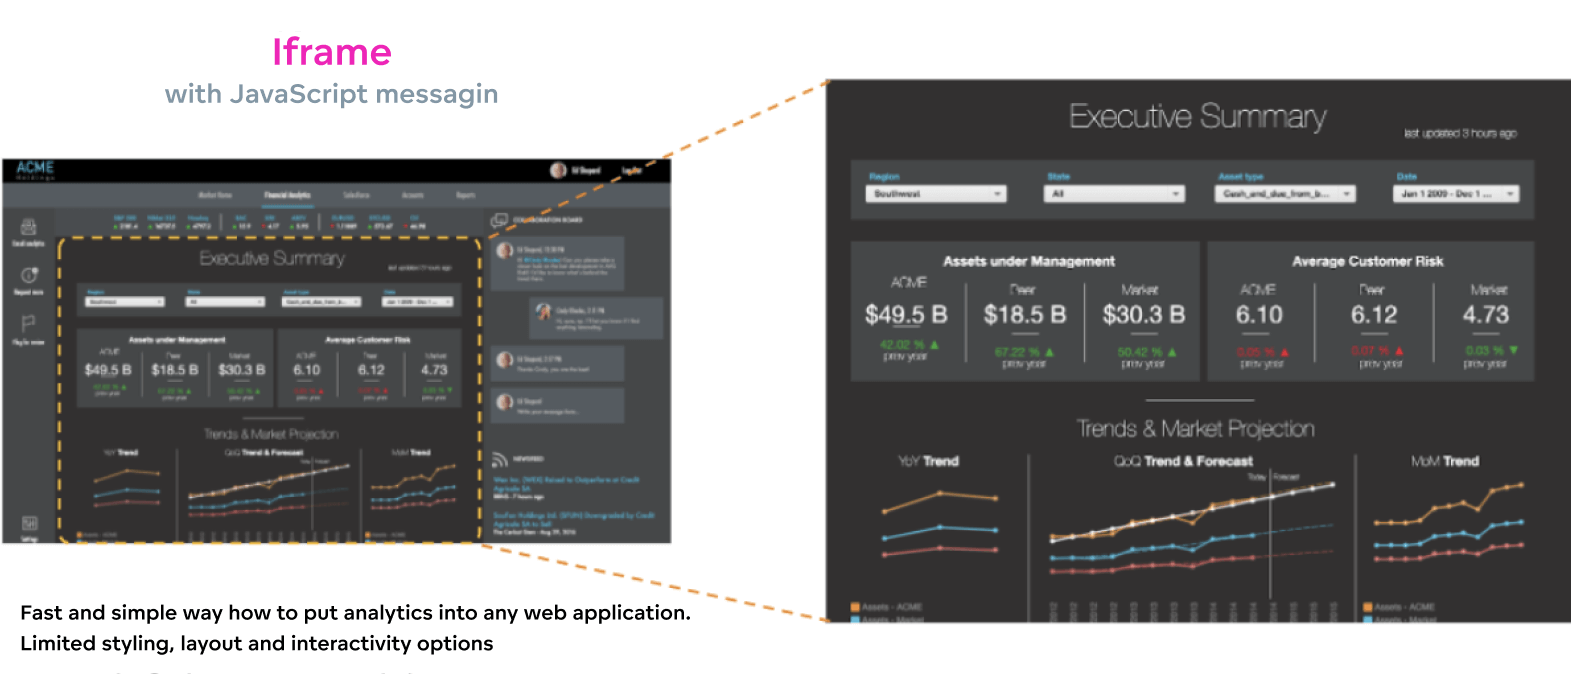
Embedding via iFrame
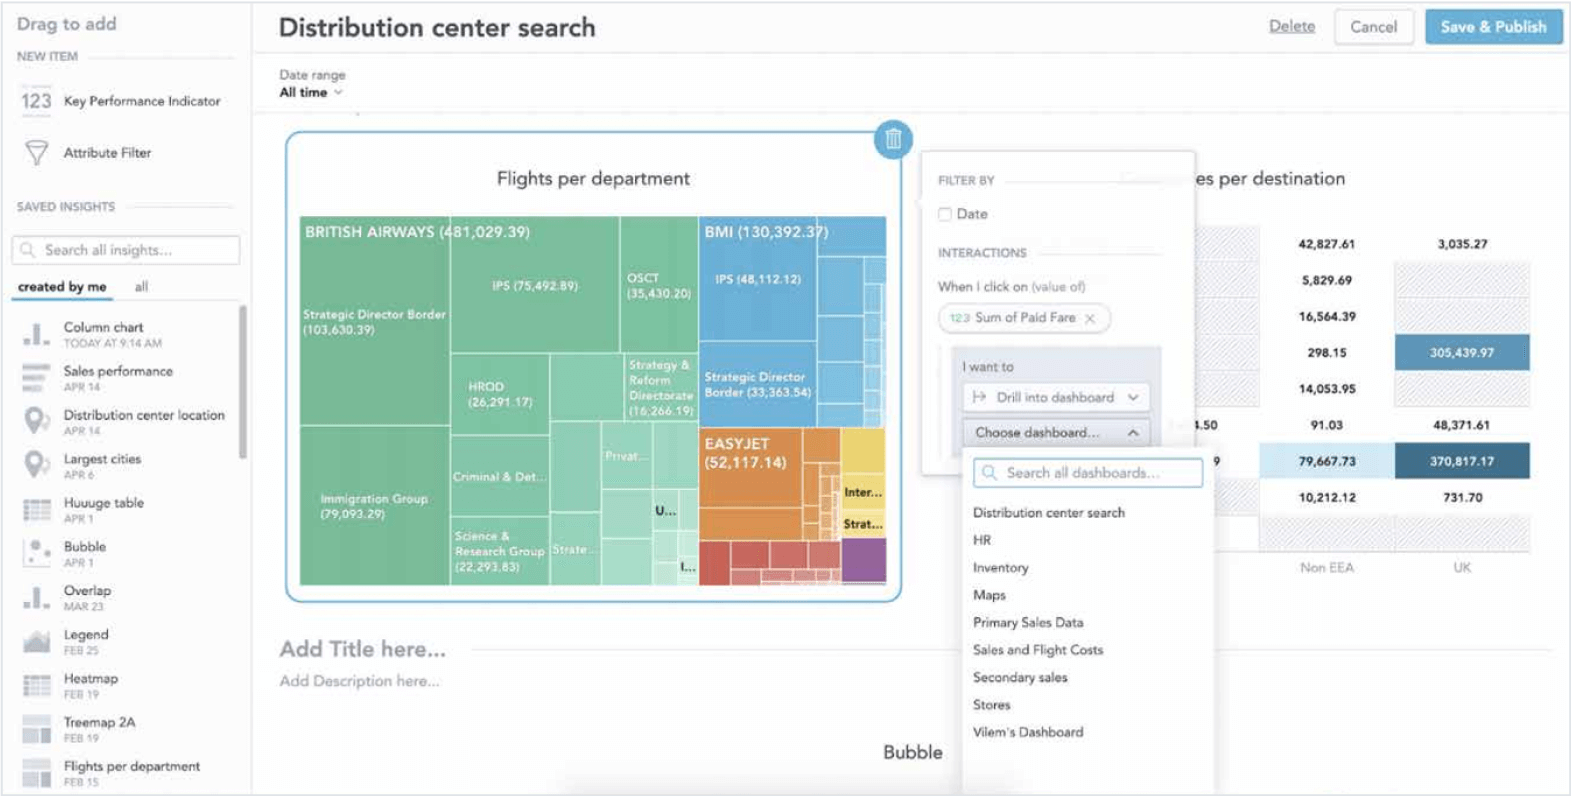
Another option is embedding via iFrame into your application with Single-sign on. You will embed the Analytical Designer to support self-service creation of reports and Dashboards, presenting analytical sections within your product. Embedding via iFrame is the right choice if you wish to enrich your existing product with “analytical” sections or tabs in the menu.
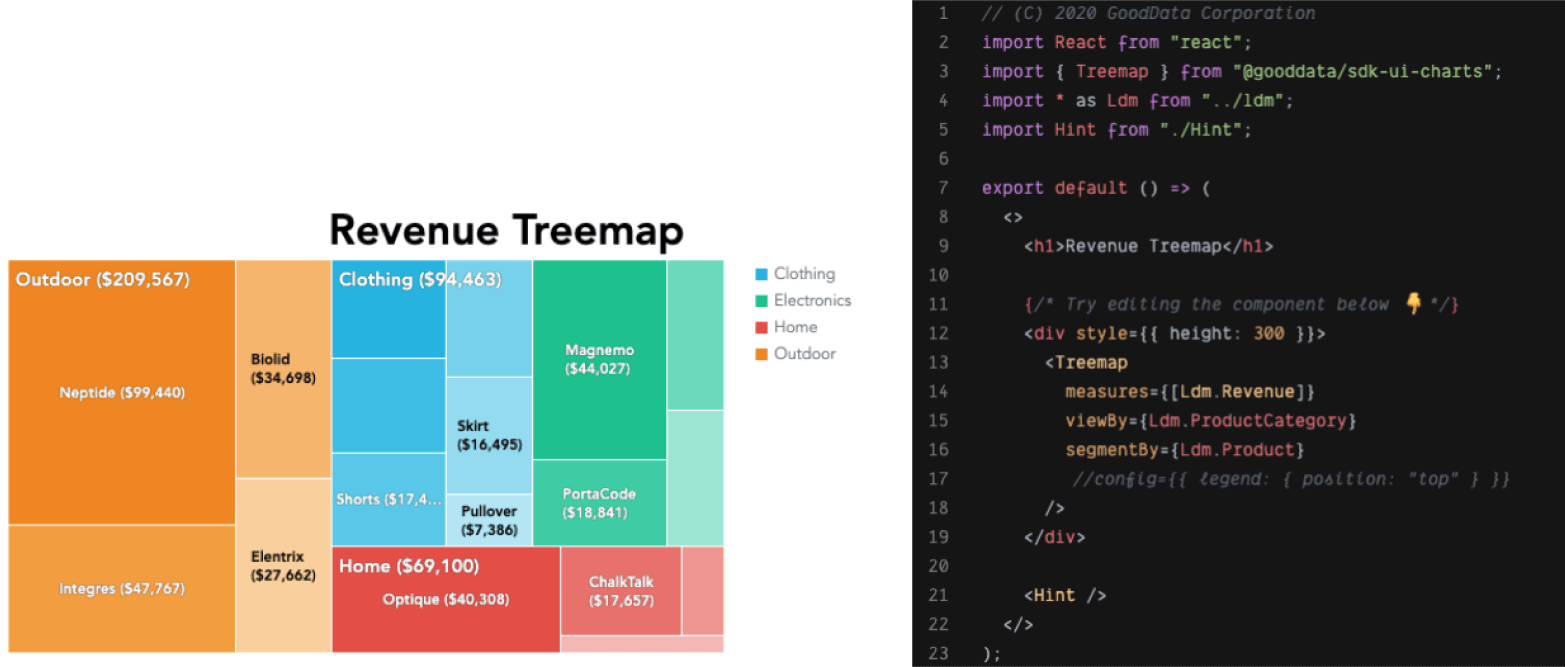
JavaScript based UI SDK
An SDK for front-end development is the state-of-the-art way by which to deeply integrate analytics into your application at the source code level, when insights are embedded as JavaScript front-end components, and custom visualizations are based on the data that was retrieved by executions. This type of SDK is designed to help application developers quickly create and evolve interactive data analytics applications that are tailored to the needs of your users.
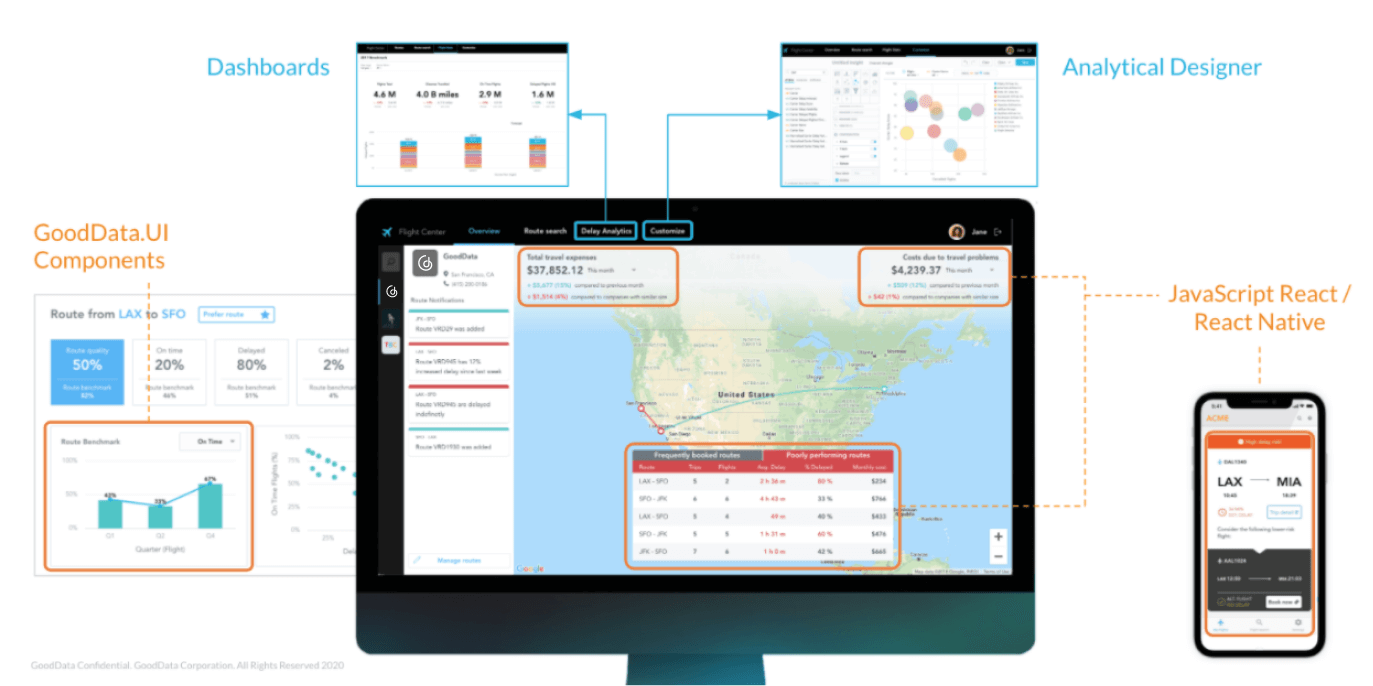
With pre-built components that connect directly to the analytical platform and query engine, your productivity isn’t impacted by waiting on your back-end engineers. You will be up and running quickly with a set of JavaScript (such as React) components with Typescript types, granular packaging, detailed documentation, and interactive code samples.
Integrate with your production data quickly and reliably
Data integration is the most crucial aspect when choosing 3rd party analytics for your software. You are primarily choosing an analytics provider based on their fit with your existing data infrastructure, so that you limit any additional investments, both technological and knowledge based.
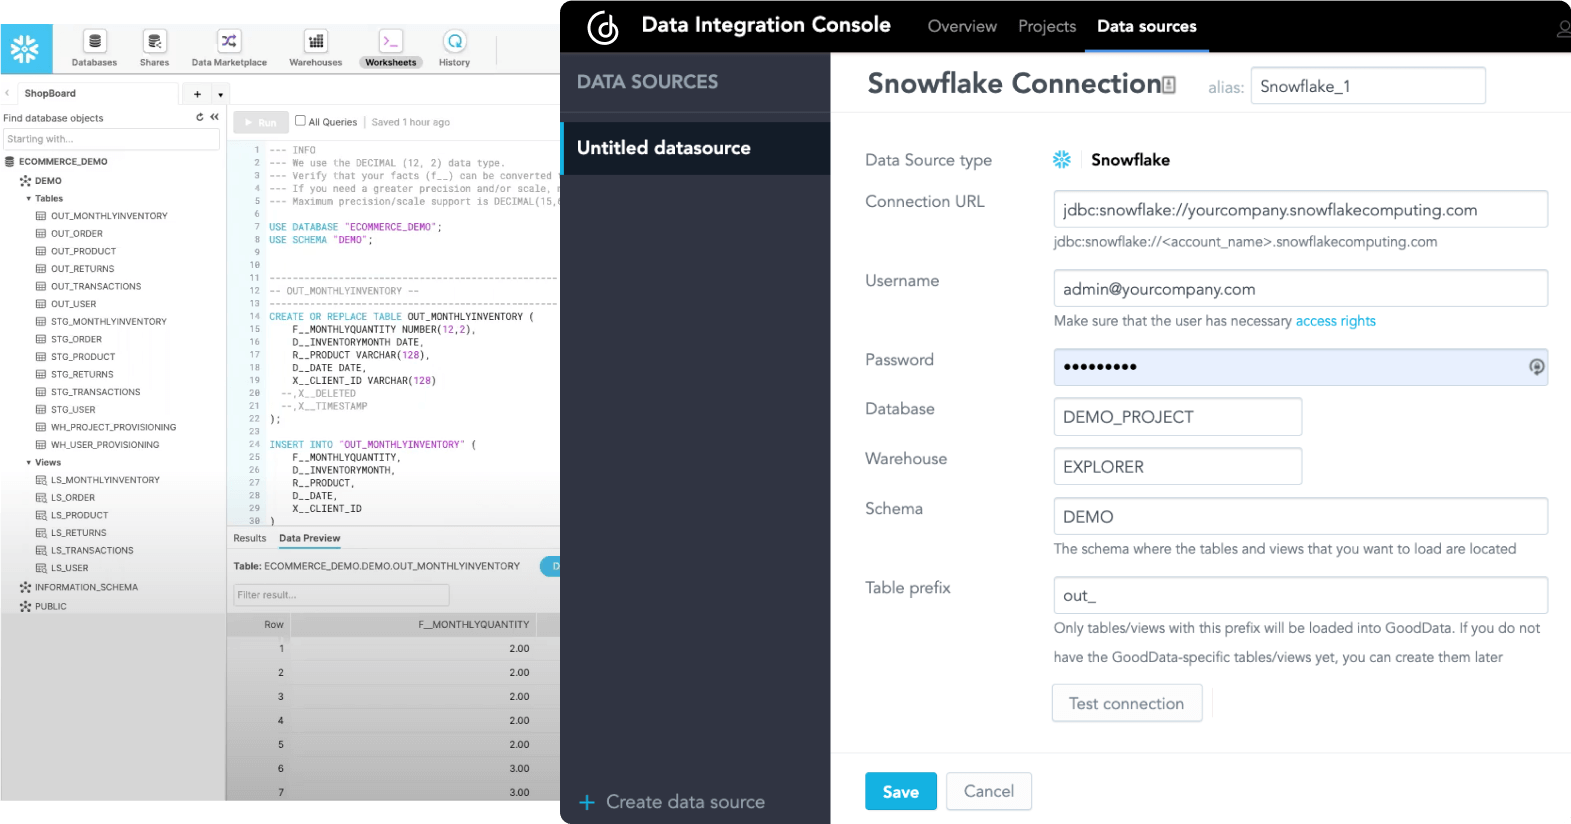
We have already spoken about the LDM modeler that builds the foundation for the semantic model, together with metrics built with a dedicated query language that abstracts the data complexities for common users. The logical data model can be either created from scratch or derived from your data and then modeled according to your needs. So how can you connect your data and map it to your data model? A reliable embedded analytics platform supports various types of data sources:
- Cloud data warehouses, such as Amazon Redshift,Google BigQuery and Snowflake
- CSV files in cloud storage, such as Amazon S3 bucket or manually loaded
- Dedicated pre-built connectors to various systems, platforms and applications
With cloud data warehouse integration, the platform should help you to adjust your source data structure according to the data model, so that data mapping between LDM datasets and tables/views, in your data warehouse, requires as few steps as possible and can be fully automated.
After creating the data model and publishing it to your desired data product, you will set up automated data distribution to regularly update your data model with mapped data from your cloud data warehouse and everything up to date.
A similar process should apply for CSV files, which can be manually uploaded or uploaded via an automated distribution from a cloud storage, such as your Amazon S3 bucket, where your CSV files are stored. In fact, CSV file integration is the way to integrate your embedded analytics platform with any datasource without the need to configure a specific connector. You can simply export your datasets to an S3 bucket and let the platform load them automatically. The platform’s data modeling tool should also suggest a structured template for your files according to your model and automatically map the fields to the attributes within it.
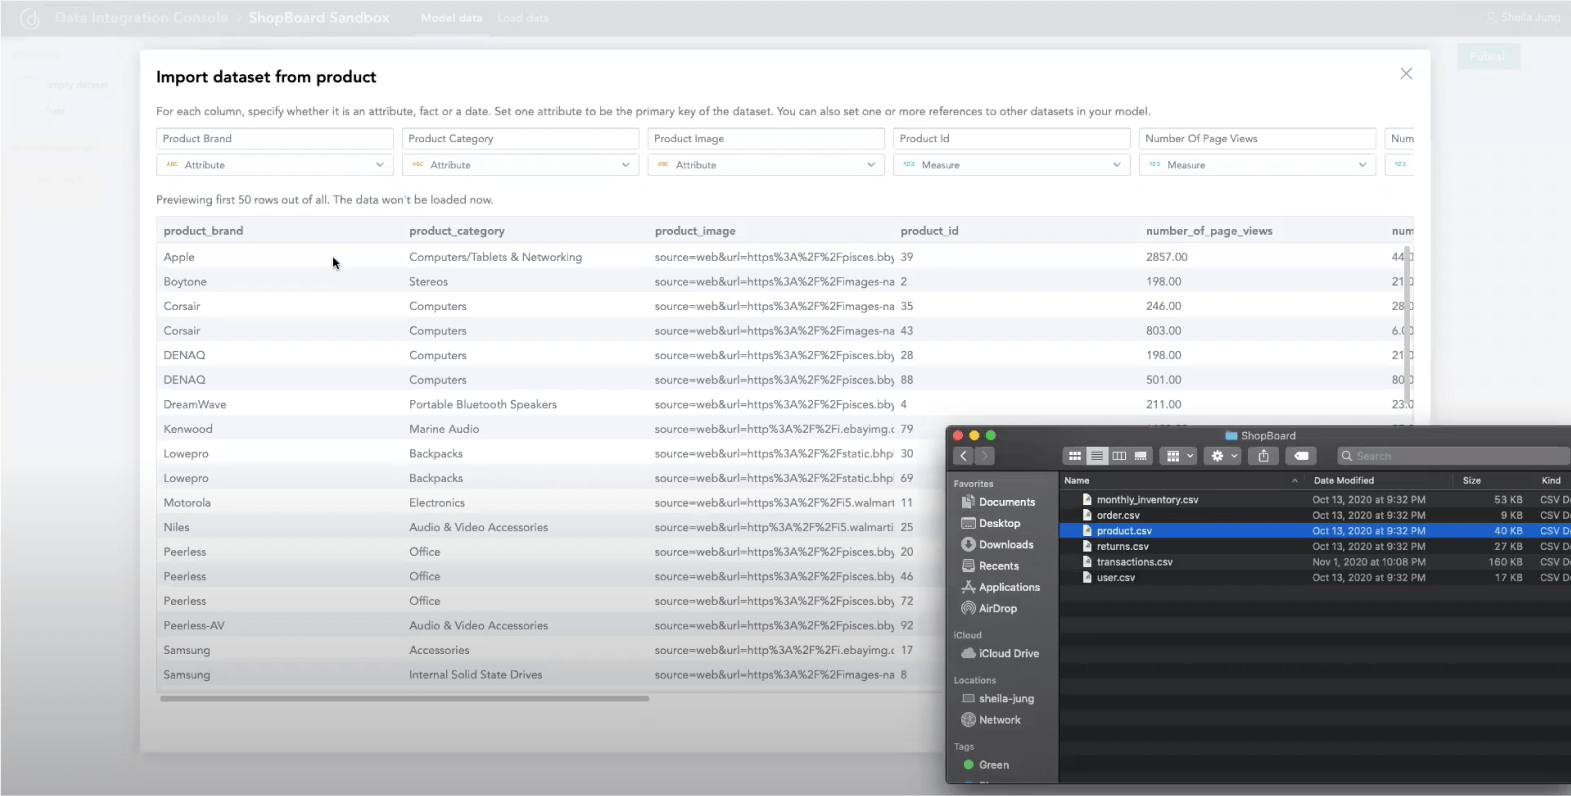
Are you interested in how GoodData works with CSV files to create rich insights? Read our blogpost to learn more.
When working with dedicated pre-built connectors, it’s likely that you won’t operate your own data warehouse. Therefore, the ideal embedded analytics platform should offer data warehousing services to store large amounts of business data coming from your connectors to your operational systems or other data sources. Such warehousing services should be ideally designed for high performance operations to store the full history of your data along with quick data extracts. A typical example are column-oriented database systems.
Enjoy this article as well as all of our content.
Trusted by


Does GoodData look like the better fit?
Get a demo now and see for yourself. It’s commitment-free.