White Papers
Best Data Analytics Tools & Platforms for SaaS Companies: 2026 Comparison Guide
13 min read | Published

About
Not all analytics platforms are built for SaaS products. Of the ten platforms compared in this guide, only a handful are genuinely embedded-first — designed from the ground up to deliver analytics inside a product, isolate customer data at scale, and support monetization without heavy custom engineering.
The platforms that meet this bar share three traits: native multi-tenant architecture, an API-first embedding model, and a governed semantic layer that makes AI-generated insights reliable. Platforms that lack these typically require significant workarounds as usage grows.
This guide compares GoodData, Looker, Tableau Cloud, Microsoft Power BI, Metabase, Qlik Cloud, Omni, Luzmo, Qrvey, and Sigma — evaluated on the criteria that actually matter for SaaS: embedded analytics, multitenancy, AI governance, monetization support, and cost-to-scale.
Click here to go directly to our comparison table of the top SaaS solutions.
Key Takeaways
- Architecture beats visualization: A great charting library means nothing if the platform can't isolate tenant data or scale without custom engineering.
- Only 3 platforms are truly embedded-first: Most tools in this guide treat embedding as a secondary feature: built for internal BI, then adapted for product use.
- AI without governance is a liability: Platforms without a centralized semantic layer produce inconsistent, unreliable AI outputs; look for hallucination prevention baked into the data model.
- Per-user pricing quietly kills SaaS margins: Models used by Looker, Tableau, and Sigma become expensive fast when serving external customers — prioritize predictable cost-to-scale.
- Multitenancy is harder than it looks: Row-level security bolted onto a single-tenant platform is not the same as native tenant isolation; the difference shows at scale.
What Actually Separates SaaS Analytics Platforms in 2026
What actually separates SaaS analytics platforms in 2026 is whether they are built to power analytics inside SaaS products — not just to report on company data.
Many tools labeled as “SaaS analytics platforms” were originally designed for internal business intelligence. They work well for internal dashboards and reporting, but were not built to deliver analytics directly to end users inside an application.
Modern SaaS companies increasingly treat analytics as part of the product experience; customers expect to access insights, track performance, and explore their own data without leaving the application.
At the same time, AI-driven capabilities are becoming a major differentiator. Platforms are no longer evaluated only on dashboards, but on how well they support automated insights, predictive analytics, and intelligent data exploration.
Architecture Matters More Than Visualization
For SaaS analytics, the underlying architecture matters more than charting capabilities. A platform may offer strong visualizations, but that alone does not make it suitable for a SaaS product.
To work inside a product environment, analytics must:
- Integrate directly into the application.
- Support secure access across many customers.
- Scale without constant engineering effort.
Without the right architecture, teams often spend more time maintaining dashboards and infrastructure than improving the product itself.
It pays to adopt a data product mindset in which analytics are built as reusable, modular components, enabling SaaS teams to scale faster.
The Core Question for SaaS Teams
When evaluating analytics platforms, the most important question is simple:
Can the platform turn SaaS product analytics into a monetizable product feature, or will your team need to build and maintain large parts of the analytics stack yourself?
Many traditional BI tools can create dashboards, but supporting embedded analytics at scale often requires significant custom development and ongoing maintenance.
The most effective platforms are designed for embedding from the start rather than being adapted from internal BI tools. They allow teams to package insights for different customer tiers and scale as usage grows.
Critical Requirements: Evaluation Criteria for SaaS Analytics Platforms
When evaluating analytics platforms for an SaaS product, teams should focus on several core capabilities: cloud-native architecture, embedded analytics, multi-tenant data isolation, monetization features, AI and predictive analytics, a governed semantic layer, predictable cost-to-scale, and real-time performance. These factors determine whether analytics can be delivered reliably as the product and customer base grow.
1. Cloud-Native Architecture
A cloud-native architecture allows analytics platforms to scale automatically while minimizing infrastructure management. This is essential for SaaS environments where usage and data volumes can grow quickly.
Key characteristics include:
- Fully managed infrastructure with automatic updates.
- Elastic scalability to support growing workloads.
- Global availability for distributed users.
- Faster deployment compared to on-premise systems.
Cloud-native platforms allow product teams to focus on building features instead of maintaining infrastructure.
A common warning sign is a legacy platform originally designed for on-premise deployment that was later adapted for the cloud.
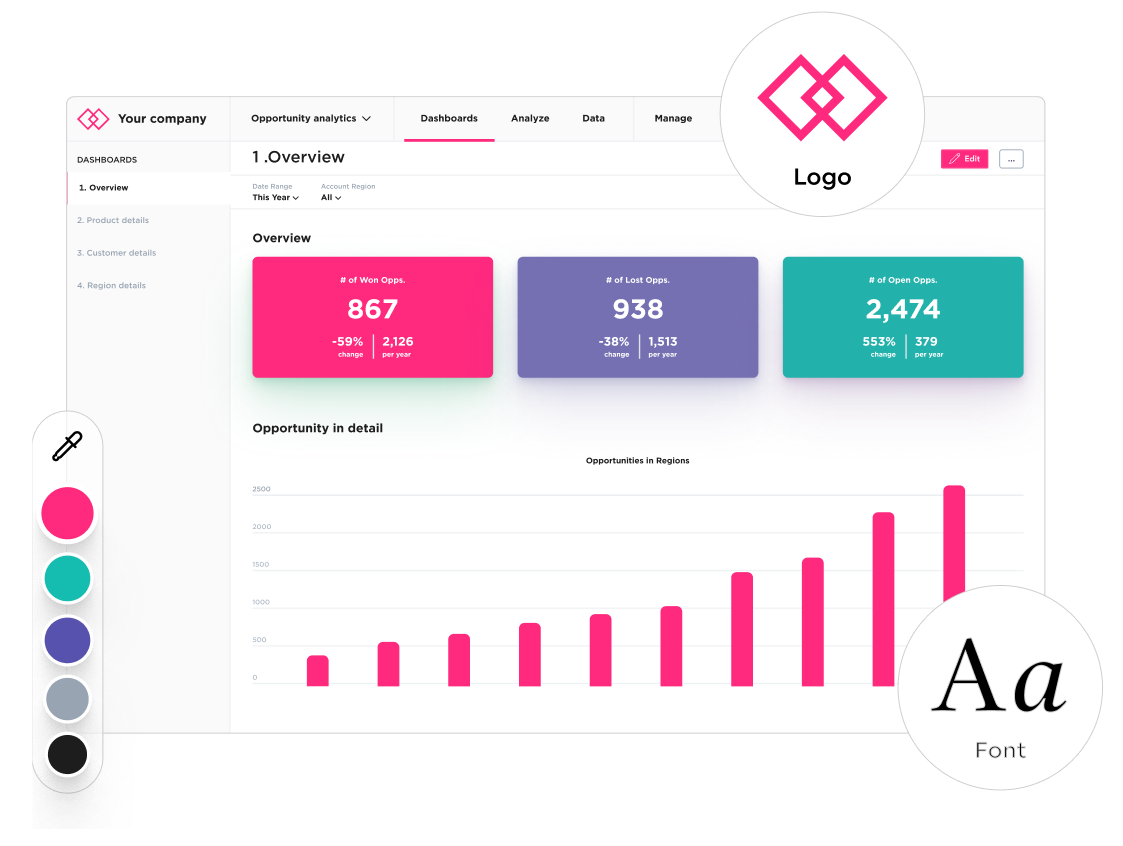
2. Embedded Analytics Capabilities
Embedded analytics allows insights to be delivered directly inside an application instead of through separate reporting tools.
Important capabilities include:
- Seamless integration within the application interface.
- White-label options that match the product’s design so the experience feels like a single, unified product.
- API-first architecture for developers.
- Low-code or no-code configuration for product teams.
The embedded analytics market is projected to grow to $86.2 billion by 2034, reflecting the growing expectation among SaaS buyers that analytics is a built-in product capability rather than a bolt-on.
3. Multitenancy & Data Isolation
Multitenancy is essential for B2B SaaS products where many customers share the same infrastructure.
A strong multi-tenant architecture should provide:
- Secure separation of customer data.
- Consistent performance across thousands of tenants.
- Clear governance and permission management.
- Compliance with standards such as GDPR, SOC 2, and HIPAA.
Platforms that rely on single-tenant deployments can become expensive and difficult to operate at scale.
4. Monetization Features
With the right solution, analytics can become a revenue-generating feature within a product.
Capabilities that support monetization include:
- Usage-based pricing models.
- Tiered analytics features for different customer segments (e.g., read-only access, self-service analytics, or premium AI features).
- Premium analytics add-ons.
- Visibility into analytics usage and adoption.
These capabilities allow companies to package analytics as part of their product offering.
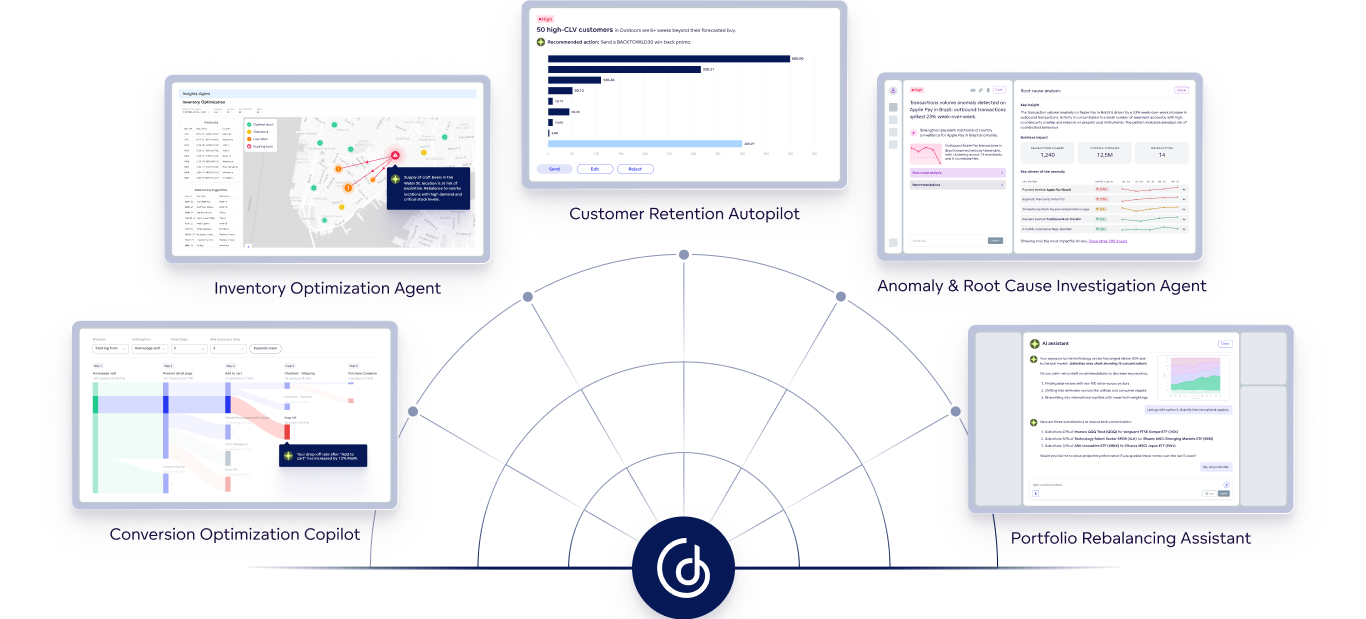
5. AI and Predictive Capabilities
The best SaaS analytics solutions support AI throughout the analytics lifecycle, from data preparation to insights and predictive analysis.
Common capabilities include:
- Automated insights and recommendations.
- Predictive models for churn detection and prevention.
- Anomaly detection and alerting.
- Natural language queries for data exploration.
- Autonomous agents that analyze trends and suggest action.
Reliable AI also requires built-in governance so that insights are based on consistent business metrics and meet compliance requirements.
6. Semantic Layer & Reusable Metrics
A semantic layer defines business metrics and data relationships in a centralized model.
Key benefits include:
- Shared definitions of metrics across dashboards and reports.
- Consistent interpretation of data across teams and customers.
- Self-service analytics without requiring SQL.
- Reduced duplication of logic across analytics assets.
Without a semantic layer, organizations often end up with conflicting metric definitions and duplicated calculations.
7. Cost-to-Scale & Unit Economics
The pricing model of an analytics platform can significantly affect SaaS unit economics.
Key factors to consider include:
- Predictable pricing as usage grows.
- Per-user versus consumption-based pricing models.
- Additional costs such as compute, storage, or support.
- The impact of analytics usage on product margins.
A scalable pricing model ensures analytics adoption does not dramatically increase operating costs.
8. Real-Time Analytics Performance
Performance is critical when analytics is integrated directly into a product.
A strong analytics platform should support:
- Fast query response times.
- Live dashboards and frequent data updates.
- Efficient caching and query optimization.
- Stable performance under heavy usage.
Fast analytics improves the overall product experience and encourages users to interact with data more frequently.
Best SaaS Analytics Tools & Platforms: Comparison Table
The table below provides a side-by-side comparison of the best analytics platforms used by SaaS companies today. It highlights how each tool performs across the key capabilities discussed in this guide, including cloud architecture, embedded analytics, AI capabilities, scalability, and cost-to-scale.
Detailed Platform Reviews: Which Analytics Tool Is Best for SaaS Companies?
This section takes a closer look at the leading analytics platforms (GoodData, Looker, Tableau Cloud, Microsoft Power BI, Metabase, Qlik Cloud, Omni, Luzmo, Qrvey, and Sigma). We review each solution’s key features, strengths, and limitations, with a focus on how well it supports analytics within SaaS products.
GoodData
Best For: B2B SaaS companies that need fully embedded, white-labeled analytics with monetization capabilities.
Key Features
- Governed semantic layer for consistent metrics across dashboards and applications.
- Flexible monetization support, including usage-based pricing and tiered analytics packages.
- Agentic AI capabilities with hallucination prevention through governed semantic context.
- White-label customization and API-first architecture for seamless product integration.
- Zero-copy, cloud-native architecture designed for modern data stacks.
Ideal for embedding analytics directly into SaaS products.
Cons
May require an initial setup investment compared to more basic SaaS reporting tools.
Strong multi-tenant architecture (with secure data isolation) ensures scalability.
Cons
Comprehensive AI capabilities grounded in governed metrics.
Cons
Strong developer experience with robust APIs and integrations.
Cons
Predictable cost-to-scale model suitable for SaaS environments.
Cons
Reusable semantic (governance) layer reduces development time and maintenance.
Cons
Metabase
Best For: Early-stage startups and internal analytics teams looking for a lightweight, self-hosted BI solution for smaller use cases.
Key Features
- Hosted by Metabase or a self-hosted option with very limited capabilities.
- Simple query builder.
- Basic embedding capabilities.
- Straightforward SQL interface.
Free open-source version (with very limited capabilities).
Cons
Limited enterprise features.
Easy to get started.
Cons
Lack of robust white-labeling options.
Suitable for internal analytics and smaller external use cases.
Cons
Limited AI and predictive capabilities.
Low upfront cost.
Cons
No centralized semantic layer.
Cons
Infrastructure, scaling, and maintenance costs can increase over time.
Cons
Engineering resources are required for embedding and tenant management.
Qlik Cloud
Best For: Enterprises that require complex data exploration.
Key Features
- Associative analytics engine.
- Cloud-native platform.
- Embedded analytics capabilities (iframes, APIs, JavaScript SDK).
- AI-powered insights.
Unique associative analytics model for exploring data relationships.
Cons
Steeper learning curve.
Strong data integration capabilities.
Cons
No single centralized semantic layer; Qlik works with apps, and each app can have its own data model and metric definitions.
AutoML features.
Cons
Expensive at enterprise scale.
Good engineering control over the platform.
Cons
Embedding is less streamlined than platforms built specifically for embedded analytics.
Extensive user permission controls with the ability to create custom roles.
Cons
Multitenancy requires careful architectural design.
Cons
Embedded user experience still reflects Qlik’s native analytics interface.
*See how Qlik compares to GoodData in this comparison guide.
Omni
Best For: Data teams that prefer a SQL-native approach.
Key Features
- SQL-first analytics platform.
- Cloud-native architecture.
- Data modeling layer.
- Basic embedding capabilities.
- Developer-oriented deployment model.
Clean, modern interface.
Cons
Limited track record with large-scale SaaS embedding; embedding is only available via iframes, which limits customization options.
SQL-centric approach appeals to engineers.
Cons
Fewer enterprise features than more established platforms.
Growing platform with modern architecture.
Cons
Multitenancy support is still maturing (row-level security and model-level access control)
Reasonable pricing.
Cons
Limited AI capabilities.
In-platform version control (very developer-friendly).
Cons
Not purpose-built for customer-facing analytics.
Luzmo
Best For: SaaS companies wanting fast time-to-market for embedded dashboards, particularly smaller companies and startups.
Key Features
- Multitenancy support via row-level access and database filtering.
- White-labeling options.
- API-first design.
- Pre-built components.
- Seamless integrations with applications.
Fast implementation for basic embedded use cases.
Cons
May hit limitations with more sophisticated use cases; performance issues can arise as data volume and user base increase.
Good developer experience.
Cons
Limited advanced AI capabilities.
Reasonable pricing for smaller deployments.
Cons
Smaller ecosystem and community.
Designed to handle B2B SaaS embedding scenarios.
Cons
Semantic layer is less comprehensive than other solutions like GoodData (functionality is limited).
SQL-based data modeling within the platform.
Cons
Microsoft Power BI
Best For: Companies standardized on the Microsoft stack and Azure.
Key Features
- Deep integration with Microsoft 365, Copilot, and Azure.
- Power BI Embedded for white-labeling.
- Power Query for data preparation.
- Large Microsoft community.
Cost-effective for small teams; Power BI licenses are often included within existing Microsoft licensing with minimal additional cost.
Cons
Multitenancy challenges at scale: there is no self-service for end users, so when reports need modification, customers typically must request changes from data teams.
Growing AI capabilities through Copilot and Microsoft Fabric.
Cons
Performance can degrade with heavy embedding.
Embedding available through a separate license using iframes and the JavaScript SDK.
Cons
Limited monetization support.
Cons
Potential Microsoft ecosystem lock-in.
Cons
Steep learning curve for the DAX metric modeling language.
Cons
Very limited customization and white-labeling in embedded use cases. The result often feels like a Power BI dashboard embedded into the product rather than a native product experience
Cons
Version control and CI/CD capabilities are less developer-centric than composable SaaS analytics platforms.
*See how Power BI compares to GoodData in this comparison guide.
Qrvey
Best For: SaaS companies with limited technical resources that want a no-code or low-code approach to embedded analytics.
Key Features
- No-code analytics builder.
- Multi-tenant architecture with simple role-based access control.
- Survey and data collection tools.
- White-label capabilities.
Good for straightforward use cases; it’s optimized for simplicity rather than extreme flexibility
Cons
Limited flexibility for complex requirements.
No-code approach reduces development time.
Cons
Smaller market presence.
Faster implementation compared to general BI platforms.
Cons
May lack advanced features found in more established platforms.
Built for embedding from the start.
Cons
AI capabilities are less mature, with very limited functionality.
Cons
Customization constraints due to the no-code approach.
Tableau Cloud
Best For: Internal analytics teams that need powerful visualization capabilities, particularly organizations using Salesforce.
Key Features
- Fully managed SaaS deployment.
- Large library of chart types and visualization options.
- Embedded analytics through Tableau Embedded Analytics (iframes and JavaScript APIs).
- Some predictive analytics capabilities.
Industry-leading visualization engine.
Cons
Not designed specifically for embedded SaaS use cases.
Intuitive drag-and-drop interface for building dashboards.
Cons
No true multi-tenant architecture; deployments often rely on separate workbooks per tenant.
Large community and extensive learning resources.
Cons
Lack of a unified semantic layer can lead to inconsistent metric definitions and duplicated logic,
Wide range of data connectors.
Cons
Managing large numbers of B2B tenants can increase administrative overhead and governance complexity.
AI-powered features for data discovery, including generative AI, natural language queries, and statistical forecasting tools.
Cons
User interface remains tightly coupled to the Tableau experience,
Cons
Licensing can become expensive for customer-facing deployments due to tiered and user-based pricing.
Cons
Performance at scale often depends on the underlying data warehouse.
Cons
Limited support for analytics monetization strategies.
*See how Tableau compares to GoodData in this comparison guide.
Sigma
Best For: Teams that want spreadsheet familiarity in cloud analytics.
Key Features
- Spreadsheet-like interface.
- Cloud-native data warehouse connectivity.
- Embedded analytics options (iframes, APIs).
- Collaborative analytics.
Good for business users.
Cons
Embedding capabilities are less mature than in other platforms.
Familiar spreadsheet paradigm.
Cons
Multitenancy support is still developing (relies on warehouse-level security).
No SQL required for basic analysis.
Cons
Limited white-labeling options.
Cloud-native architecture.
Cons
Higher learning curve than expected for complex use cases.
AI-assisted features.
Cons
Operational overhead increases with tenant count; per-user pricing models may impact SaaS unit economics when scaling external users.
Looker (Google Cloud)
Best For: Companies heavily invested in Google Cloud Platform, particularly data engineering teams and internal analytics environments. It can support external use cases, though self-service capabilities for end users are more limited.
Key Features
- LookML semantic modeling layer for defining metrics and data relationships.
- Strong data modeling capabilities for complex datasets.
- Native integration with Google BigQuery.
- Embedded analytics through iframes, JavaScript SDK, and API-driven content embedding.
- AI capabilities through the broader Google Cloud ecosystem.
Powerful platform for data modeling and governed analytics.
Cons
Can become expensive as usage scales.
Strong integration with Google Cloud services.
Cons
Limited white-labeling and customization compared to platforms designed specifically for embedded analytics.
Flexible embedding options via iframes, JavaScript SDK, and APIs.
Cons
Deep control over product UX typically requires additional engineering work
Well-suited for technical teams familiar with LookML.
Cons
Monetization features are limited.
Established platform with a large user community.
Cons
Acquisition by Google may introduce vendor lock-in concerns.
Access to Google’s AI ecosystem, including Vertex AI and Gemini-powered capabilities.
Cons
Steep learning curve, particularly due to the LookML modeling language.
Cons
Multitenancy is typically implemented using row-level security and user groups, which can become complex at scale.
Cons
Performance isolation may require architectural workarounds, and user-based pricing can increase costs as the user base grows.
*See how Looker compares to GoodData in this comparison guide.
Why GoodData Is the Best Analytics Solution for SaaS Companies
GoodData is the best analytics solution for SaaS companies because it is composable and built for embedded analytics, enables governed AI that doesn’t hallucinate, and has a proven track record with SaaS companies.
Built Specifically for Embedded SaaS Analytics
GoodData provides the core capabilities required to deliver analytics inside SaaS products.
Key capabilities include:
- Embedded-first architecture: Built to integrate analytics directly into SaaS products rather than adding embedding as a secondary feature.
- True multitenancy: Native tenant isolation supports thousands of customers securely and efficiently.
- Monetization-ready analytics: Usage tracking and tiered analytics packages allow teams to package analytics as a product feature.
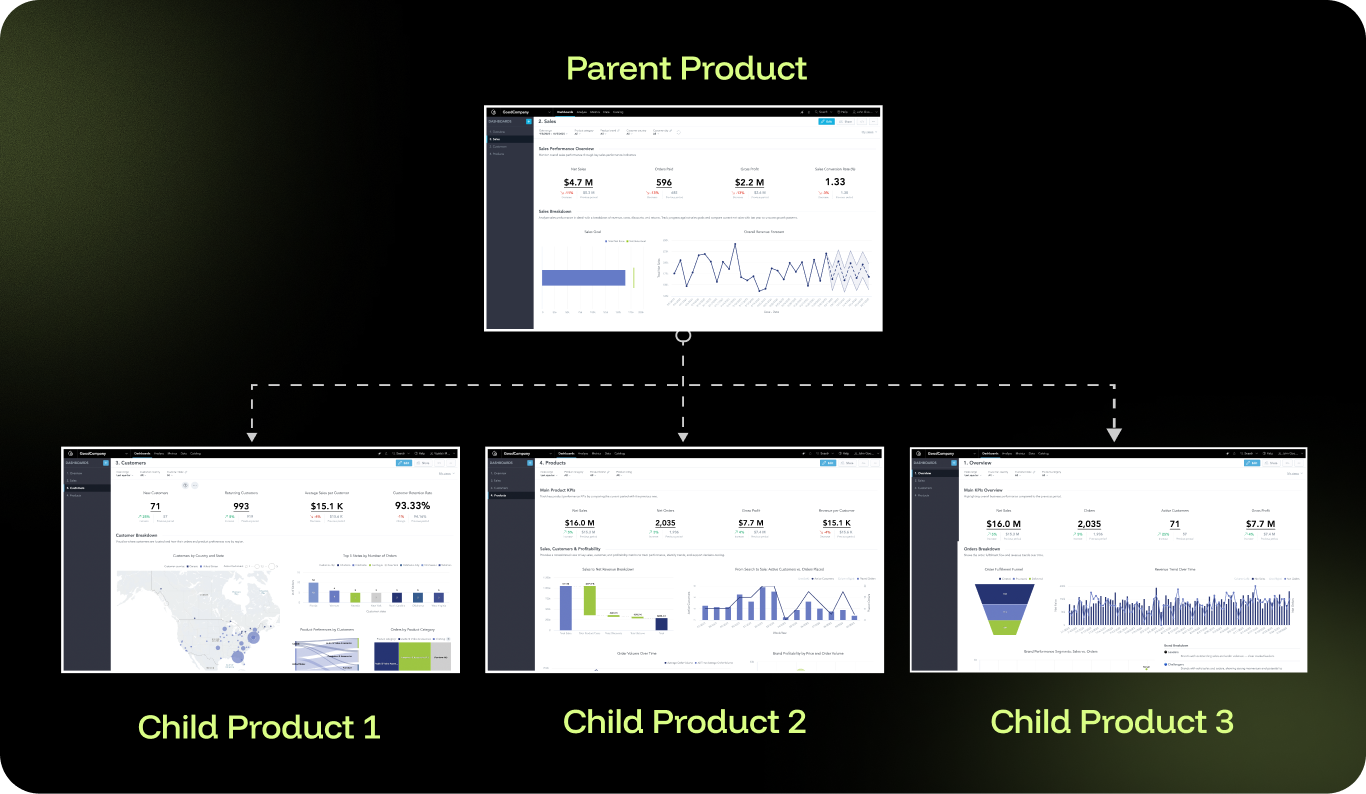
The Composable Analytics Advantage
GoodData’s composable approach allows SaaS teams to integrate analytics capabilities without building and maintaining a full BI stack.
Key advantages include:
- Not building from scratch: Teams can deliver enterprise-grade analytics without becoming a BI vendor.
- Developer-friendly architecture: APIs, SDKs, and documentation support seamless product integration.
- Future-ready platform: Continuous innovation across AI capabilities, cloud infrastructure, and analytics performance.
Governed AI Without Hallucinations
GoodData combines AI-driven analytics with governed data models to ensure reliable insights.
Key capabilities include:
- Agentic analytics: Enables companies to build agents that analyze data, detect patterns, and recommend actions.
- Hallucination prevention: A governed semantic layer and deterministic query engine provide AI-generated insights you can trust.
- Reusable metrics: Consistent metric definitions across analytics and AI workflows.
Proven Results With SaaS Companies
GoodData is used by SaaS companies that need to deliver customer-facing dashboards, product usage insights, and data-driven features.
Examples of organizations that use GoodData to turn analytics into a core product capability include:
- Stackless: A data readiness platform that delivers embedded analytics directly to customers. GoodData helps Stackless automate analytics delivery and reduce manual data preparation. This has cut manual workload by 80% and contributed to average annual cost savings of $300K for clients.
- BlackHyve: A project management solution that uses GoodData to power embedded analytics for its customers. GoodData has helped BlackHyve deliver interactive dashboards that provide real-time visibility into project performance and operational metrics. The solution was implemented in 8 weeks and helps teams save 2 to 4 hours per week.
Schedule a personalized demo to see how GoodData can help you.
Frequently Asked Questions About SaaS Analytics
What is B2B SaaS analytics?
B2B SaaS analytics refers to the tools and processes used to analyze data generated by a SaaS product used by business customers. It helps companies track product usage, customer behavior, and business performance. SaaS data analytics typically supports both internal decision-making and customer-facing insights delivered through dashboards, reports, or embedded analytics within the application.
Which analytics app is best for SaaS companies?
The best saas data analytics software depends on how analytics will be used inside the product. Platforms designed for embedded analytics with a scalable architecture are typically better suited for SaaS environments. These tools allow companies to integrate analytics directly into their applications while supporting large numbers of customers.
What is embedded analytics for SaaS?
Embedded analytics for SaaS refers to analytics capabilities that are integrated directly into a software application rather than delivered through a separate analytics tool. This allows SaaS companies to provide dashboards, reports, and interactive data exploration within the product interface. By embedding analytics into the application, companies can give customers direct access to insights without requiring them to leave the platform.
Can I build my own SaaS dashboards?
SaaS companies can build their own dashboards, but this often requires significant engineering effort. Building an internal analytics system means maintaining data pipelines, dashboards, permissions, and infrastructure. Many companies choose to use analytics platforms instead, allowing them to deliver analytics features without developing a full BI system from scratch.
What are the key metrics for SaaS analytics?
Common SaaS analytics metrics include monthly recurring revenue (MRR), customer acquisition cost (CAC), customer lifetime value (LTV), churn rate, and product usage metrics. These metrics help SaaS companies understand growth, retention, and overall product performance.
How does a SaaS company prevent churn with analytics?
Analytics helps SaaS companies identify early signals of churn by analyzing usage patterns, engagement levels, and customer behavior. Predictive analytics models can detect churn risk, feature adoption issues, or support trends, allowing teams to intervene early with targeted onboarding, support, or product improvements.
Trusted by


Does GoodData look like the better fit?
Get a demo now and see for yourself. It’s commitment-free.