Why You Should Focus on Responsive Dashboards over Flexibility When It Comes to Analytics
2 min read | Published


We’ve all seen the BI tools out there that advertise almost infinite flexibility when working with your data. Sure, flexibility is great and can certainly be helpful, but have you ever been confronted with too much flexibility? Probably not, because most experiences are tailored for use by non-experts. For instance, imagine if every time you wanted to listen to music, you had to create something from scratch by using something like this.

Sure, this offers you more flexibility than just opening up Spotify, but do you really know how to work with something like this? Or think back to the last time you built and customized a dashboard to track your fantasy football performance or access certain insights in your bank’s portal. How was your experience? I’m willing to bet it was awful. I certainly don’t remember ever having a good user experience when building dashboards—and I’m much more comfortable building them than most!
Want to see what GoodData can do for you?
Get a guided tour and ask us about GoodData’s features, implementation, and pricing.
Request a demoDesigning dashboards for business use
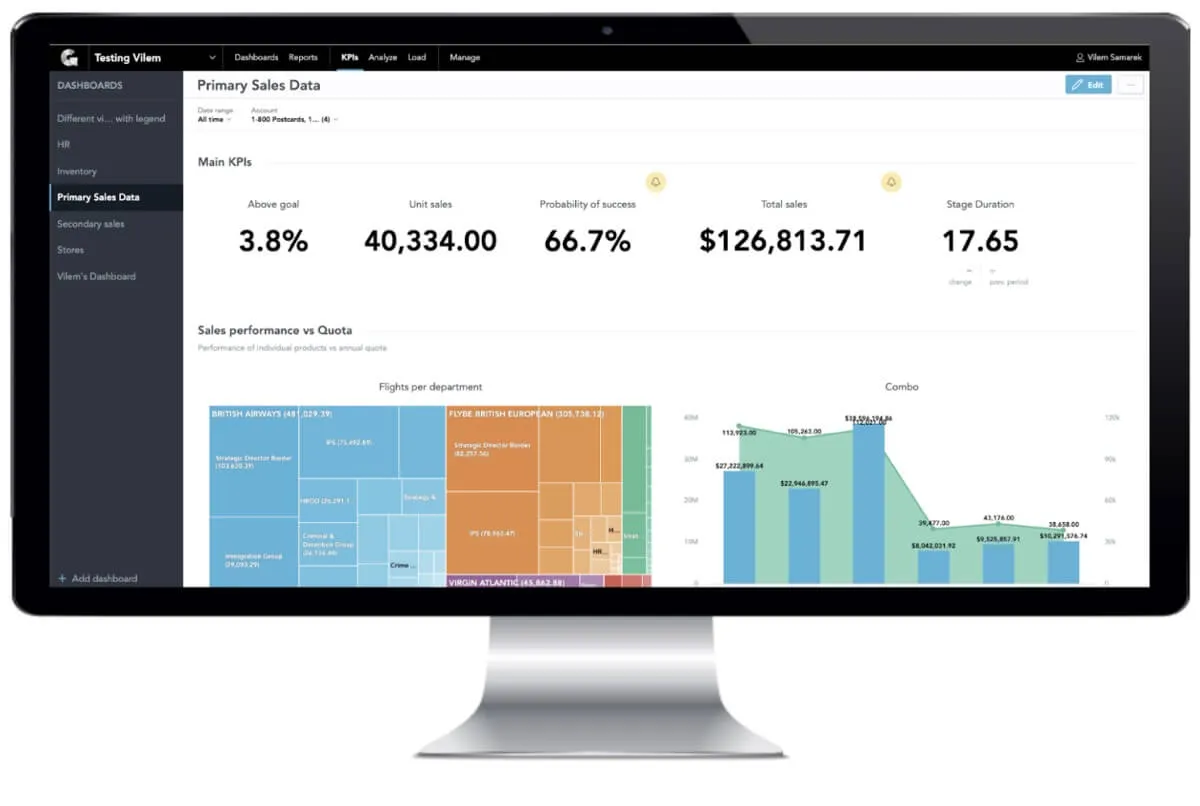
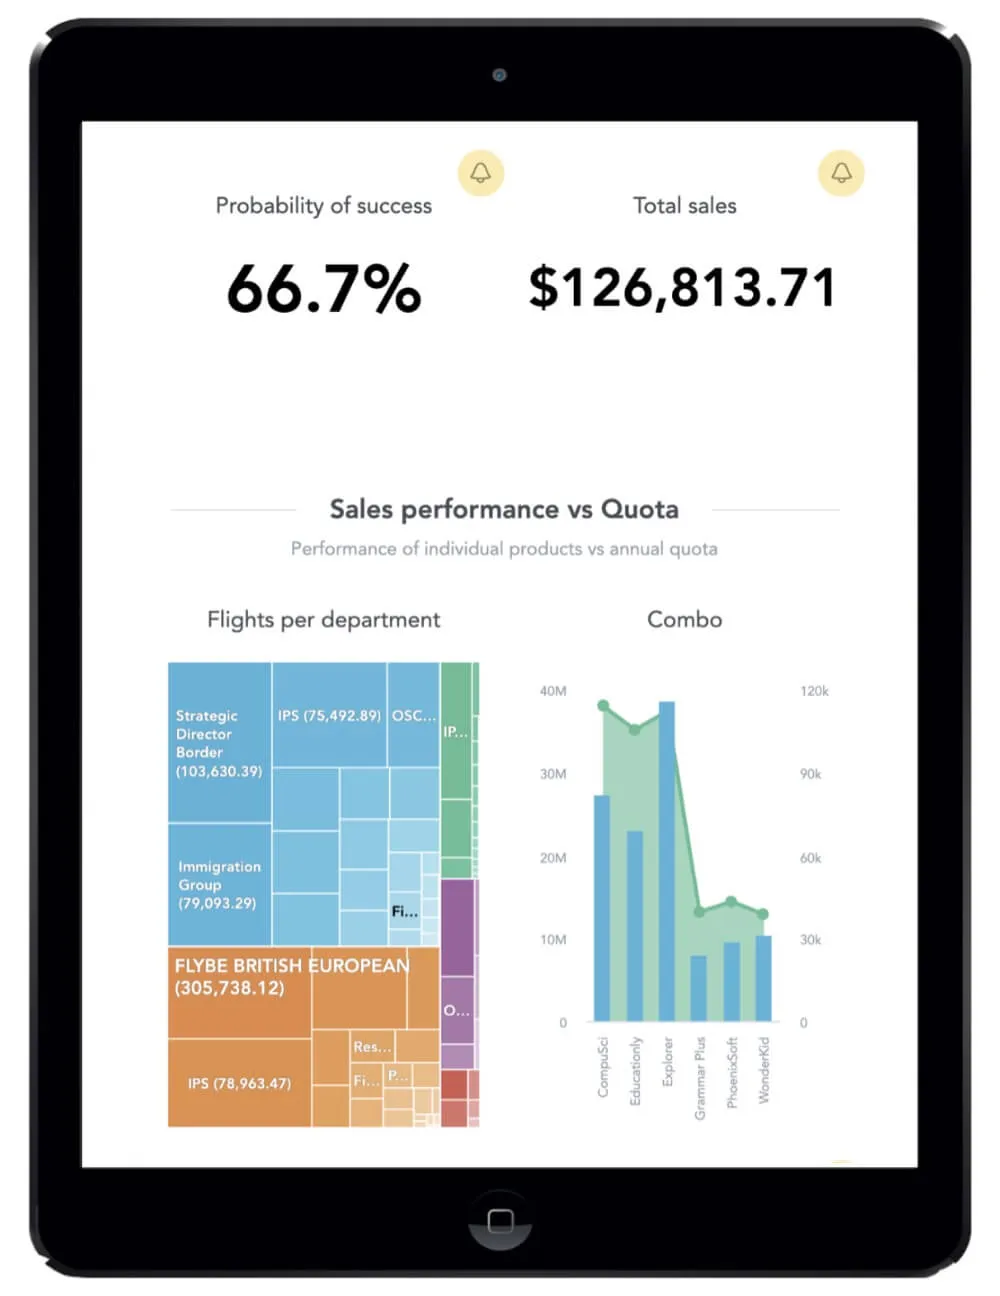
Now imagine building a dashboard that you need to use in order to successfully do your job. The stakes are much higher, and it’s probably a much more complicated dashboard. It needs to show all the metrics you care about while somehow still being digestible enough for you to easily interpret and access on multiple devices.
Based on our other experiences building dashboards, we can quickly see the challenges that this much flexibility presents. If you want everyone in the company—most of whom are not data experts—to be able to confidently work with data, then you need something fast and simple that removes the obstacles and fear associated with using a new BI tool.
Responsive dashboards make it easy to use analytics
What you need is a platform that guides you through the process of making easy-to-build, responsive dashboards that contain all your important metrics. With GoodData, the responsive dashboards adapt to your screen size, so it doesn’t matter if you’re using a very large wide screen or an iPhone.
There’s no need to download separate apps—which require constant maintenance—or create mobile- or desktop-specific dashboards. You let us do the work for you with no additional effort on your part.
Creating dashboards is also significantly easier with our drag-and-drop tools. They’re designed to provide instant feedback to help ensure that your dashboards are attractive and intuitive.
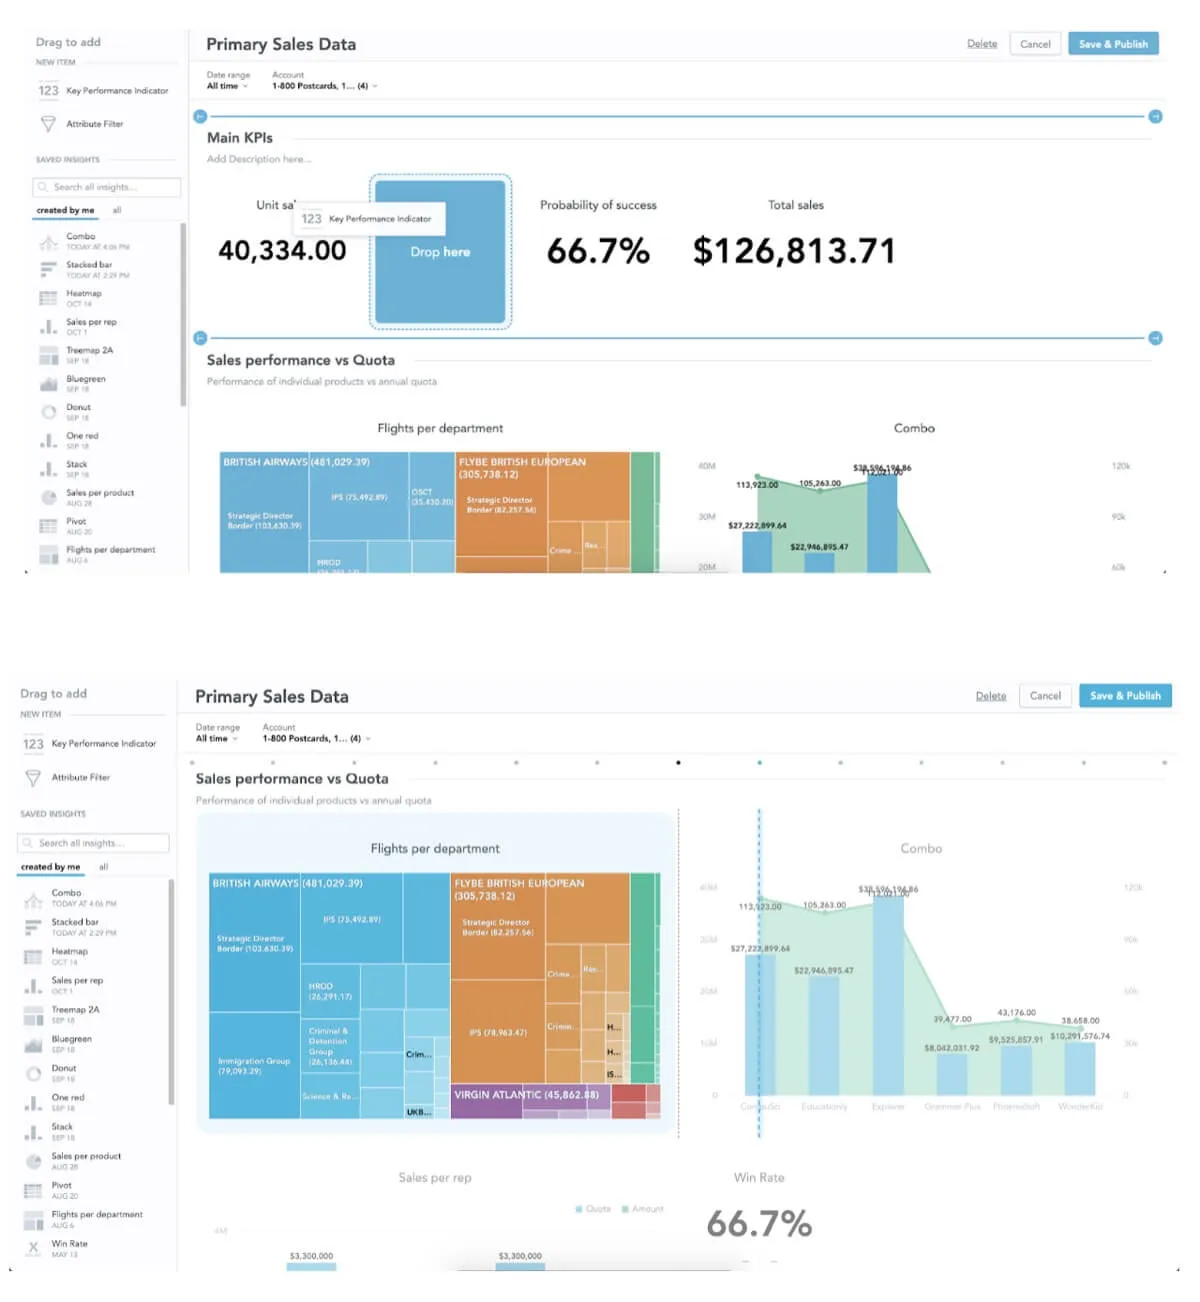
With these capabilities, you can create a dashboard in minutes. You combine insights and KPIs into logical sections and name them to your liking. You can resize the width of the widgets, and the UI takes care of everything else. And yes, it is really that easy—no help from developers or BI experts required.
Want to see for yourself how quick and easy it can be? Try it now, make some insights from our library of visualizations and create your first dashboard.
Want to see what GoodData can do for you?
Get a guided tour and ask us about GoodData’s features, implementation, and pricing.
Request a demo

