SQL and aggregated data: is there a better way?
6 min read | Published


Summary
Aggregated data sits at the heart of analytics, powering reports, dashboards, and everyday decision making. Yet traditional SQL often makes working with aggregations difficult, repetitive, and prone to errors. This article explores the limits of SQL for defining metrics, reusing logic, and keeping queries maintainable.
Readers will learn how a modern analytic engine can make these tasks simpler by allowing metrics to be defined once and reused in multiple contexts. The approach reduces redundant code, hides complex join logic, and makes advanced calculations like percentages or category shares easier to create. The result is faster development, more consistent insights, and analytics that are easier to manage over time.
SQL is great for raw data
Are you building an application where different processes access the data in a structured form? Is accessibility, integrity and security your concern? Then it’s more than likely that its associated data is stored in a SQL database like MySQL, Postgres, Oracle, or the like. Moreover, the app’s core use cases no doubt rely on standard CRUD (Create,Read, Update, Delete) operations that work on top of this raw data, with SQL queries used to implement the app’s CRUD-based functionality (e.g. data entry forms, data lookups, etc.).
There are, however, many use cases when your app works with aggregated data; almost every time a user wants to see a chart for example. Because, let's face it, bar charts with 100s of California bars are usually not that useful. And it’s with this aggregated data that SQL starts to struggle.
For aggregated data… not so much
And while SQL is great for working with raw data; SELECTs, INSERTs, DELETEs, and UPDATES work great for CRUD, when you start working with aggregated data, SQL falls short. Why? It’s because SQL lacks a modular, reusable representation for aggregated numbers.
Moreover, aggregations work with data stored in multiple connected tables much more often, and the highly normalized data model of your SQL database doesn’t help. As such, users who retrieve the data must know many relationships between your database tables.
Fortunately, there is another way.
An analytical model introduces a shared definition to these relationships and hides them from your users (denormalize the data). This not only makes it easier for your users to create their data aggregations but also shields them from the raw (SQL) data model refactoring.
First, we’ll demonstrate it with a simple sales order example. You’ll be able to try it yourself with the simple SQLite setup described below.
If you need further guidance, you’ll find two tutorials that show how to setup DBeaver with SQLite to run all the SQL queries and GoodData XAE (Extensible Analytical Engine) to execute the metric queries.
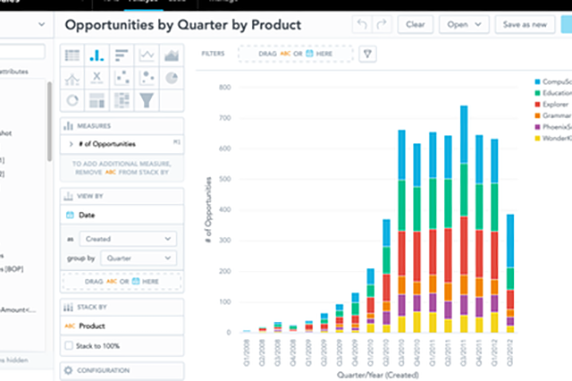
Experience GoodData in Action
Discover how our platform brings data, analytics, and AI together — through interactive product walkthroughs.
Explore product toursWorking with aggregated data in SQL
Below is a SQL data model:
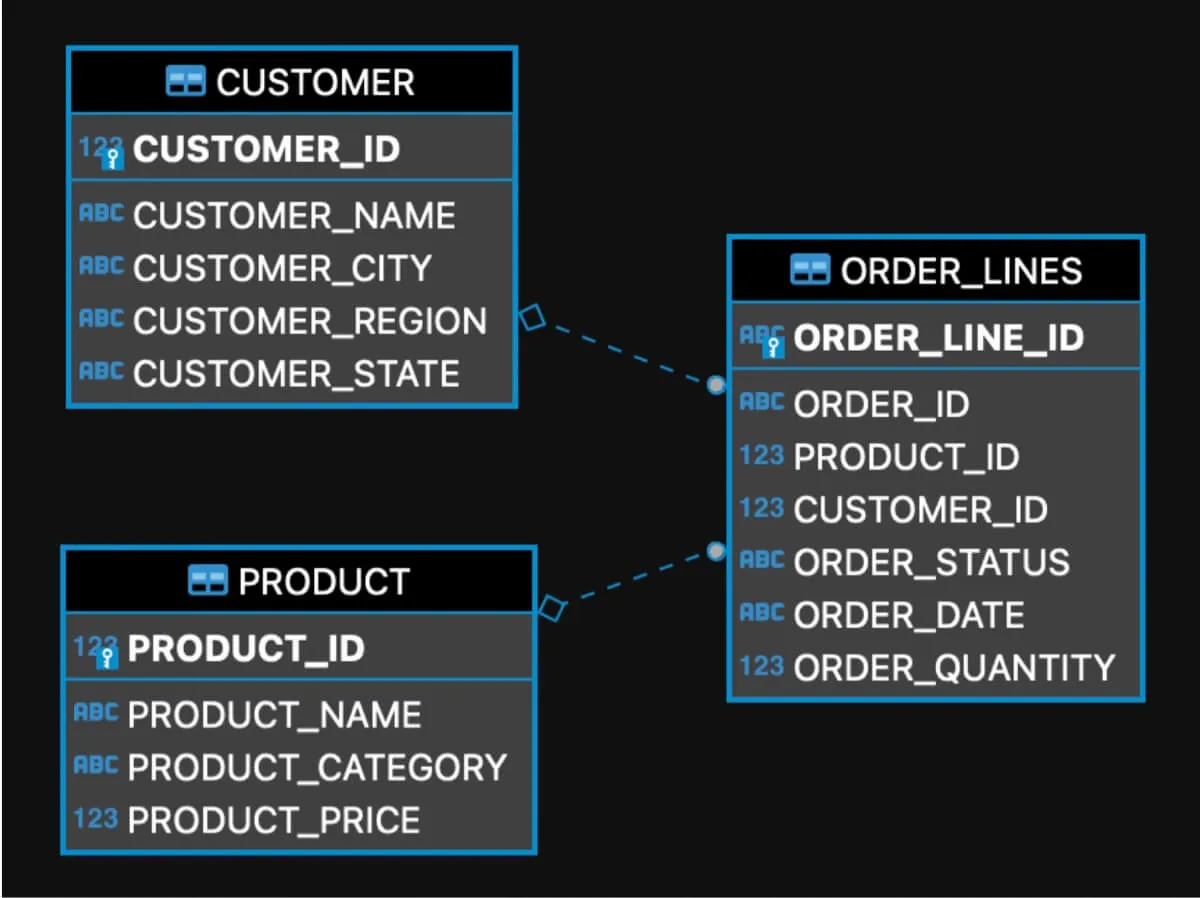
Figure 1: Example data SQL data model
SQL uses the GROUP BY statement for data aggregation. So if we want to slice and dice sales by product, we'll end up with this SQL query:
SELECT PRODUCT_NAME, SUM(ORDER_QUANTITY * PRODUCT_PRICE) AS ORDER_AMOUNT
    FROM ORDER_LINES O
    JOIN PRODUCT P
        ON (P.PRODUCT_ID = O.PRODUCT_ID)
    GROUP BY PRODUCT_NAME
    ORDER BY 1 ASC;
Similarly, if we want to slice the sales by customer’s city, we get:
SELECT CUSTOMER_CITY, SUM(ORDER_QUANTITY * PRODUCT_PRICE) AS ORDER_AMOUNT
    FROM ORDER_LINES O JOIN PRODUCT P ON (P.PRODUCT_ID = O.PRODUCT_ID)
    JOIN CUSTOMER C
        ON (C.CUSTOMER_ID = O.CUSTOMER_ID)
    GROUP BY CUSTOMER_CITY
    ORDER BY 1 ASC;
Same for trending sales by month (here we use SQLite date formatting):
SELECT STRFTIME('%Y/%m', ORDER_DATE), SUM(ORDER_QUANTITY * PRODUCT_PRICE) AS ORDER_AMOUNT
    FROM ORDER_LINES O
    JOIN PRODUCT P
        ON (P.PRODUCT_ID = O.PRODUCT_ID)
    GROUP BY 1
    ORDER BY 1 ASC;
The aggregation queries have a lot in common. However, with SQL, there’s always the need to write the correct joins, grouping, etc.
Is there a better way?
Let’s look at the three scenarios above from a more high-level perspective. In all cases, we work with the same number, the SUM(ORDER_QUANTITY * PRODUCT_PRICE) that we want to aggregate by PRODUCT_NAME, CUSTOMER_CITY, or by the ORDER_DATE. Let's call it REVENUE for now. Wouldn't it be great if SQL had a good, simple representation for the REVENUE? A representation that we could reuse in a simple way in all the queries above to make them much simpler? For example:
CREATE METRIC "REVENUE" AS
 SELECT SUM("ORDER_QUANTITY" * "PRODUCT_PRICE");
Getting rid of JOINs
The next thing on the agenda is to get rid of the joins. They are always the same. It’d be great to define them in the SQL data model once and not have to specify them in every query. We could perhaps use referential integrity constraints (primary keys and foreign keys) for the definition and preprocess the simplified queries to enrich them with the JOIN conditions inferred from the foreign keys.
Removing GROUP BYs
The SQL GROUP BY clauses can also be generated. Here, we could perhaps use the supported SQL syntax GROUP BY 1,2,3,... to make the preprocessing simpler.
Result
With the metric, no joins, and grouping, I can rewrite the aggregation queries to something as simple as this:
SELECT PRODUCT_NAME, REVENUE
SELECT CUSTOMER_CITY, REVENUE
SELECT STRFTIME('%Y/%m', ORDER_DATE), REVENUE
Multiple aggregations in one query
The simple SQL query generator idea looks interesting. But we can take it even further. What if we need to compute the REVENUE for two different product categories (e.g. 'Home', and 'Outdoor') and aggregate it by CUSTOMER_CITY? The best of doing this in SQL that we’ve found so far is the following:
SELECT
    CUSTOMER_CITY,
    SUM(CASE
          WHEN PRODUCT_CATEGORY = 'Outdoor'
            THEN ORDER_QUANTITY * PRODUCT_PRICE
        END),
    SUM(CASE
          WHEN PRODUCT_CATEGORY = 'Home'
            THEN ORDER_QUANTITY * PRODUCT_PRICE
        END)
  FROM ORDER_LINES O
    JOIN PRODUCT P ON P.PRODUCT_ID = O.PRODUCT_ID
    JOIN CUSTOMER C ON C.CUSTOMER_ID = O.CUSTOMER_ID
  GROUP BY CUSTOMER_CITY;
If we want to aggregate the revenue by other columns (e.g. PRODUCT_NAME or ORDER_DATE) instead of the CUSTOMER_CITY, we need another complex query.
Metric’s WHERE clause
The metric can support WHERE clause. Then the views and queries above would read like this:
CREATE METRIC "REVENUE (Home)" AS
  SELECT "REVENUE" WHERE "PRODUCT_CATEGORY" = 'Home';

CREATE METRIC "REVENUE (Outdoor)" AS
  SELECT "REVENUE" WHERE "PRODUCT_CATEGORY" = 'Outdoor';
and then the final query would be:
SELECT "CUSTOMER_CITY", "REVENUE (Outdoor)", "REVENUE (Home)";Moreover, if we want to include the aggregation by ORDER_DATE, we can simply reuse both metrics
SELECT ORDER_DATE, "REVENUE (Outdoor)", "REVENUE (Home)";Simple one-liners that reuse metrics across multiple aggregations unlike the complex SQL queries above. Beautiful!
Percentages and shares
Another great opportunity for simplification is aggregation locking. The most frequent use-case is the computing base for percentages and shares in one query with fractions. For example, computing a share of a certain product category for every city. First, let’s again start with the SQL implementation and use views for decomposing the complex query to multiple steps:
First, we’ll compute the total revenue per city:
CREATE VIEW REVENUE_BY_CITY AS
 SELECT
     CUSTOMER_CITY,
     SUM(ORDER_QUANTITY * PRODUCT_PRICE) AS BASE_AMOUNT
   FROM ORDER_LINES O
     JOIN PRODUCT P ON P.PRODUCT_ID = O.PRODUCT_ID
     JOIN CUSTOMER C ON C.CUSTOMER_ID = O.CUSTOMER_ID
   GROUP BY CUSTOMER_CITY;
then compute the PRODUCT_CATEGORY breakdowns of the revenue in different cities
CREATE VIEW REVENUE_BY_PRODUCT_CATEGORY_AND_CITY AS
 SELECT
     PRODUCT_CATEGORY,
     CUSTOMER_CITY,
     SUM(ORDER_QUANTITY * PRODUCT_PRICE) AS ORDER_AMOUNT
   FROM ORDER_LINES O
     JOIN PRODUCT P ON P.PRODUCT_ID = O.PRODUCT_ID
     JOIN CUSTOMER C ON C.CUSTOMER_ID = O.CUSTOMER_ID
   GROUP BY PRODUCT_CATEGORY, CUSTOMER_CITY;
and divide the ORDER_AMOUNT by the BASE_AMOUNT in both view join:
SELECT
   RPC.CUSTOMER_CITY,
   PRODUCT_CATEGORY,
   ORDER_AMOUNT,
   BASE_AMOUNT,
   ORDER_AMOUNT / BASE_AMOUNT
 FROM REVENUE_BY_PRODUCT_CATEGORY_AND_CITY RPC
   JOIN REVENUE_BY_CITY RC ON RC.CUSTOMER_CITY = RPC.CUSTOMER_CITY
 GROUP BY RPC.CUSTOMER_CITY, PRODUCT_CATEGORY;
Again, it’s necessary to create two very aggregation-specific views and join them.
Alternatively, if the target database support analytics/window functions, this can be done in one query:
SELECT * FROM (
  SELECT
      CUSTOMER_CITY, PRODUCT_CATEGORY,
      SUM(ORDER_QUANTITY * PRODUCT_PRICE)
        OVER (PARTITION BY PRODUCT_CATEGORY, CUSTOMER_CITY) AS ORDER_AMOUNT,
      SUM(ORDER_QUANTITY * PRODUCT_PRICE)
        OVER (PARTITION BY CUSTOMER_CITY) AS CITY_ORDER_AMOUNT,
      SUM(ORDER_QUANTITY * PRODUCT_PRICE) OVER (PARTITION BY PRODUCT_CATEGORY, CUSTOMER_CITY)
       /
      SUM(ORDER_QUANTITY * PRODUCT_PRICE) OVER (PARTITION BY CUSTOMER_CITY) AS PERCENTAGE,
      ROW_NUMBER() OVER (PARTITION BY PRODUCT_CATEGORY, CUSTOMER_CITY ORDER BY O.ORDER_LINE_ID) as ROWNUM
    FROM ORDER_LINES O
      JOIN PRODUCT P ON P.PRODUCT_ID = O.PRODUCT_ID
      JOIN CUSTOMER C ON C.CUSTOMER_ID = O.CUSTOMER_ID) x
  WHERE ROWNUM = 1
  ORDER BY CUSTOMER_CITY, PERCENTAGE DESC;
Metric’s BY clause — forcing aggregation
The metric can force (or lock) aggregation on a certain level. Let’s create a metric that computes the total revenue by CUSTOMER_CITY:
CREATE METRIC "REVENUE BY CITY" AS
   SELECT "REVENUE" BY "CUSTOMER_CITY" ALL OTHER;
then reuse the REVENUE metric created above and compute the share:
CREATE METRIC "REVENUE PRODUCT_CATEGORY % IN CITY" AS
   SELECT "REVENUE" / "REVENUE BY CITY" BY "CUSTOMER_CITY";
And the final aggregation query:
SELECT
    "CUSTOMER_CITY",
    "PRODUCT_CATEGORY",
    "REVENUE",
    "REVENUE BY CITY",
    "REVENUE PRODUCT_CATEGORY % IN CITY"
Again, much simpler and both new metrics can be reused for computing the fractions not only by the PRODUCT_CATEGORY but by any other column (e.g. PRODUCT or ORDER_DATE).
The key takeaway? SQL doesn’t have any representation for aggregated numbers. And therefore, embracing an analytical engine in your application can reduce resource usage and significantly accelerate your development, making it much easier to use and maintain for your users, and developers.
This article uses GoodData MAQL syntax. Want to find out more and try this metric implementation yourself? Sign up for our free trial.
Need more explanation? The brief tutorial based on this article shows how to set up GoodData XAE and connect it to DBeaver to create and execute the metrics described above. Another tutorial shows how to setup DBeaver with SQLLite to run the SQL queries from this article.
More about the GoodData analytical engine
Do you want to try this yourself? Check out the GoodData embedded analytics engine. Request a demo to get a closer look, or sign up for our free trial and go through this simple tutorial that uses the included demo data.
The GoodData analytical engine (XAE) is available as a hosted SaaS solution or container. It interfaces with REST APIs and GoodData provides many convenient SDKs and tools to access it from several different environments. Check out:
- GoodData.UI SDK for accessing XAE from Javascript frameworks like React, Vue, or Angular. GoodData.UI can also visualize the data as individual insights or dashboards
- Embeddable self service tools (Analytical Designer, Dashboard Designer) for self-service insights and dashboard creation
- Java
- Ruby
- REST API
- JDBC for access from SQL tools like DataGrip or Zeppelin notebook
- Google Apps Script for working with data in Google Spreadsheets
Experience GoodData in Action
Discover how our platform brings data, analytics, and AI together — through interactive product walkthroughs.
Explore product toursFAQa About SQL and Aggregated Data
SQL can handle aggregations, but it often requires long queries with repeated joins, groupings, and conditions. This repetition makes queries hard to read, error prone, and difficult to maintain as analytics needs grow.
When a metric such as total revenue is defined in one central place, every report that uses it will calculate the value in exactly the same way. This prevents inconsistencies that can happen when different teams write their own SQL queries.
Including join logic in every query increases the chance of mistakes and makes queries longer and harder to manage. By moving join definitions into an analytic engine, teams reduce errors and simplify their workflows.
Reusable metrics make it easier to calculate revenue by product, region, or time period, to filter results by categories, or to create share of total measures. Each of these tasks can be done quickly without repeating complex SQL.
When queries are shorter and metrics are standardized, analytics teams spend less time fixing errors and rewriting code. This improves efficiency and ensures analytics remain reliable as the organization grows.