Deliver Efficient Data Consumption With a Semantic Model
5 min read | Published

Data consumption is one of the most frequently neglected aspects of data analytics architectures today. Data architects focus on designing their data lake structures, data warehouse schemas, or, most recently, data lakehouse synchronizations, and overlook the fundamental problem; the way in which data is consumed by their users.
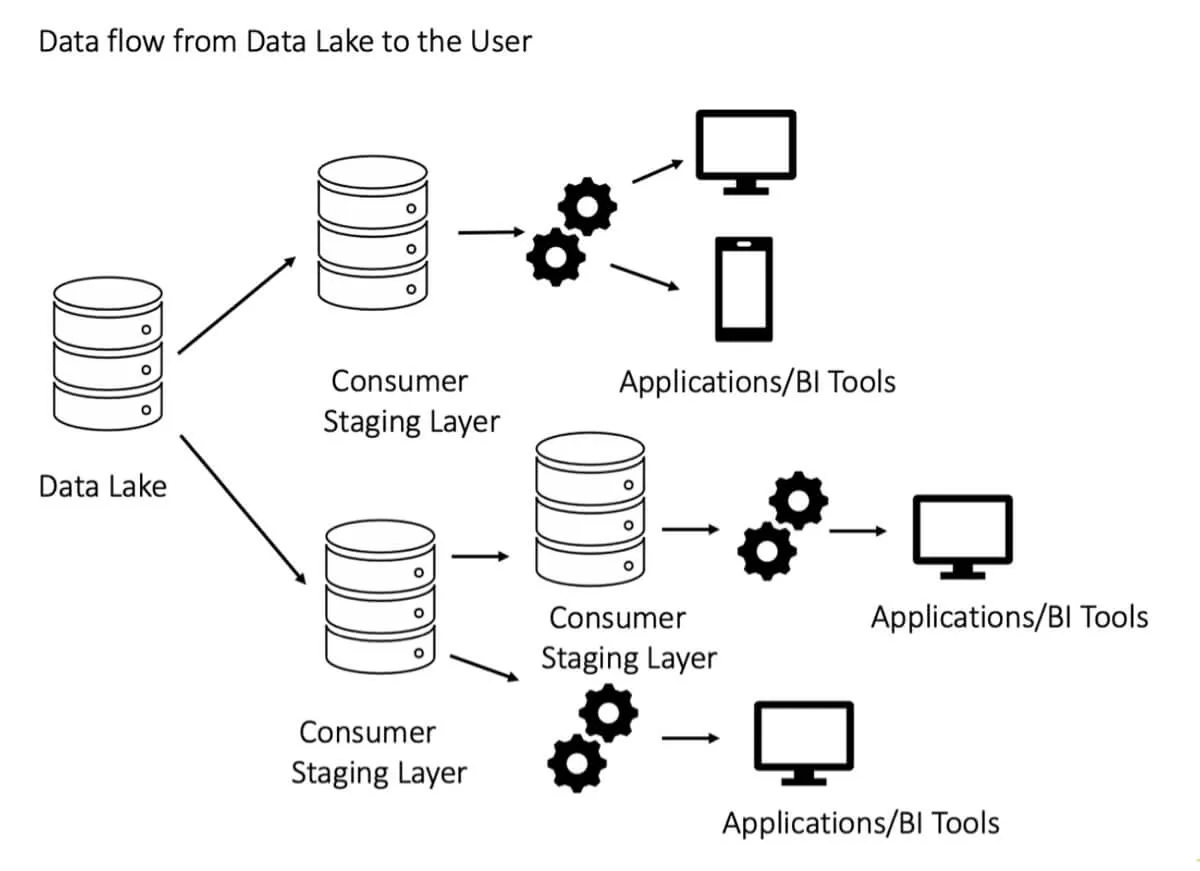
Many data architecture diagrams don’t address data consumption, and terminate data pipelines with a generic “BI tools” sink.
SQL data models and queries are great for data management, however, you need a more modular, reusable, and easier-to-use interface for efficient data consumption. You need a semantic model.
Data Consumption Today
You serve data to analysts, data scientists, developers, and business users, who all work with numbers that they call KPIs, metrics, measures, or variables. Let’s call these numbers metrics. Your users need to filter and aggregate the metrics by certain characteristics like regions, time periods (days, weeks, months), product categories, etc. Your users then visualize the metrics and attributes in reports or dashboards or use them in their machine learning or statistical algorithms.
Today, you most probably serve data to your users using SQL data models and queries, letting them create their metrics and attributes themselves. This, however, introduces many problems, the most important ones being:
- Limited modularity and reuse. Mapping between queries and metrics is hard. Because SQL queries lack modularity, each combination of attributes and metrics requires a different, unique query. Your users need a different query per each report, dataset, or data visualization. For example, a revenue metric will need one query for a bar chart that shows the revenue by month and another query for revenue by region. Your users will need to deal with thousands of SQL queries and your solution will quickly become unmanageable.
- Fragility. SQL queries are tightly coupled with their data model. This makes them extremely fragile. Simple data model changes like introducing new tables, changing relationships, or moving data columns between tables break your user’s queries. You don’t want to ask your users to fix their queries every time you change your data model.
- Consistency. As you don’t provide any shared definition of the metric calculations and relationships between the data model entities, the same metrics might be (and will be) defined differently by different users. This leads to inconsistencies in the insights that they are delivering to their consumers. This is one of the fundamental issues that many organizations experienced and are still experiencing with desktop data visualization tools like Tableau.
- Agility. Your users have limited knowledge of your data model and often limited SQL querying skills. They will need help with their query design. Add the limited modularity problem described above, and you know the result: a solution lacking self-service, without the velocity and agility you require, and you fixing trivial SQL queries 24x7.
In short, you can do much better by going one step further and introducing a semantic data model layer on top of your data warehouse, data lake, or data lakehouse.
Experience GoodData in Action
Discover how our platform brings data, analytics, and AI together — through interactive product walkthroughs.
Explore product toursSemantic Data Model
The semantic data model provides your users with significantly more useful abstractions than the SQL data model and queries. These abstractions are more composable and reusable than queries. The semantic model isolates your SQL data model from your user’s analytical objects and algorithms, and promotes consistency with shared definitions of metrics and relationships. And your users don’t need advanced SQL querying skills for analyzing data.
Moreover, you can decompose your large data models into multiple, less complex, domain-specific semantic data models for different audiences (e.g. marketing, sales, product, support, finance, etc.).
Semantic Model Example: GoodData Logical Data Model
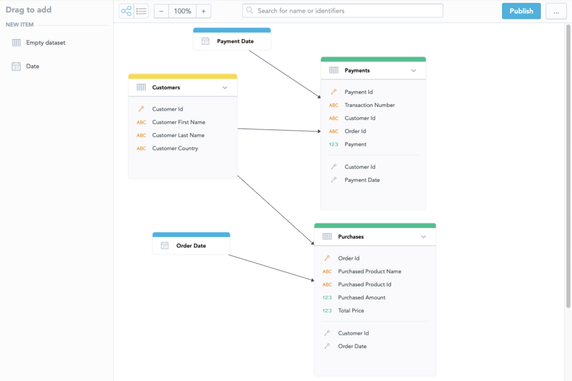
Let’s demonstrate the semantic model’s benefits on an exemplary semantic model implementation - the GoodData Logical Data Model (LDM). We are going to use a very simple example data model that consists of the following elements:
- Revenue metric that is defined on top of a sales_amount column in a sales table in your data warehouse.
- Quarter attribute that is derived from a sales_date column in the same sales table.
- Region attribute that sits on top of a sales_region column in the same table.
- Sales Rep attribute that maps to a name column in a salesrep table linked to the sales table.
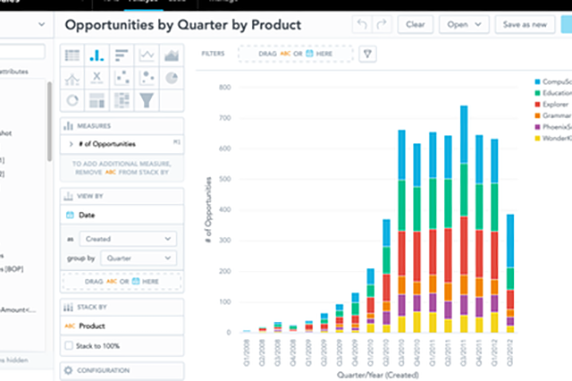
Let’s assume that one of your users wants to create three simple data visualizations: revenue by quarter, revenue by region, and revenue by sales rep. You can define the Revenue metric using a simple SUM(sales_amount) expression and let your user reuse it across all three data visualizations (e.g. drag and drop the Revenue metric with a corresponding attribute in the Analytical Designer). The GoodData analytical engine generates the underlying SQL queries automatically based on the LDM information. Here are the SQL queries:
revenue by quarter:
SELECT CONCAT(
     EXTRACT(QUARTER FROM sales_date),’/’,
     EXTRACT(YEAR FROM sales_date) AS qtr,
     SUM(sales_amount))
FROM sales GROUP BY qtr
revenue by region:
SELECT sales_region, SUM(sales_amount)
FROM sales GROUP BY sales_region
revenue by salesrep:
SELECT name, SUM(sales_amount)
FROM sales JOIN salesrep ON salesrep.id = sales.salesrep_id
GROUP BY name
In the semantic model, the same Revenue metric is reused for all three data visualizations above. GoodData engine generates the different SQL queries based on the combination of attributes (context) that the metrics are used with. Your user simply drags the Revenue metric and one of the attributes without even knowing about the underlying SQL queries being generated.
Moreover, your users can derive their metrics from the Revenue metrics using simple or complex expressions, further aggregation or filtering. Imagine how much they can achieve with just a handful of predefined metrics without you moving a finger!
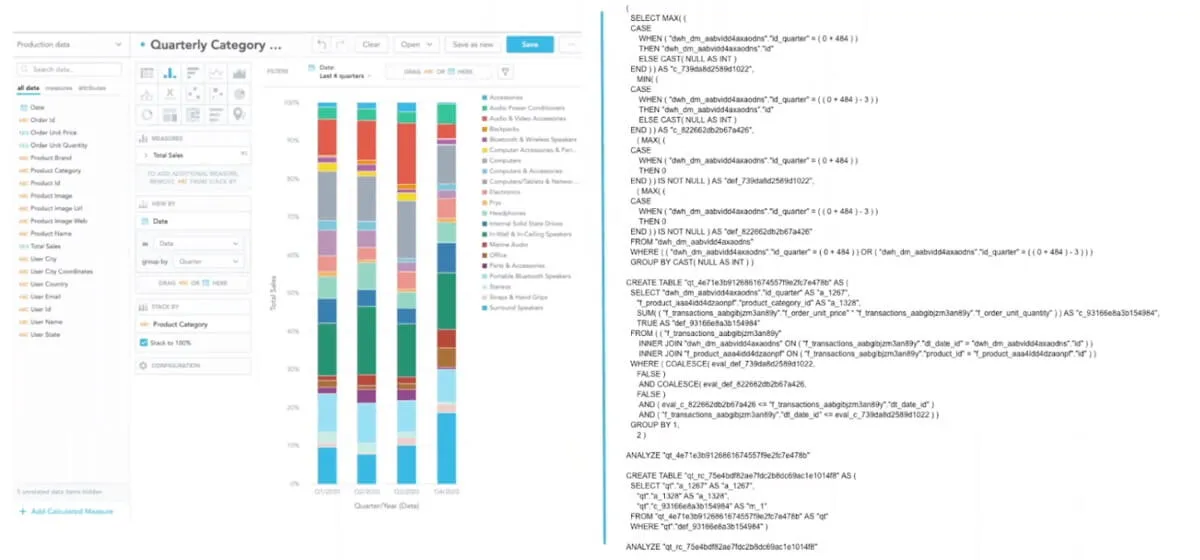
NOTE: The SQL examples above are indeed trivial. In reality, the required SQL queries become far more complex. Check out a real-world example in the figure below.
Also, if you later decide to change your data model, your user’s work won’t be impacted by your changes. Perhaps you’ll need to change the 1:N relationship between the sales and salesrep tables to an M:N relationship, by introducing a bridge (aka junction) table. In SQL, all queries would need to be changed to something like this
revenue by salesrep:
SELECT name, SUM(sales_amount)
FROM sales JOIN bridge ON bridge.sales_id = sales.id
JOIN salesrep ON salesrep.id = bridge.salesrep_id
GROUP BY name
In the SQL world, your users will need to modify all their queries that involve the salesrep and sales tables (hundreds or even thousands of queries in an average analytics project).
In GoodData the data model change is automatically reflected in the semantic model and your user’s queries are not impacted. The analytical engine just generates new queries based on the updated information in the LDM.
Semantic Model Interfaces
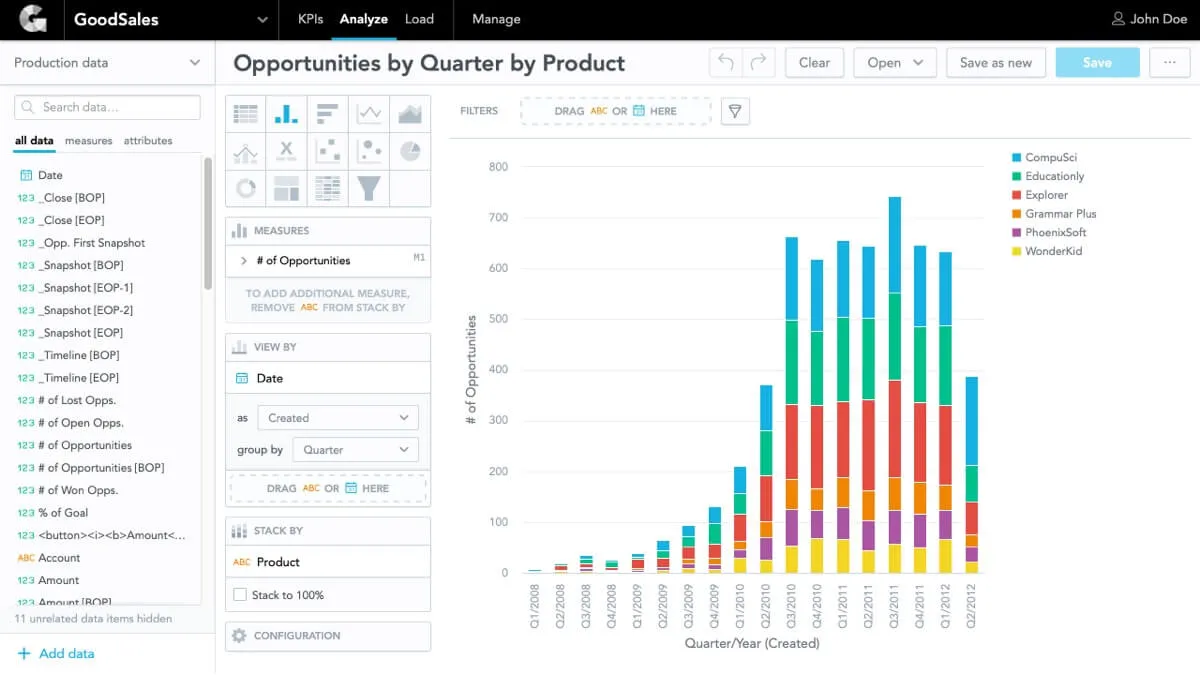
There are many different ways by which the semantic model can be consumed. For example, data analysts or power users can use the GoodData Analytical Designer tool to drag and drop the metrics and attributes to define a new data visualization.
Similarly, UI developers can use a simple AFM structure to define the desired combinations of attributes and metrics for rendering their data visualizations in their React application.
Try It Yourself
Interested to see how you can deliver easily consumable data analytics with a robust semantic model? Register for our free trial and follow this course to try it out for yourself. Or let us take you on a tour of the GoodData platform with an in-depth demo.
Experience GoodData in Action
Discover how our platform brings data, analytics, and AI together — through interactive product walkthroughs.
Explore product tours