Migrating from Qlik to GoodData: How to Modernize BI Without Rebuilding Everything
7 min read | Published

Why Qlik Teams Are Rethinking Their BI Stack
Many organizations running Qlik today aren’t doing anything wrong. Qlik has been a powerful BI platform for years, particularly for interactive dashboards and associative analytics. For many teams, it became a core part of their analytical workflow, tightly integrated into how reporting and analysis are delivered. So why are Qlik teams rethinking their BI stack?
The answer is that the technical requirements for analytics have fundamentally changed. Analytics has expanded well beyond traditional dashboards to include:
- AI-assisted analysis and natural language querying that require consistent, well-defined metrics.
- Automated agents and workflows that act on governed metrics, thresholds, and events.
- Embedded analytics inside applications with strict requirements on performance, security, and reuse.
- Multiple analytical consumers (BI tools, apps, AI models, APIs) relying on the same shared business logic.
- An increasing expectation that analytics assets are defined, managed, and deployed as code.
Most traditional BI platforms, including Qlik, were built around a dashboard-centric architecture, where business logic is tightly coupled to visualizations. In modern data stacks, dashboards are no longer the primary integration point; they’re just one of many consumers of metrics, alongside AI, applications, APIs, and automation.
Teams aren’t leaving Qlik because it failed. They’re reassessing it because its architecture was built for an earlier generation of BI. This isn’t about replacing dashboards; it’s about modernizing how metrics are defined, governed, and reused across the stack.
Seen this way, migration isn’t a reaction to a broken tool. It’s a response to a new, more programmatic analytics reality.
The Hidden Problem with BI Migrations (Regardless of the Tool)
When teams plan a BI migration, the conversation usually starts with dashboards: How many do we have? How long will it take to rebuild them? Can we make the new ones look the same?
This focus is understandable, but it’s also misleading. Dashboards are the most visible part of BI, not the most complex. The real complexity lives underneath, in the logic that defines how the business measures performance.
Over time, this leads to common issues:
- Business logic embedded directly in measures and expressions, tightly coupled to a specific BI tool.
- Filters, hierarchies, and calculations tied to visualization layers rather than reusable logic.
- Little to no shared logic across dashboards and reports.
- The same KPI is implemented multiple times across dashboards and applications.
- Inconsistent metric definitions and no single source of truth for business metrics.
Why This Becomes a Problem at Scale
As organizations grow, these issues compound. Each new dashboard increases maintenance. Each new use case reimplements existing logic. Small inconsistencies lead to repeated validation, performance issues, and ongoing questions about which numbers are correct.
For technical teams, analytics becomes harder to evolve, test, and automate. From a business perspective, trust in metrics erodes, decision-making slows, and adopting capabilities like AI, automation, or embedded analytics becomes difficult.
When migrations focus on recreating dashboards without addressing the underlying logic, they don’t reduce complexity — they simply move it, transferring technical debt from one platform to another.
What Qlik Users Commonly Run Into During Migration
This is where many Qlik migrations become painful.
Teams often expect the migration to be largely visual. In practice, the effort quickly shifts to business logic, validation, and rework.
Common challenges include:
- Rewriting measures and expressions: Qlik’s expression language is powerful but tightly coupled to its associative engine. During migration, measures often need to be rewritten, reinterpreted, or translated, requiring manual effort.
- Losing metric consistency: Metrics that appeared the same in Qlik can behave differently once rebuilt in another tool. Small differences in filters, aggregation logic, or default context often result in unexpected discrepancies.
- Revalidating every dashboard: Because logic is embedded at the dashboard level, teams must validate every dashboard, chart, and KPI individually. This validation effort is time-consuming and repetitive.
- Performance regressions: Dashboards that performed well in Qlik may degrade when recreated naively elsewhere, especially when complex calculations are pushed into the visualization layer rather than optimized centrally.
- Broken trust with stakeholders: Even minor inconsistencies can break confidence. When numbers change and teams struggle to clearly explain why, trust in the new platform suffers, even if the underlying architecture is objectively better.
It’s often while encountering these challenges that teams realize migration isn’t just about switching tools, but about changing how analytics is designed, built, and governed.
What “Modernizing First” Actually Means
Modernizing doesn’t mean rebuilding everything from scratch. It means changing the order of operations. Instead of starting with dashboards, modern BI teams start with the foundation:
- Separating business logic from visualizations: Metrics and definitions exist independently of any single BI tool.
- Centralizing metrics: Each KPI is defined once and reused consistently across all use cases.
- Establishing a governed semantic layer: Business logic becomes consistent, versioned, testable, and auditable.
- Making analytics tool-agnostic: Dashboards, AI tools, applications, and automation workflows all consume the same definitions.
The result isn’t just a smoother migration; it’s a durable analytics foundation that supports future use cases like AI, automation, and embedded analytics.
How GoodData Approaches Qlik Migrations Differently
GoodData migrations start from the assumption that dashboards are the output, not the source. Instead of rebuilding everything manually, the focus is on extracting and modernizing what already exists:
- Extracting business logic from Qlik apps.
- Refactoring metrics into a centralized semantic layer.
- Reusing metrics across dashboards, tools, and use cases.
- Automating regeneration of dashboards and analytics assets.
- Reducing manual rework during migration.
By shifting logic out of dashboards and into a governed semantic layer, teams can automate a large portion of the migration process. In practice, that automation can cover up to 80% of BI work, while also improving consistency and governance.
Demo Walkthrough: Migrating a Qlik App to GoodData
To make this concrete, let’s walk through a real migration scenario.
You already have analytics built in Qlik, typically across multiple dashboards created over time. The analytics is organized around applications, each with its own data model, measures, and expressions. Dashboards are tightly coupled to a specific app, Qlik-specific logic, and visualization layer.
Before migrating anything, the real challenge is understanding the existing logic and where it lives. This is where AI-assisted development workflows come in.
Using Cursor for creating specialized agents, you can extract metadata directly from Qlik exports or interfaces — including measures, expressions, object dependencies, and dashboard structure — without manual reverse engineering.
This allows agents to:
- Extract and normalize analytics logic from Qlik.
- Generate assets aligned with GoodData’s semantic model, thanks to GoodData MCP Server for Cursor Support.
- Automate large parts of the migration safely and repeatably.
With that foundation in place, we can now walk through the migration step by step.
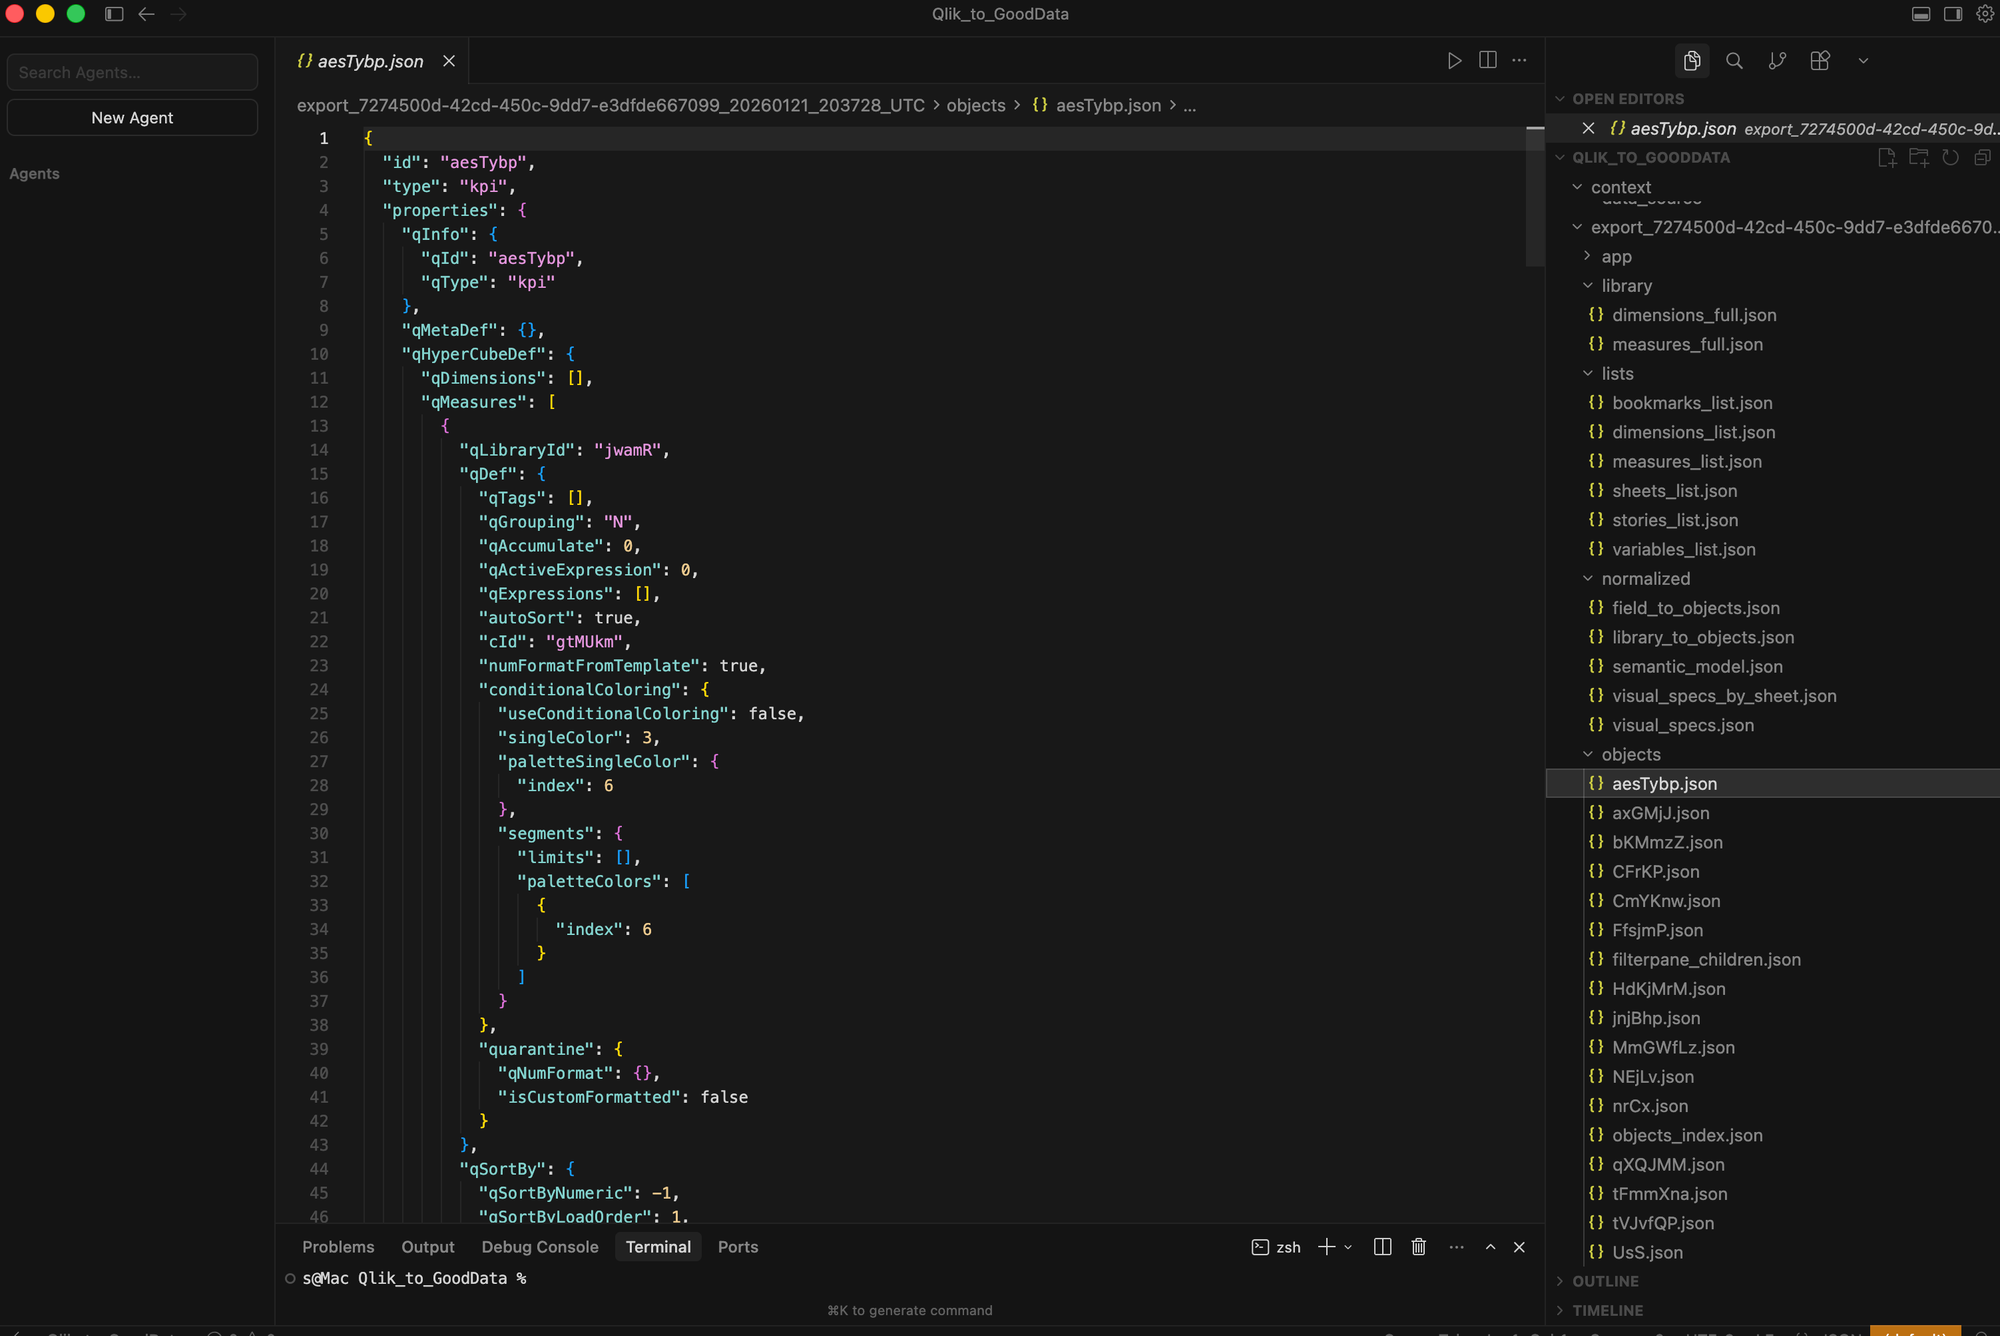
Step 1: Export the Qlik app structure
The first step is to extract everything that represents analytics logic in Qlik — not just screenshots or visual replicas of dashboards.
Using Cursor, we have created a specialized agent that can safely access Qlik applications, inspect their objects, and extract metadata directly into structured JSON. This includes measures, expressions, object definitions, and sheet composition.
Why this matters: once a Qlik app is fully represented as JSON (with all logic explicitly mapped), it becomes reusable and transformable programmatically. This is the foundation for automation, validation, and repeatable migration, rather than manual dashboard rebuilding.
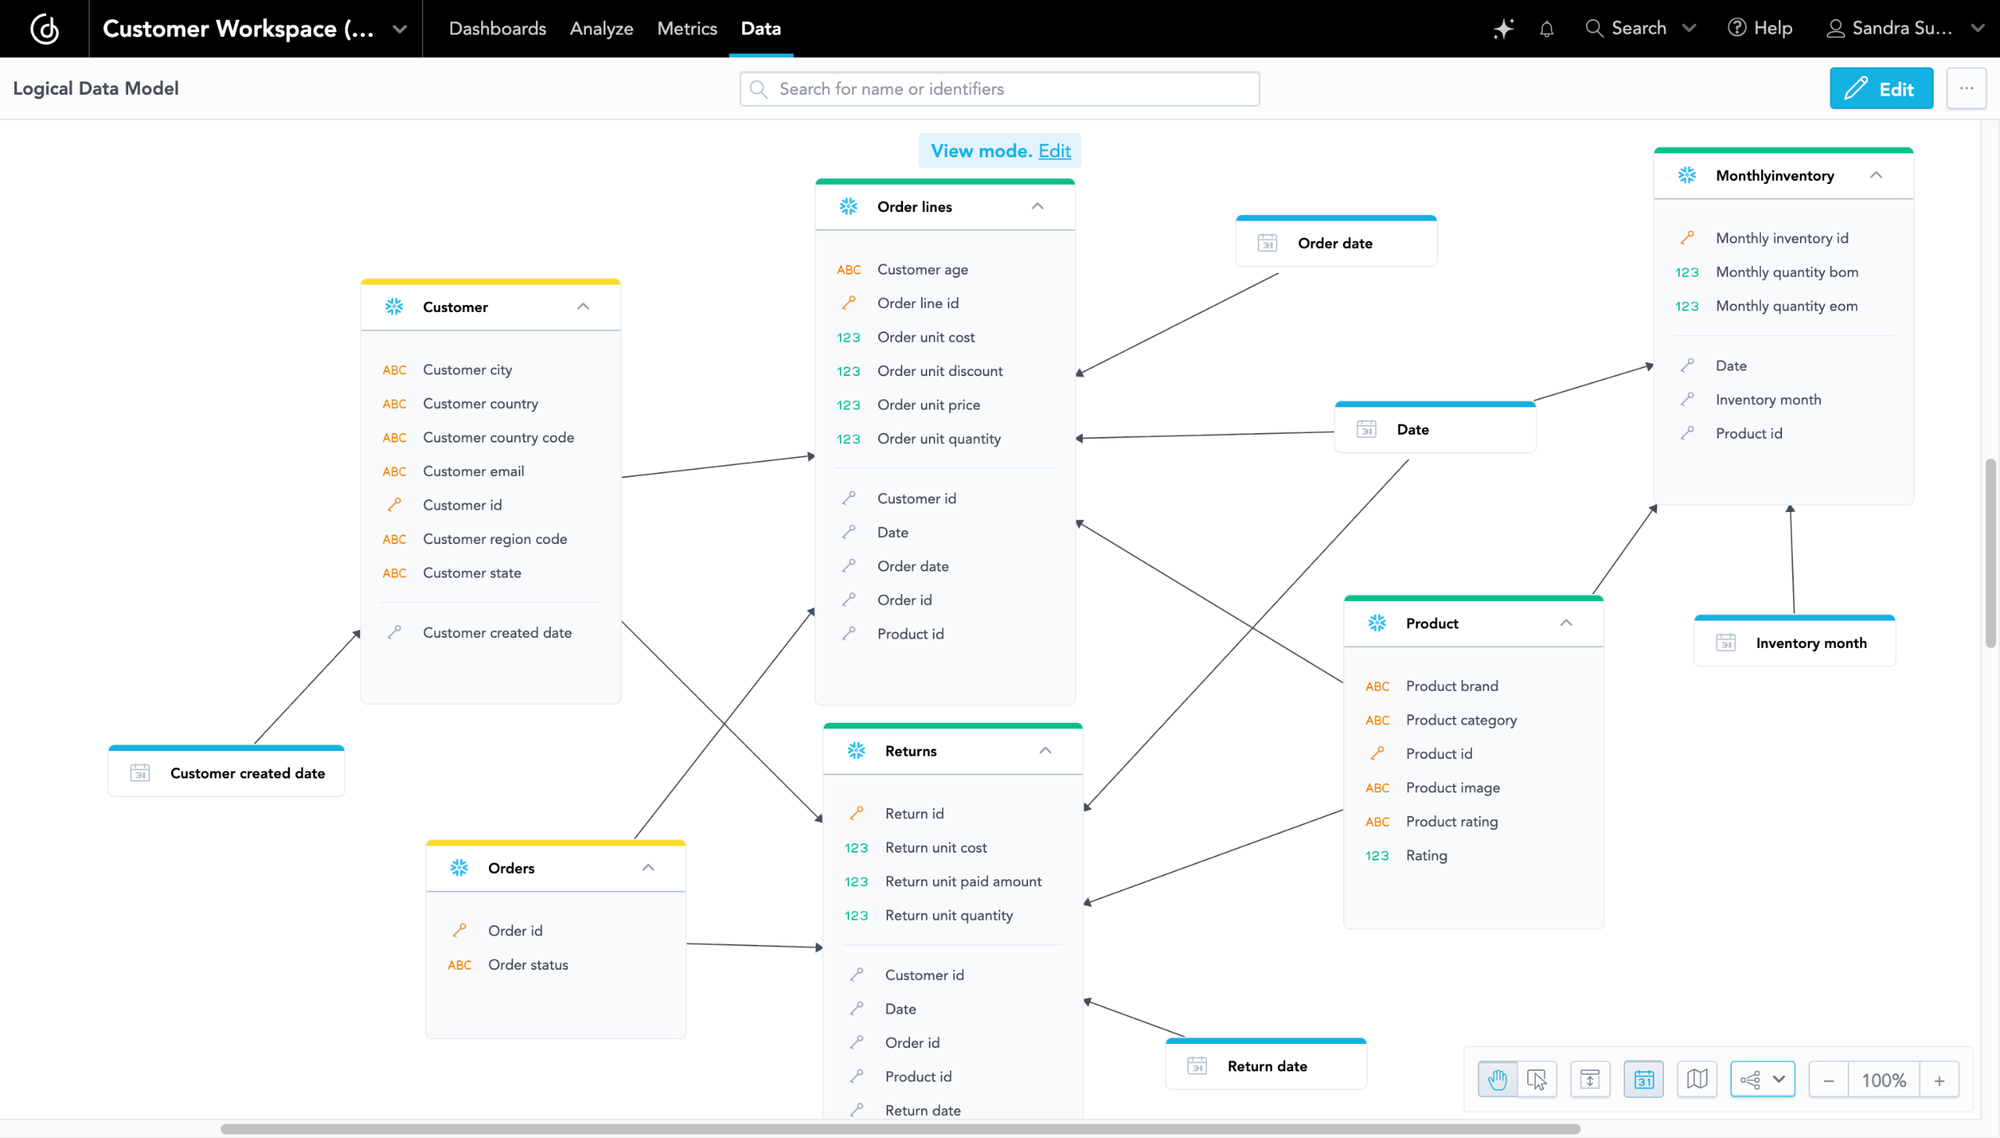
Step 2: Normalize Qlik Logic into a Governed Semantic Layer
The raw Qlik export describes objects and expressions, but it is not yet a semantic model. In this step, the extracted Qlik JSON is normalized into a structure that can be deterministically converted into GoodData assets. This includes identifying dimensions, measures, filters, resolving dependencies, and separating reusable business logic from visualization-specific definitions.
From this normalized model, the migration engine:
- Lists Qlik main measures.
- Translates Qlik expressions into GoodData metric logic (MAQL).
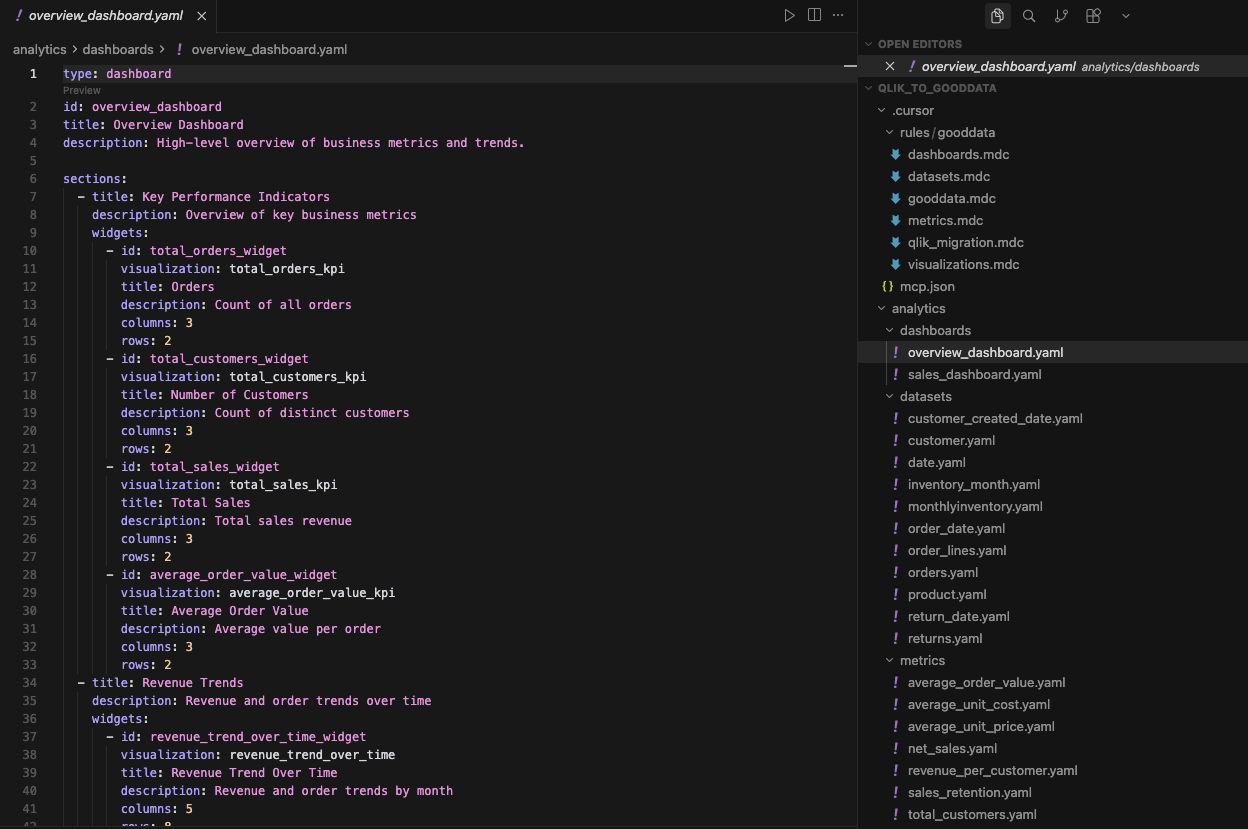
- Generates metric definitions as code (YAML).
The result is a logical data model and a governed semantic layer in GoodData. This layer provides standardized, versioned metrics that can be reused across dashboards, users, and tenants, and includes auto-generated date dimensions and a business-facing model decoupled from physical source naming.
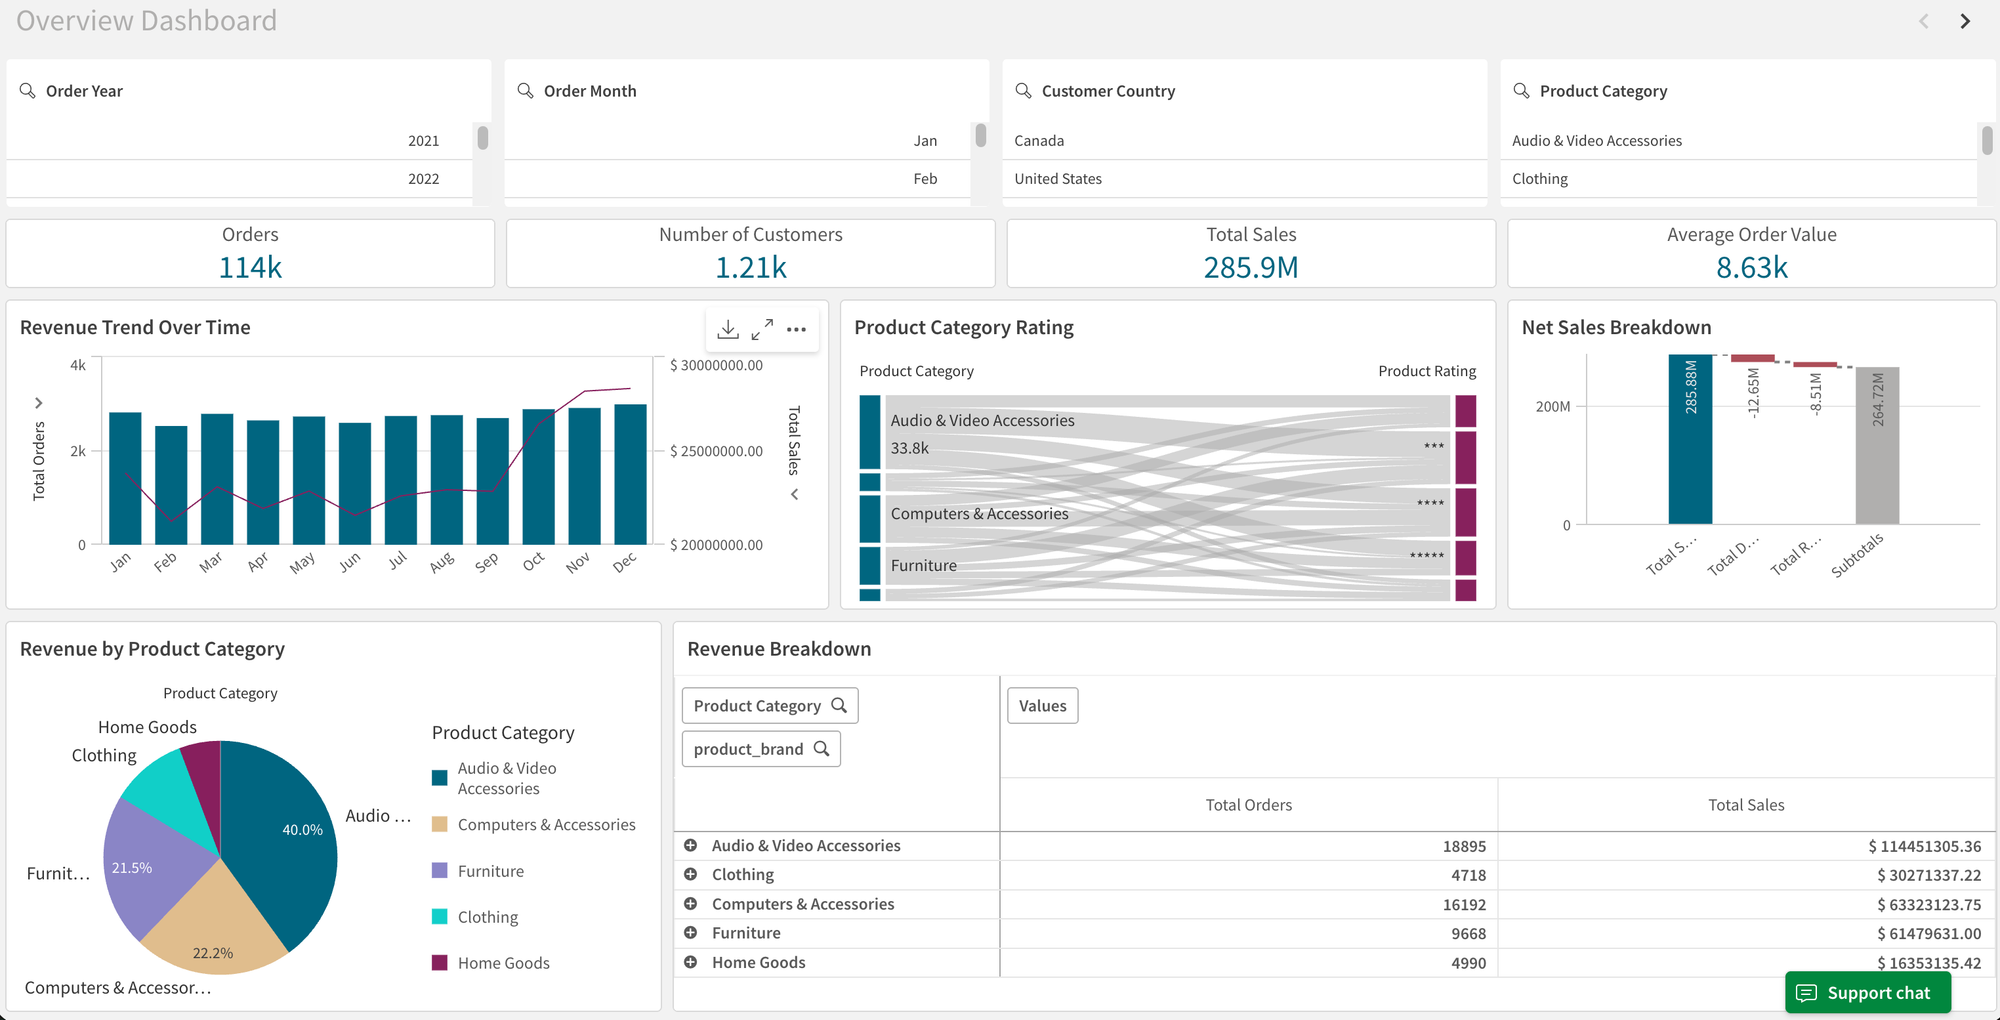
Step 3: Automate Asset and Dashboard Generation
With dimensions and metrics defined in the semantic layer, GoodData assets are generated programmatically as YAML, including datasets (logical models mapped to physical data) and metrics (centralized, reusable KPIs).
This automation is possible because GoodData follows an analytics-as-code approach, with clear, machine-readable rules that define how datasets, metrics, visualizations, and dashboards are structured.
With GoodData MCP support in Cursor, these rules are also exposed to AI agents, enabling Cursor to work safely and deterministically with GoodData objects. As a result, visualizations and dashboards can be generated automatically.
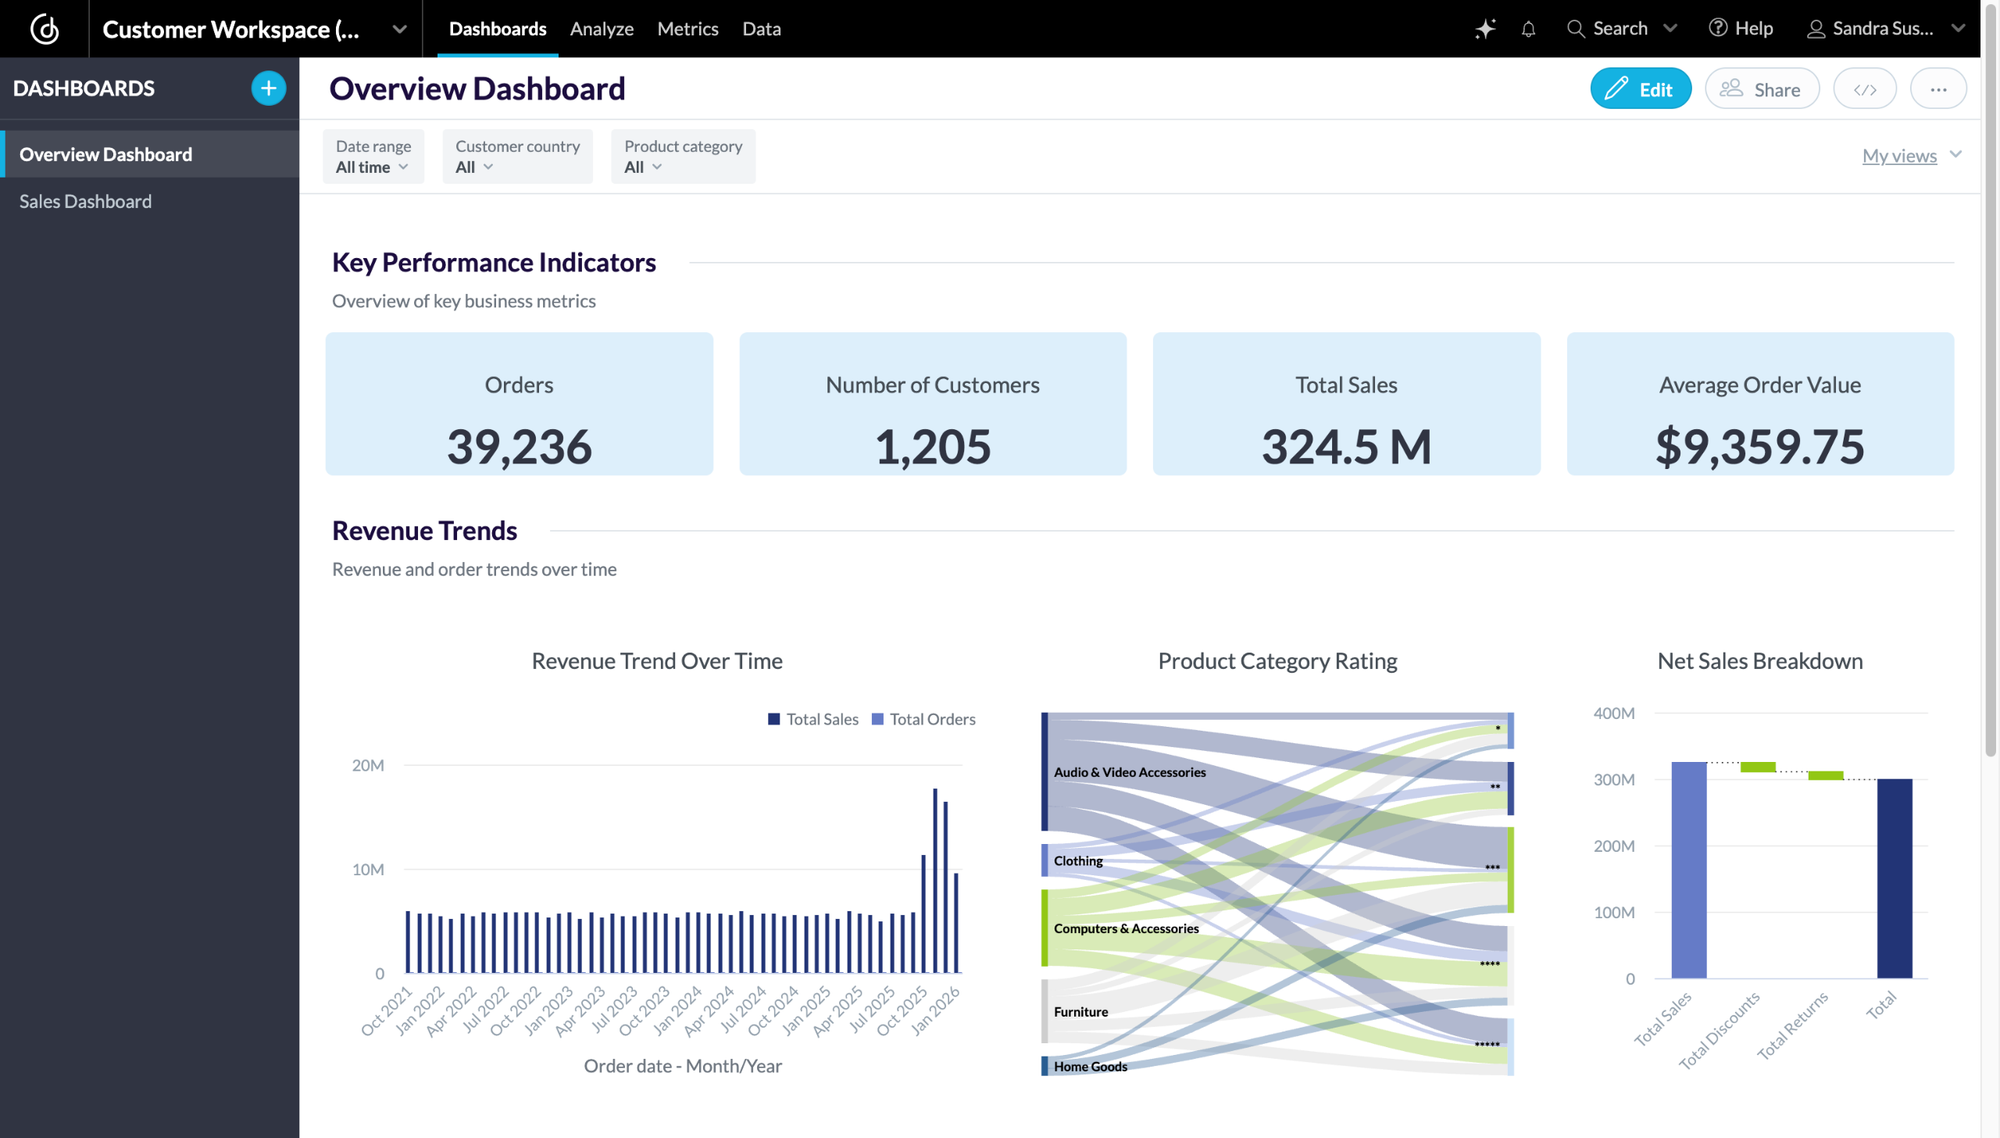
This shifts migration from manual dashboard rebuilding to automation-first modernization, enabling consistent filters, shared hierarchies, and significantly reduced manual effort. At this point, every dataset, metric, visualization, and dashboard exists as YAML and is ready for validation and deployment.
When required, existing Qlik layouts can be provided as additional context in the form of screenshots, which can be used to fine-tune dashboard structure in GoodData.
Step 4: Validate and Deploy
Using the GoodData VS Code extension, the converted Qlik assets — data models, metrics, visualizations, and dashboards — can be validated and deployed directly to the GoodData UI.
At this stage, the entire analytics project exists as code, enabling repeatable validation, controlled deployment, and safe iteration as part of a standard development workflow.
Beyond Migration: An AI-First Analytics Foundation
Once analytics objects are deployed as code, teams gain more than a completed migration; they gain a modern, AI-ready analytics stack.
Because GoodData defines metrics and semantics in a governed, code-readable way, they can be safely consumed not only by dashboards but also by AI-driven workflows and agents. This enables natural language querying, automated analysis, and agents acting on trusted business metrics.
With analytics-as-code and well-defined interfaces, GoodData fits naturally into modern data stacks and AI development environments.
Migration becomes the starting point for modernizing analytics, not the end.
Results: What Teams Gain After Migration
Teams that modernize first and migrate second see clear, measurable outcomes:
- Faster migrations with significantly less manual effort.
- Fewer regressions and inconsistencies during and after migration.
- Reusable business logic shared across tools, teams, and use cases.
- An AI-ready analytics foundation built on governed, machine-readable semantics.
- Renewed trust in metrics through consistent definitions and validation.
In short, teams modernize their analytics foundation once, migrate with less friction, and are better prepared for AI-driven use cases.
Conclusion: Migration Is a Moment — Use It Wisely
BI migrations are often treated as operational projects: move dashboards, validate numbers, move on. But in reality, migration is one of the few moments when teams can step back and change how analytics actually works.
As AI, automation, and embedded analytics become part of everyday decision-making, the foundations of BI matter more than ever. AI doesn’t create clarity on its own; it depends entirely on consistent definitions, shared context, and governed metrics. Without that foundation, adding AI only amplifies inconsistency and erodes trust faster.
Modernizing BI during migration changes the trajectory. Instead of carrying forward dashboard-centric logic and technical debt, teams establish a governed, reusable analytics foundation that serves dashboards, applications, and AI equally well. Migration becomes not just a platform change, but a structural upgrade.
For teams moving from Qlik to GoodData, the goal isn’t simply to recreate what existed before. It’s to take advantage of the moment — to modernize once, migrate faster, and build an analytics foundation that’s ready for what comes next.


