The easiest way to create up-to-date insights from multiple CSV files? GoodData and its modeler with S3 distribution!
4 min read | Published

So, you’ve got multiple CSV files, with data scattered among them; customer details, payments, purchases, and who knows what else. But what to do with all that data?
An essential part of any analytics solution, no matter the amount of data, whether you’re building it for your team or as insights in your SaaS application, is the necessity of creating a data model. Why? Because a data model transforms the mass of jumbled information into a real-world interpretation.
So, let’s take a look at how easily you can create meaningful insights from your data, stored in multiple CSV files.
Step 1: Load the data and make a model in GoodData
Creating a data model can be a challenging step in realizing your analytics project - importing data from a data warehouse and connecting it inside your analytics platform - but not with GoodData.
The GoodData web-based modeler, coupled with the possibility of data modeling with CSV files, lets you quickly and easily prototype, edit and publish a data model within the GoodData platform. Allowing you to get up and running quickly, without the lengthy time frame of connecting an external data warehouse.
The web-based LDM modeler brings drag-and-drop functionality to your data analysts and allows them to easily communicate and explain the data model to the rest of the team. And due to it all being integrated into a single interface, data engineers, data analysts, and business users can all collaborate and work together in one unified environment. Thus, you spend less time on setting up analytics within your project, and more time testing and refining your product before roll-out.
This video shows you how CSV files are loaded and transferred to a dataset in the model.
So you have the CSV files with payments and purchases loaded, added within your model and now you can publish the data. As you can see in the video, we chose not to publish the data, only the data model. Why? Because we want the CSV files to be up-to-date in an automated way regularly. That’s where AWS S3 distribution comes in.
Experience GoodData in Action
Discover how our platform brings data, analytics, and AI together — through interactive product walkthroughs.
Explore product toursStep 2: Setup automated S3 distribution
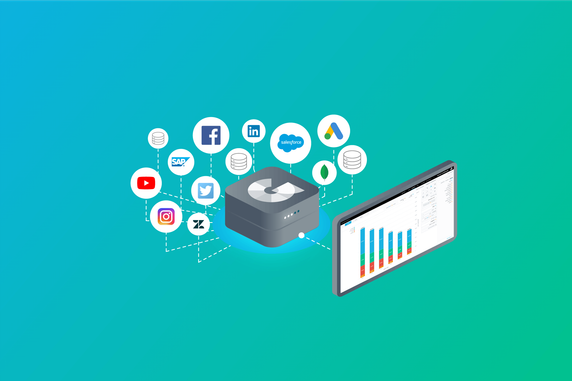
Managing data sources and their distribution in GoodData is made that bit easier with our automated S3 distribution support. It lets you bring data from external third-party applications via AWS S3 (Amazon Web Services) and load them into GoodData in order to populate your data model with data.
Once the connection between S3 and GoodData has been set up, then starts the process of downloading your data into GoodData. Because the process is automated, once the connection has been established, it’s simply a matter of creating a schedule to bring in new data at an interval of your choosing.
So, the data has been loaded and configured to be automatically updated. At this point, you can start analyzing your data from your CSV files, but let’s continue with a more complicated scenario.
As your business, and subsequently your source data, evolve, so your analytics needs changes. You will need to update the existing model and prototype relationships between newly added datasets, in order to build reports for your customers on top of the new data, in their production analytics environment.
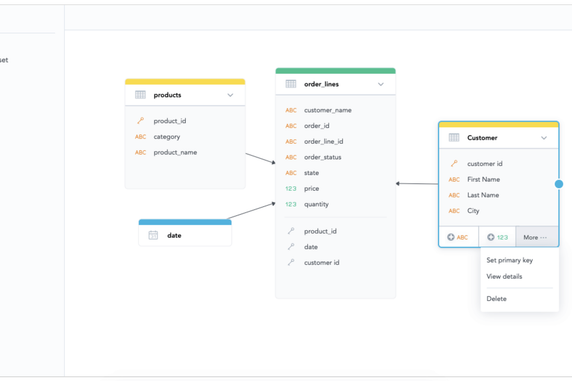
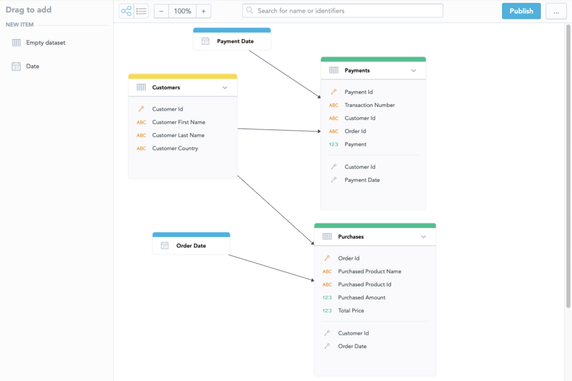
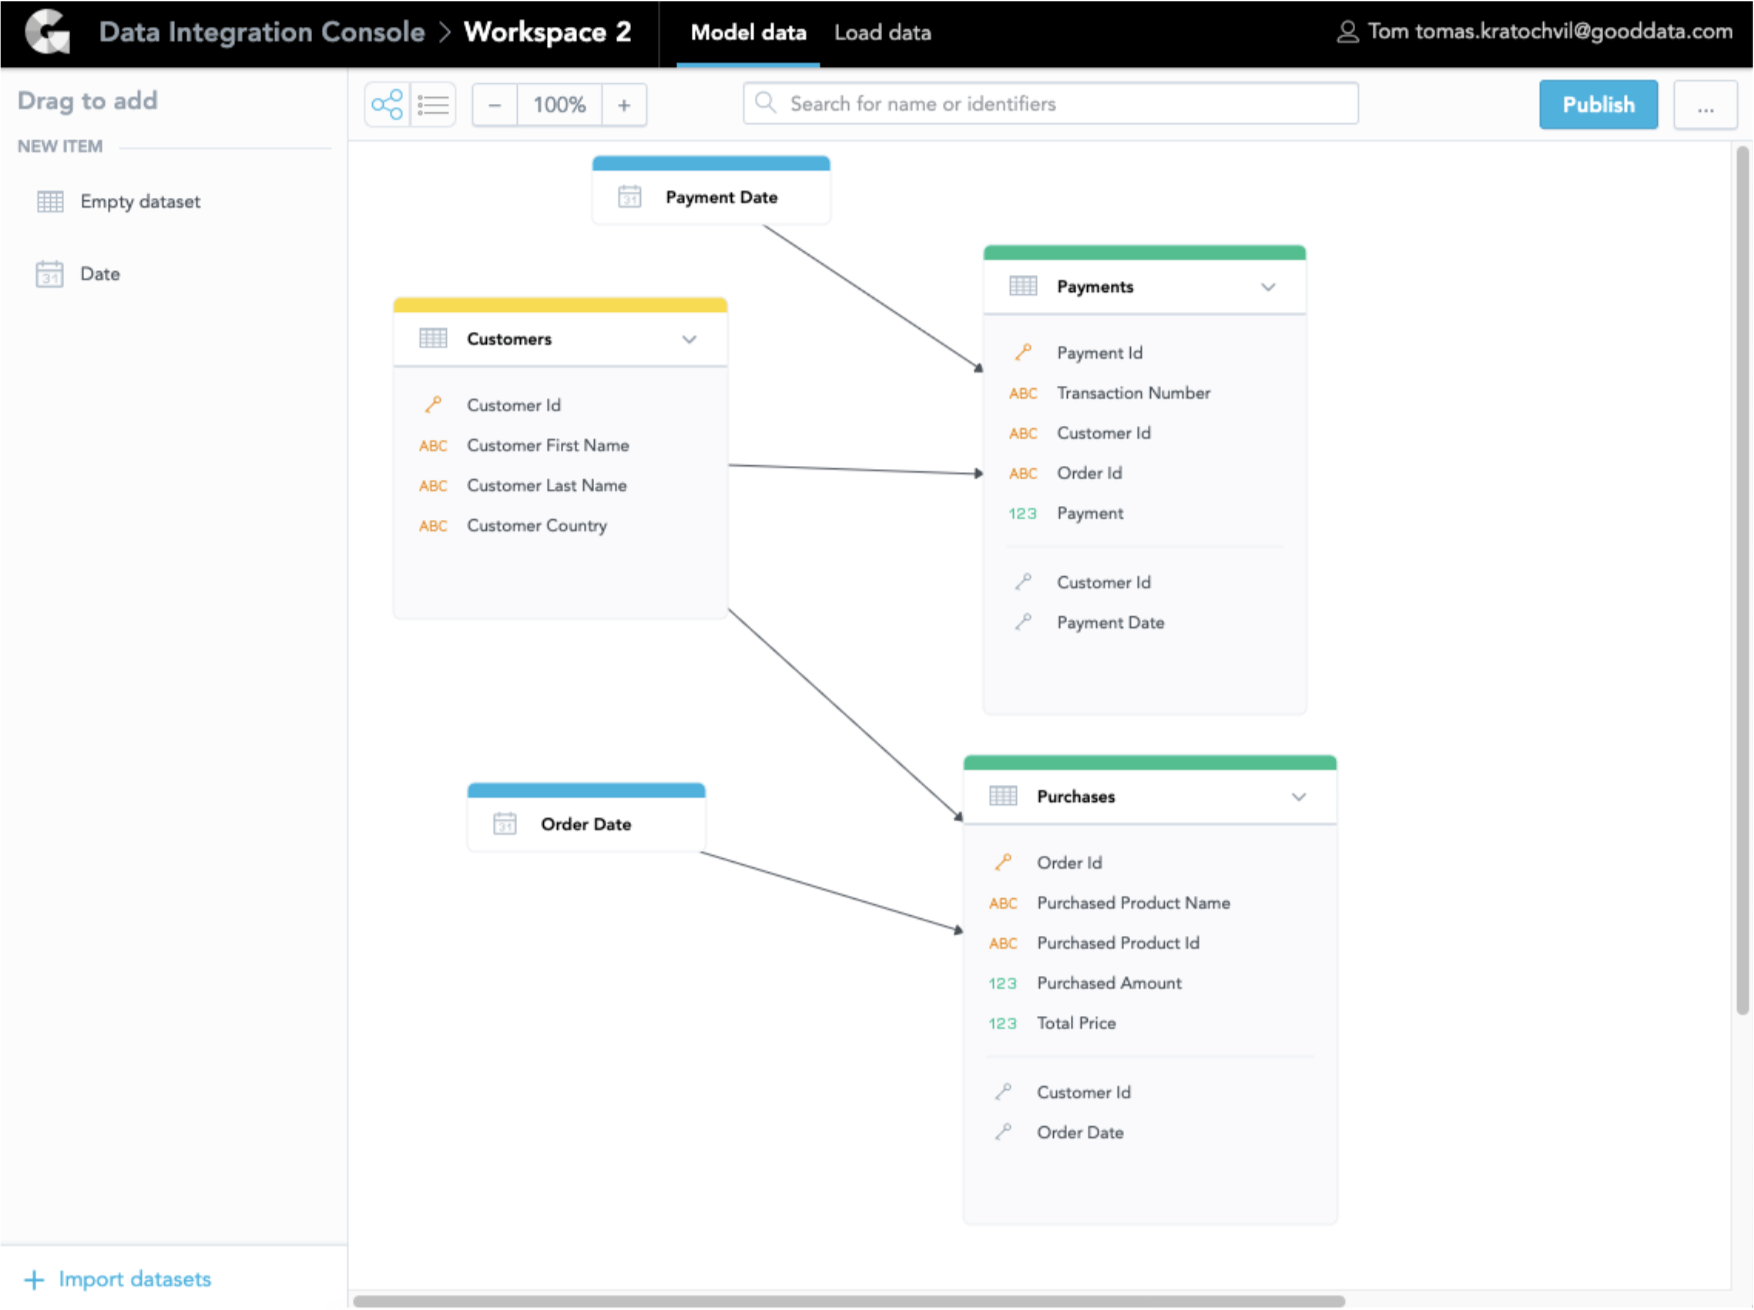
For instance, you have another dataset with customer data and want to add it to your existing model. To do this, within the web-based modeler, you need to create a new dataset; Customers. Since you already have built the reports with customer-related attributes, you might be afraid of removing the attributes from the model, for fear of breaking the existing reports. With GoodData, that isn’t an issue. You simply move the attributes between datasets via our drag-and-drop modeler and GoodData then preserves the identifiers, so that none of your reports get broken.
In the image below, we moved the customer information from the Purchase (id, name, and country) to the new Customer dataset, created a primary key from Customer Id, and mapped the relations between the Customers, Purchases, and Payments tables.
Step 3: Build your insights
Now you can see our first insights on top of the data you have added to the model, as you can see in the video below, with the self-service discovery tool, that is fully embeddable into your product. Moreover, as you can see, the tool suggests recommended reports to be created as well as helps you by showing only the relevant attributes according to the model. This, in particular, helps less data-literate users to build reports on combinations of metrics and attributes that make sense. Some might call it an extra artificial intelligence, but for GoodData this standard.
These insights and dashboards might eventually become an interactive dashboard shared with your peers or an at-the-point-of-work insight embedded into your SaaS product and used by your customers, such as you can see in the application below:
In a matter of minutes, you can bring your CSV files, prototype a data model, create impressive insights, and set up an automated connection to keep your data fresh, all with GoodData.
So, whether you’re looking to test-run a new SaaS application or roll out analytics functionality to specific customers, you can now easily try our free trial and get set up with a data model, in minutes, without the need for data warehousing.
Already using GoodData want to learn more about CSV modeling and how fast you can create insights from your data? Register and watch our GoodData University course!
Experience GoodData in Action
Discover how our platform brings data, analytics, and AI together — through interactive product walkthroughs.
Explore product tours