Analytics for Data-Driven Product Management
6 min read | Published


Many organizations have implemented modern agile or lean methodologies, which means they constantly build, test, and iterate to better meet customer needs and stay ahead of the competition. Consequently, product managers are expected to alter course after every iteration and make decisions to ensure that their products succeed in the marketplace.
These product-related decisions are hard to make without good data. Successful product managers validate hypotheses about market needs as often and as quickly as possible by referencing past experience, instinct, competitive analysis, and market research, but even feedback from one of your largest customers has to be validated through data. After all, you decided to build a product, not a one-off solution for single customer. This is the reason why many teams implement data-driven product management to facilitate informed decision making. They need to measure usage and satisfaction levels to learn if their ideas were successful as part of a “build, measure, learn” cycle.
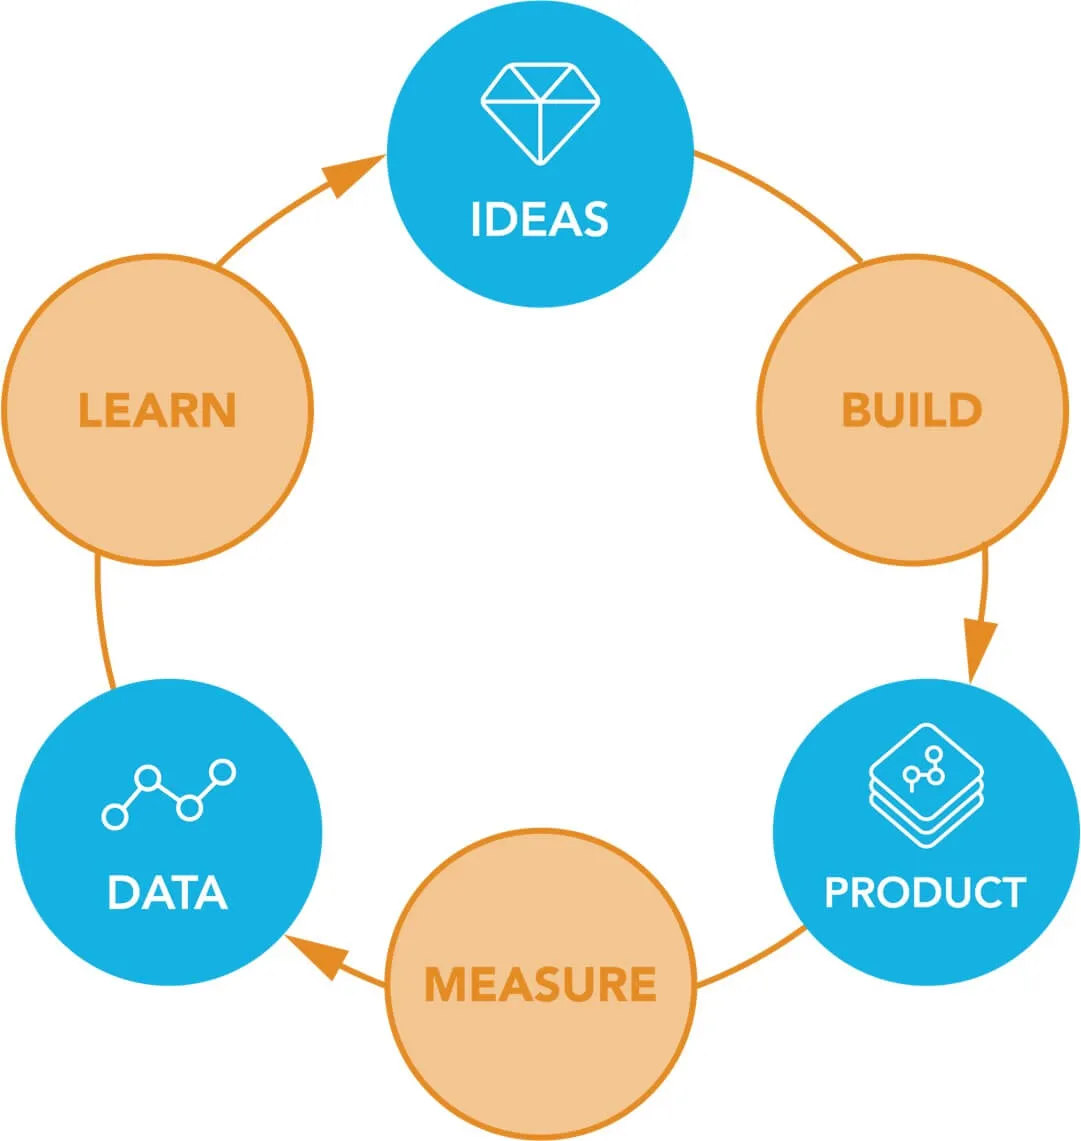
Figure 1 Traditional lean cycle flow
Product management metrics
Product managers today have many data sources available to them, which can be combined with sentiment analysis of customer feedback to give a 360-view of application performance. Business intelligence tools like GoodData give SaaS vendors the ability to collect data stored in many data centers and combine it in one place that is accessible through a web browser. Product teams can then use that data to define their user adoption strategies, integrate it with customer relationship management (CRM) tools, and make informed decisions about the product roadmap of their SaaS applications.
SaaS businesses typically use a standard set of metrics to measure performance of organization, such as monthly recurring revenue (MRR) or customer churn. Many features do not have direct relation to revenue and it would be great to know about risk of churn upfront, therefore I recommend using a different set of key performance indicators.
The basic need of product managers is to measure usage and the satisfaction level of their users. The product manager wants to validate newly introduced features and see how they are adopted by the customers. High usage and satisfaction levels indicate customer loyalty and reduce the risk of churn.
To best measure usage and customer satisfaction levels, I suggest using the metrics of adoption and engagement. Some people use adoption and engagement interchangeably and confuse them. While they are related, they are not the exact same thing, so let me begin by clarifying the terms.
- Adoption focuses on new usage
- Engagement measures involvement of users with the product and how much they use it
These key performance indicators are good for validating ideas based on historical data, but they can also be used by data scientists as so-called features in machine learning algorithms. You can start to recognize patterns in product usage and identify new customer segments with little help from artificial intelligence. All these inputs help you make corrective actions to prevent churn. SaaS companies, which operate in the B2B sphere, may also provide data about usage to their clients to help them drive use adoption.
Adoption
Adoption is very much about first-time user experience. Are there any obstacles in the way? Is the product or feature compelling? The first impression should be great. Analytics can provide you some quantitative data in order to help you map the customer journey before the product or feature is adopted.
You have to define who you want to count (for example, users or, in the case of B2B, accounts) and at what point you consider the product/feature to be “adopted.” In some cases, opening the application does not mean it is actually adopted. The best practice is to start with a meaningful goal (i.e. moment in a workflow), and as soon as the user reaches it you can consider the product or feature as “adopted.”
Adoption can be measured in absolute numbers or as a percentage of all users or accounts of your customer base. Product managers can measure adoption from adoption of a product as a whole down to adoption of individual features. You can also differentiate between two types of adoption:
- Internal adoption measures the use of new features for the first time by existing users
- External adoption measures new users beginning to use existing features
To begin measuring adoption, I typically recommend that companies take a look at three key areas.
Adoption rate/percentage of first-time users
Adoption rate is a percentage of new users who used the feature for the first time, and it is usually computed for a specified time period. The total number of users for a percentage calculation is typically taken from the date when the period of interest ends.
Time to first action
This metric measures mean time for new users trying an existing feature or existing users trying a new feature for the first time. If the time is too long, consider promoting the feature in the product, or make it more visible and appealing.
Efficiency
You may want to get more insight into why adoption of a product or feature is not as high as you expect. Perhaps the user needs to perform multiple steps of a workflow to get to a certain feature. For anything from registration to new feature activation to onboarding, you can measure how far users get in that workflow before dropping off.
Funnel analysis with a drop-off rate metric is usually a tool to identify the point at which you lose prospective customers. This may help to reveal where there is room for improvement.
Engagement
Customers appreciate products that exceed their expectations. For SaaS businesses, it is essential to consistently make the customer happy and evolve the product along with their needs. Building the right feature is sometimes not enough, because user experience is equally important for high engagement and a good customer retention rate.
To begin measuring engagement, I recommend companies take a look at five key areas.
Active users (DAU, WAU, MAU)
The number of active users is a good indicator of customer engagement. You can measure users globally or per account to measure the engagement level of your customers.
The number of unique active users is usually measured in a single day (DAU), in a week (WAU), and in a month (MAU). High engagement usually correlates with a high DAU / MAU ratio.
Usage frequency
The value the product has also relates to the frequency of its usage. Does the customer use it nearly every day, a few times per week, a few times per month? Is high usage frequency due to users having to provide some form of essential input? Or is it just a tedious, repetitive task which can be automated and done for the user?
Usage recency
Usage recency refers to the number of days or months since the last use of the product or feature.
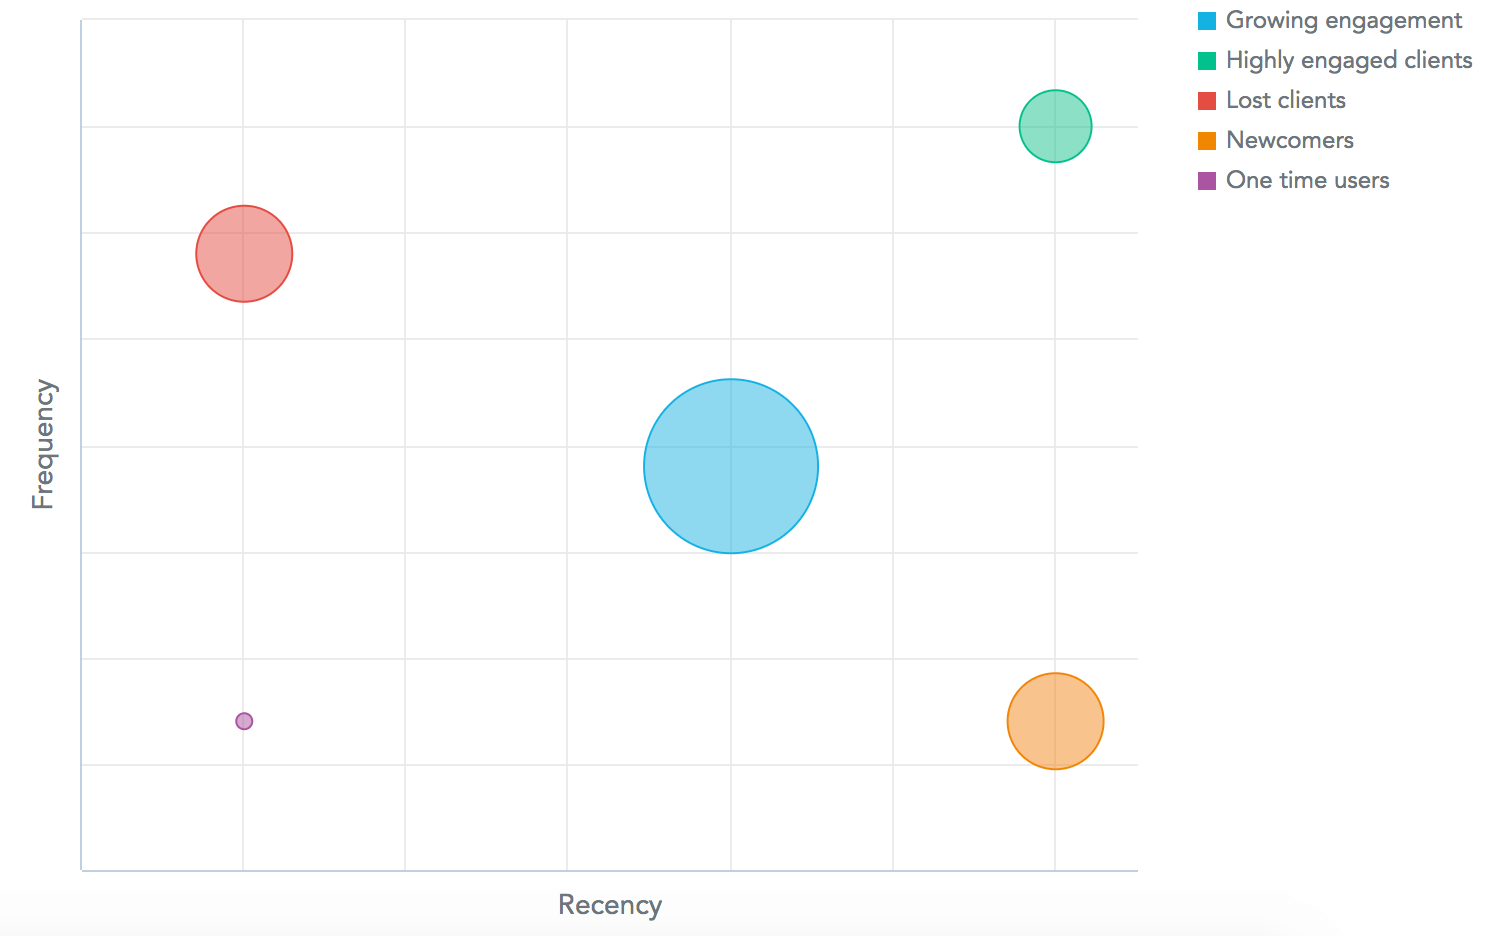
Figure 2 Recency and frequency can be used for simple segmentation of customers
Depth of use
Depth of use measures which parts of the product are frequently used to help you identify what keeps people coming back to your product. This analysis helps you focus on improving the features that provide true value for your users, and it keeps you from spending time and resources on features that will only increase product complexity—and potentially hurt user experience.
Time spent
This metric is usually measured as the number of sessions and their duration. The duration of each session should correspond to what you expect from the user. Generally speaking, high time spent means your customers are engaged. In some rare cases, too much time spent may indicate that the user experience of your product is not good, and users have to spend too much time to get their job done. You may address this by some improvement of workflow and measure the impact.
Retention
By measuring adoption and engagement, you're better able to improve overall retention. Good engagement of users is vital for the retention of users. Instead of focusing on acquiring new users, you can figure out how to hang on to the ones you already have. When you're ready to begin exploring retention, you'll likely want to use retention curves and cohort analysis.
Retention curve
Analytics can help you monitor user retention and where you might need to change your product to increase it. The tool you can use for this is a retention curve.
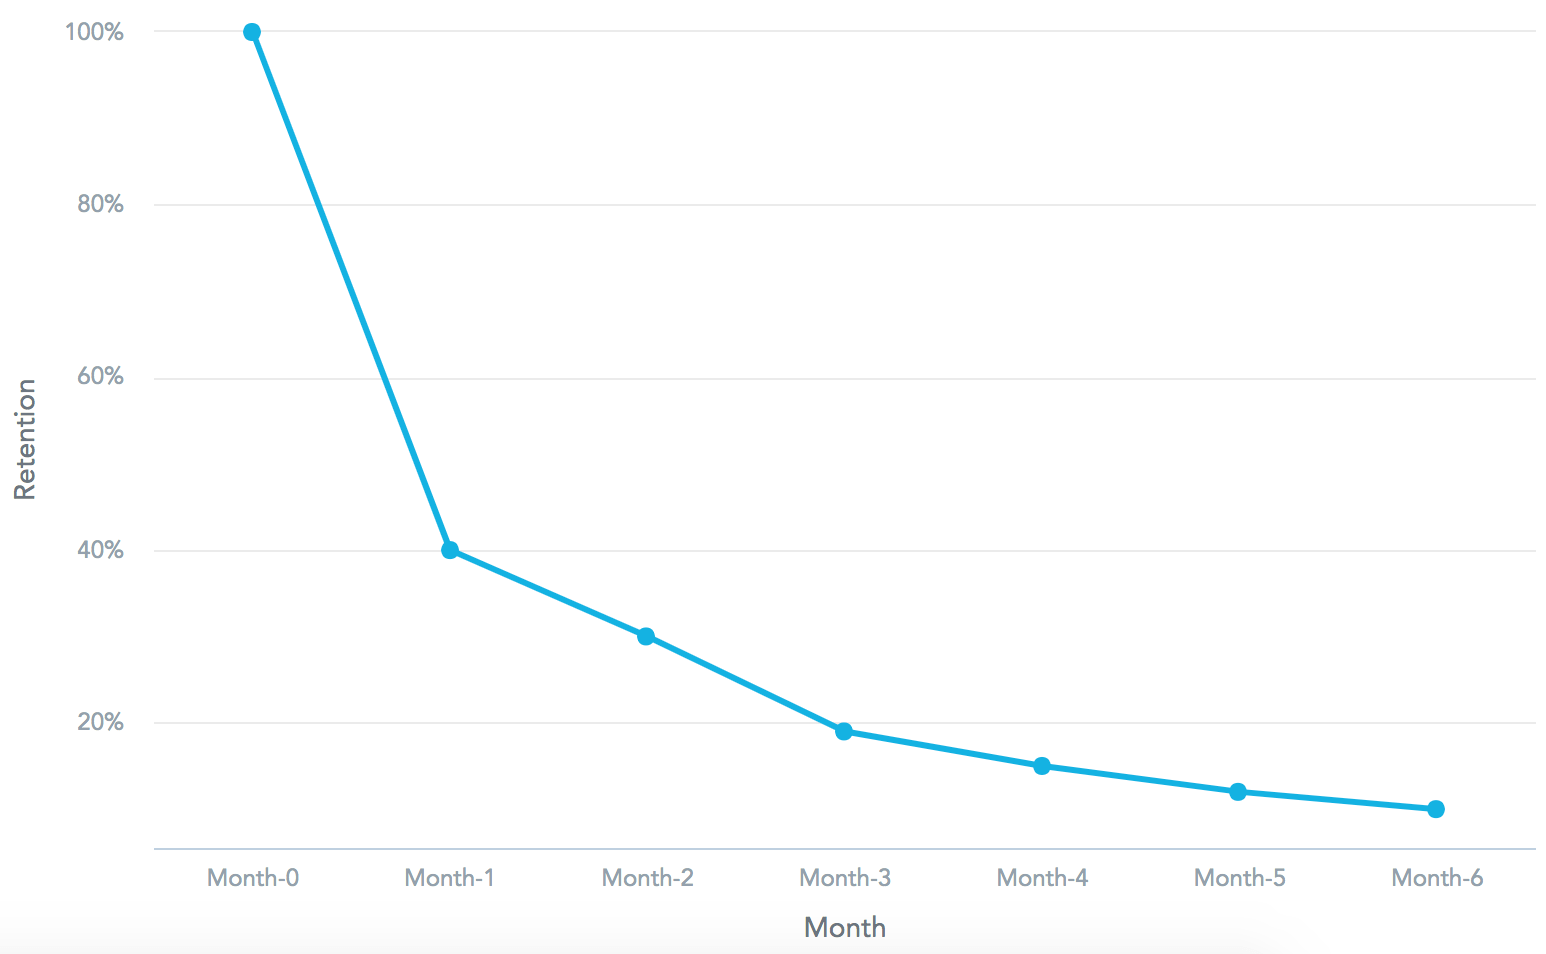
Figure 3 Retention curve
The example above shows a retention curve where 60% of users were lost in the first month after they started using the product, leading to 40% user retention. After three months, less than 20% of the acquired users still use the product. Too steep of a decline may indicate that you possibly have a problem with onboarding users.
Cohort analysis
Sometimes it is useful to find out how user retention relates to user behavior, and you’d likely rely on cohort analysis for this. “Cohort” is a term that describes a group of subjects who share a defining characteristic, or it can also refer to groups of users who perform a certain action.
Some tips on how to define cohorts
- Users that use the product for the first time in a given period (measure the impact of improved experience)
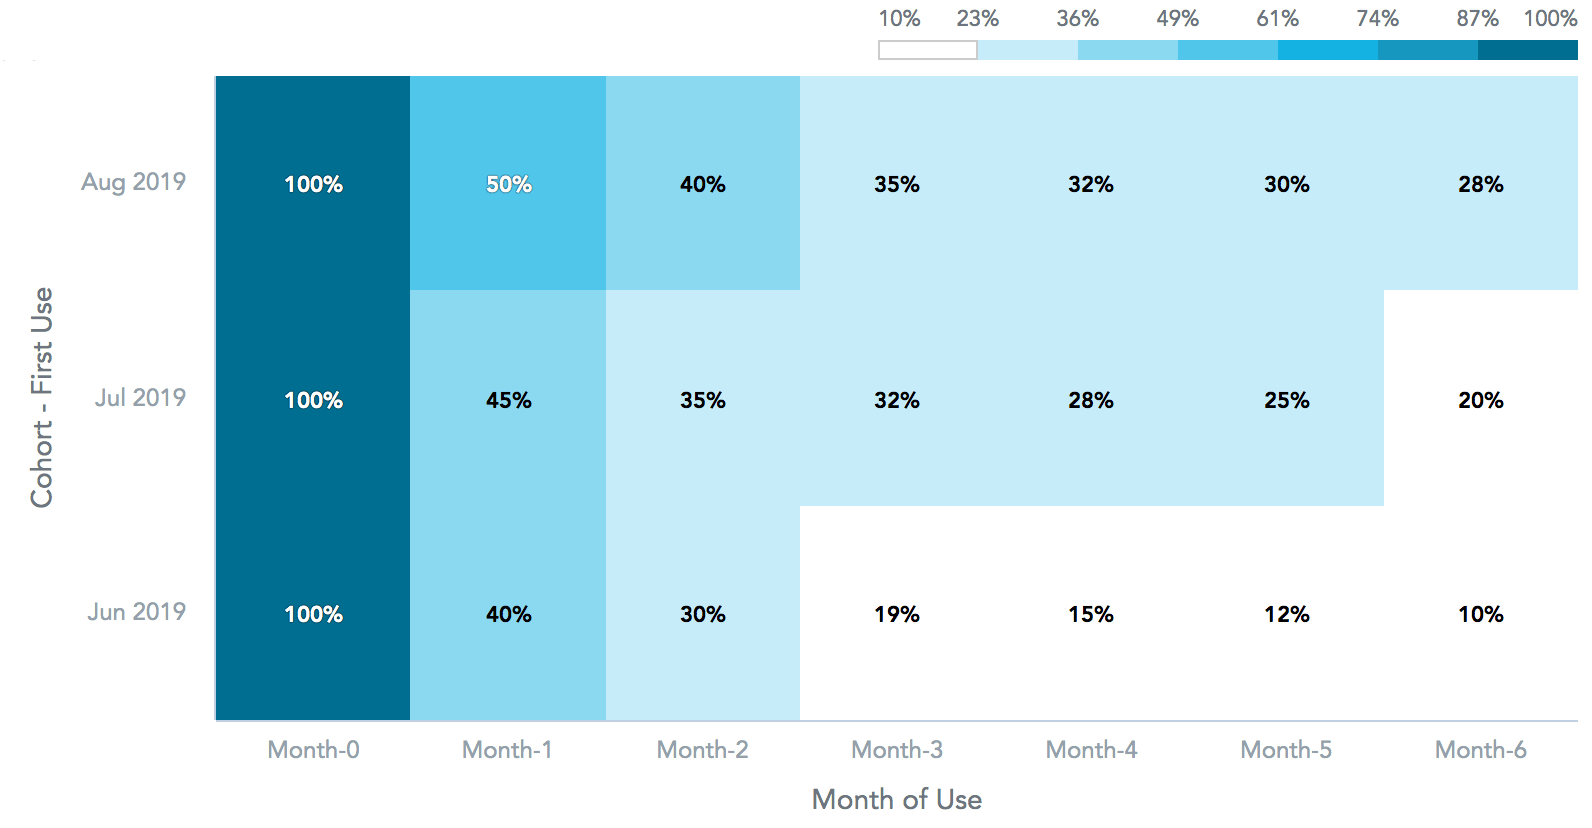
Figure 4 Example of cohorts defined by date of first use
- Users with similar depth of use (identify features that contribute to customer retention)
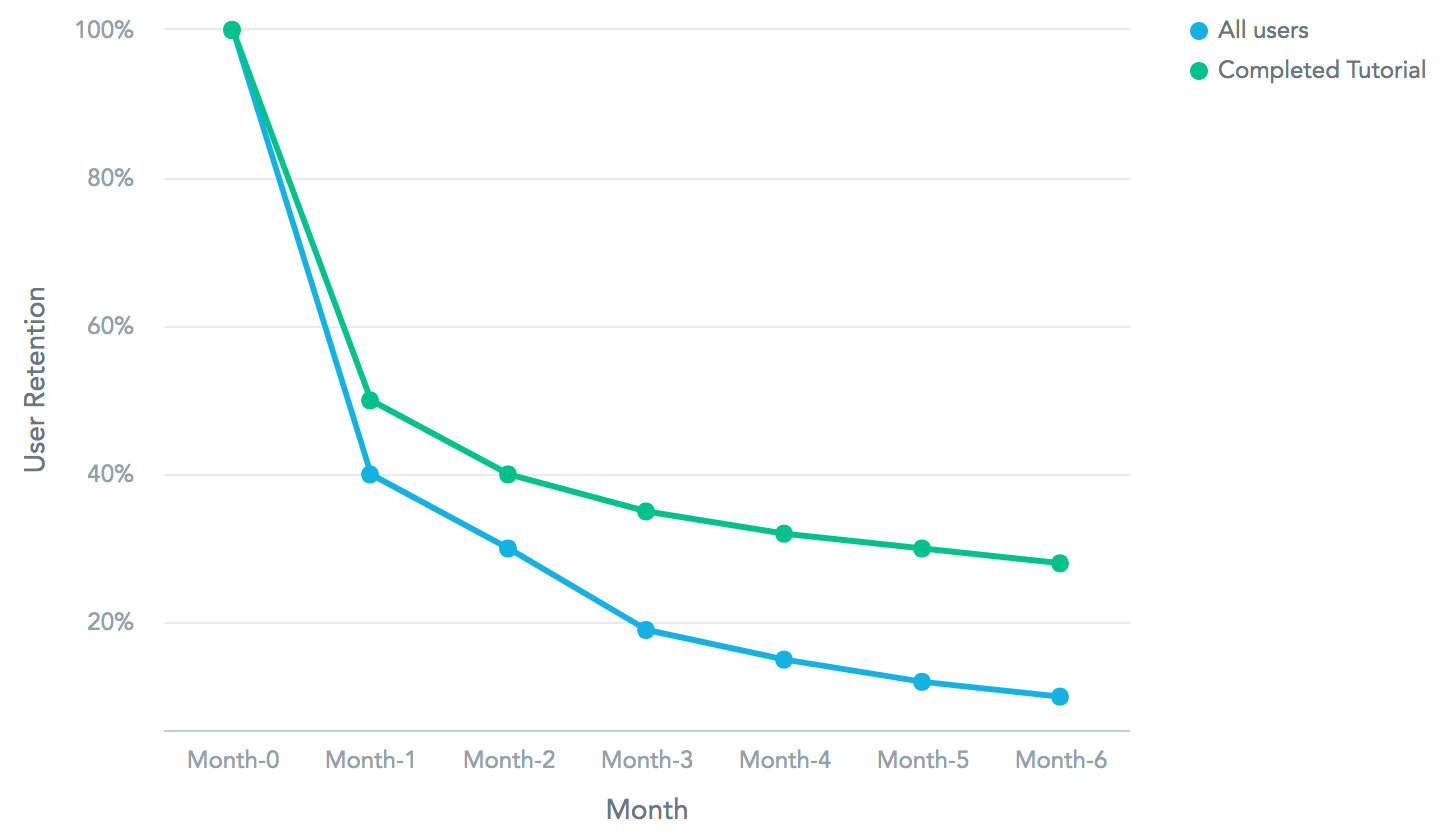
Figure 5 Example shows cohort of users who completed tutorial and compares their retention with all users
Summary
I hope the proposed indicators help you improve adoption and user engagement. Which type of analysis works the best depends on your product. You can start to measure overall product indicators, but more detailed metrics will provide even more interesting findings. You may follow up with a qualitative research to learn even more about the reasons behind the numbers.