Analytics as Code — Integrated Development Environment (IDE)


As data-driven decision-making becomes more critical in modern business, companies require advanced analytics solutions to extract valuable insights from their data. One of the latest trends in the field of analytics is the ability to create and maintain analytics as code — with this approach, companies can significantly increase productivity by reducing context switching and duplication of effort.
Developers can write and maintain analytics code in the same integrated development environment (IDE) they use for their other coding projects, eliminating the need to switch between different tools or platforms. How do we do that in GoodData?
GoodData — Current Experience
Today you can work with GoodData with the help of APIs, GoodData Python SDK, or even with GoodData UI SDK. You can even run everything locally on your computer thanks to GoodData.CN Community Edition docker image.
The typical flow we used in our demo projects (How to Build Sales Analytics, How GoodData Integrates With dbt, or How To Build a Modern Data Pipeline) is that we made heavy use of dbt and built the whole data pipeline, including analytics, using code — Analytics as Code. We really liked this experience which does not require context switching and you can do everything in one place.
So we started to think about what would be the next step to improve this developer experience. Our idea is an IDE plugin that would take this all-in-one experience even further. Sounds interesting? Read on!
GoodData — All-in-One IDE Plugin
Collaboration
If you apply the best software engineering practices to analytics as code approach, you need to be able to cooperate with other analytics engineers. What can be better than using a well-known approach of branching and seeing commit history?
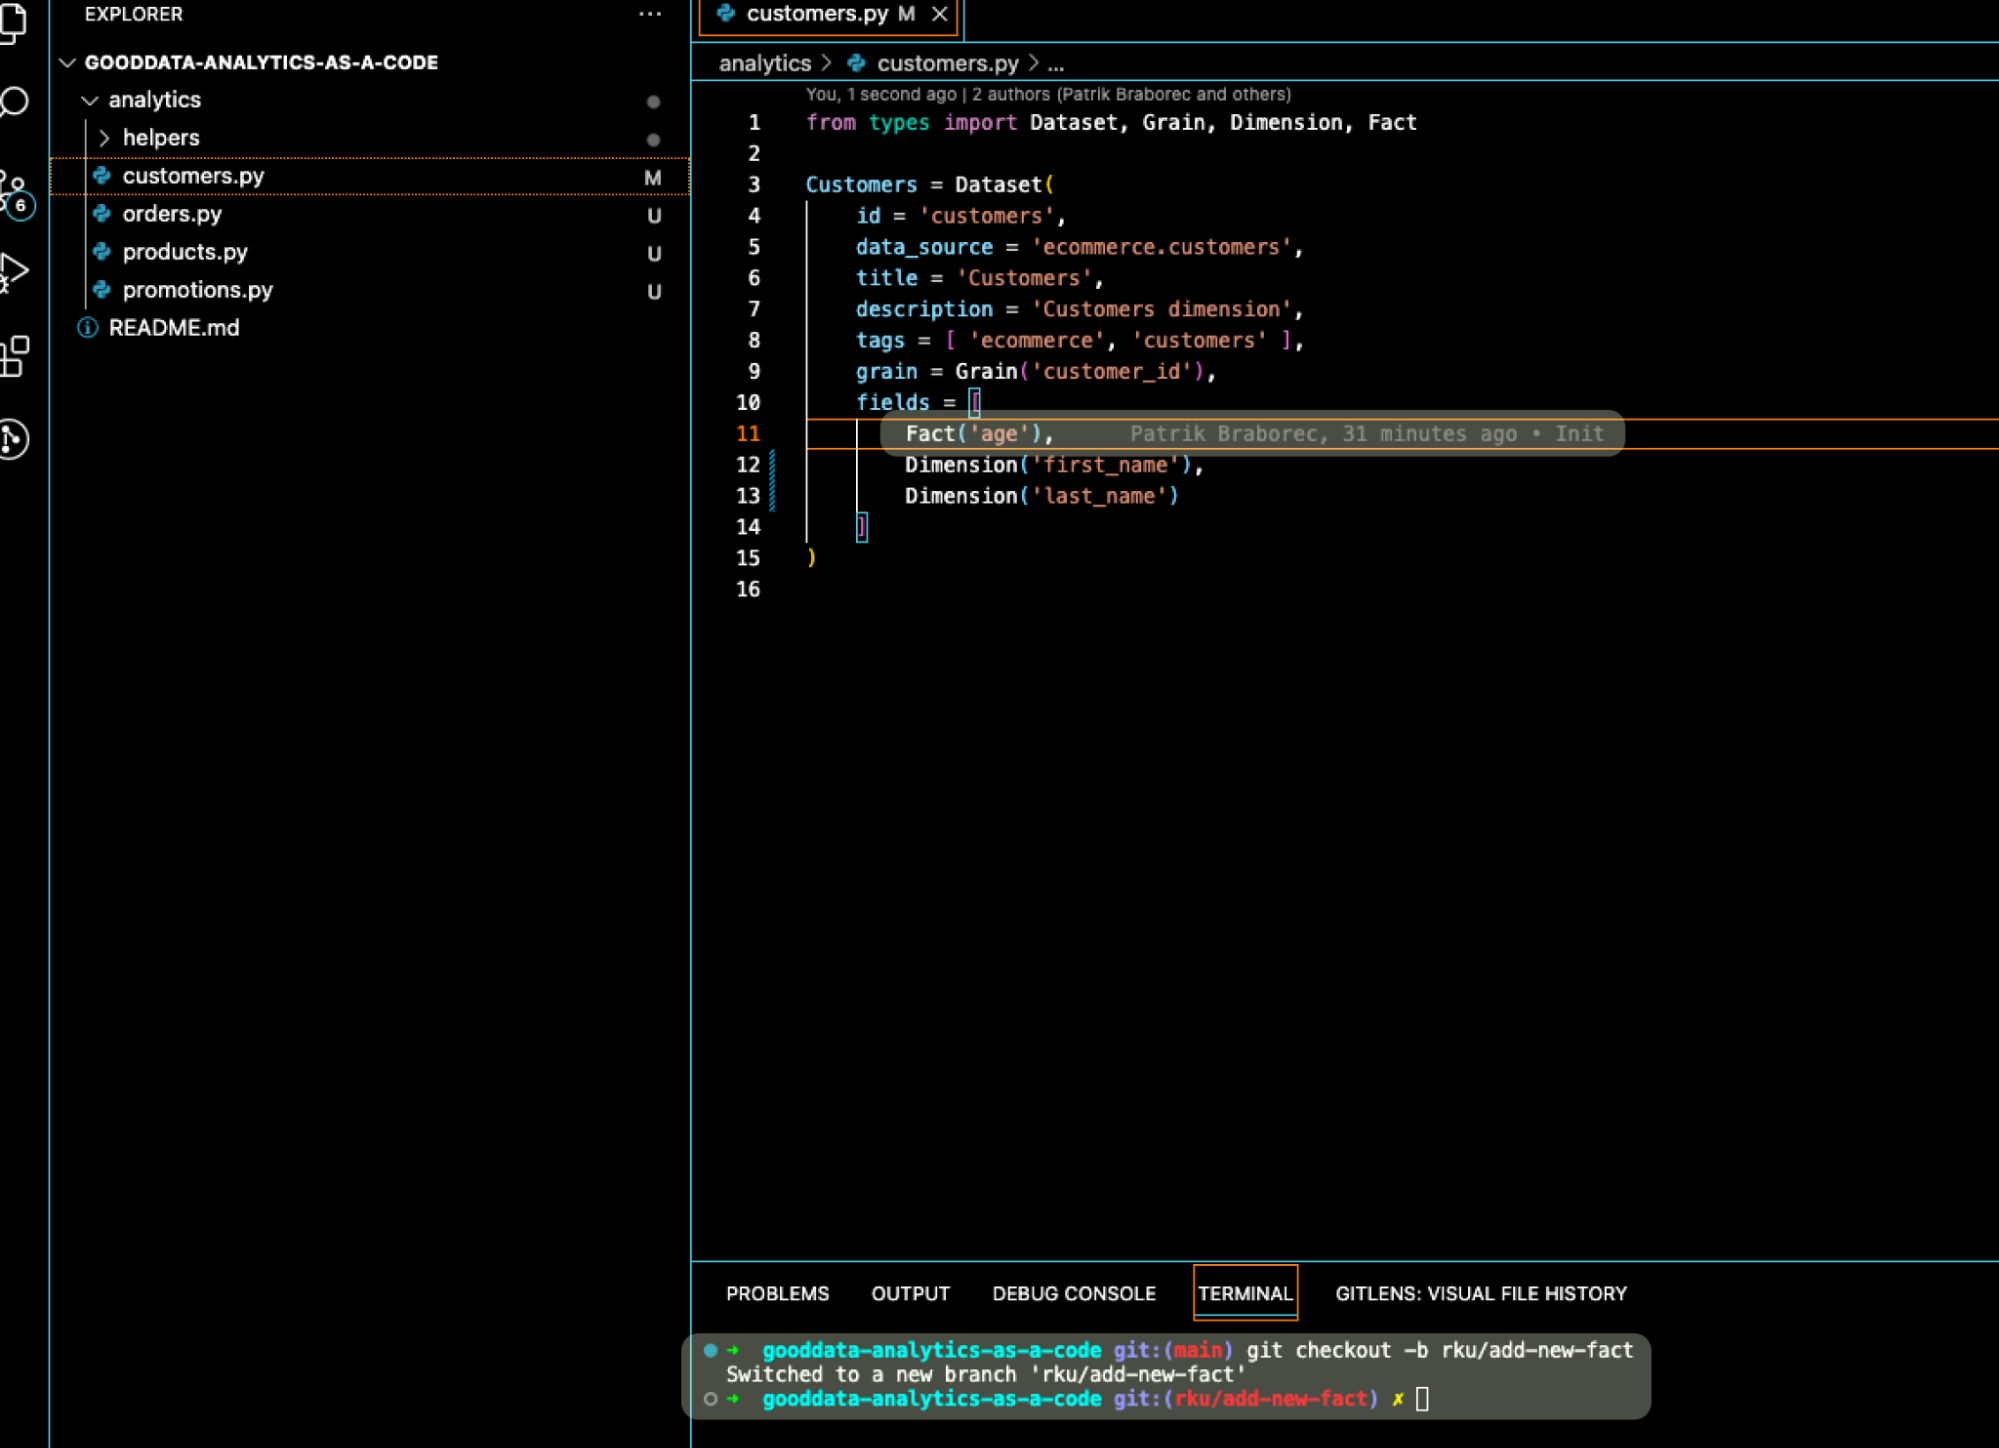
You can easily see in what state your analytics is, who is making changes or developing new functionalities.
Change Management
How to contribute and change the analytics? Again, use the best software engineering practices — commit your changes and observe them in analytics.
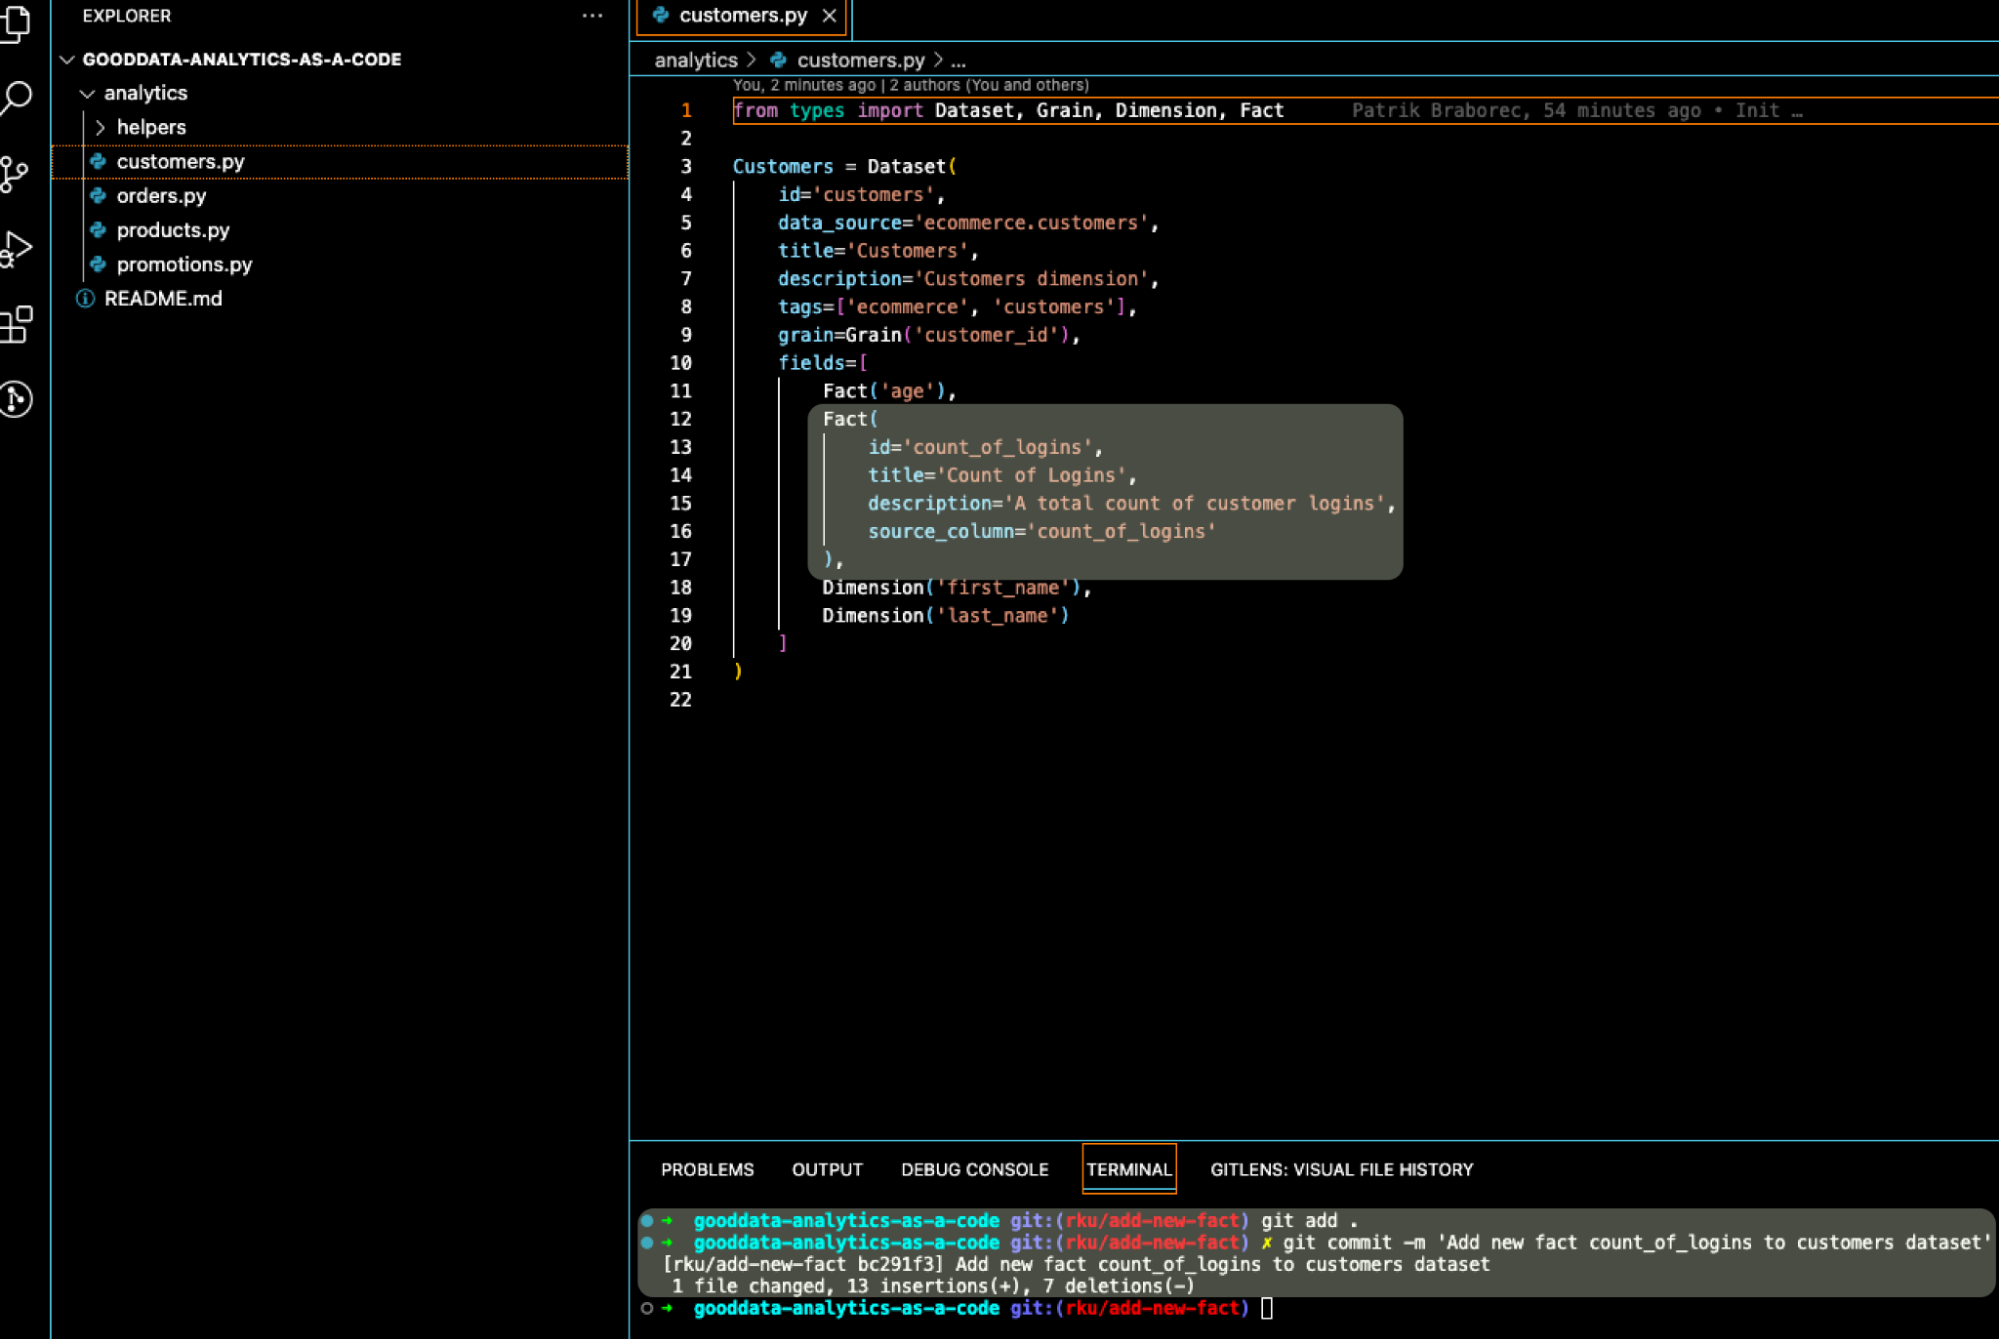
Do you want to see the result? Just type a command show model and observe changes in the model (added fact count_of_logings):
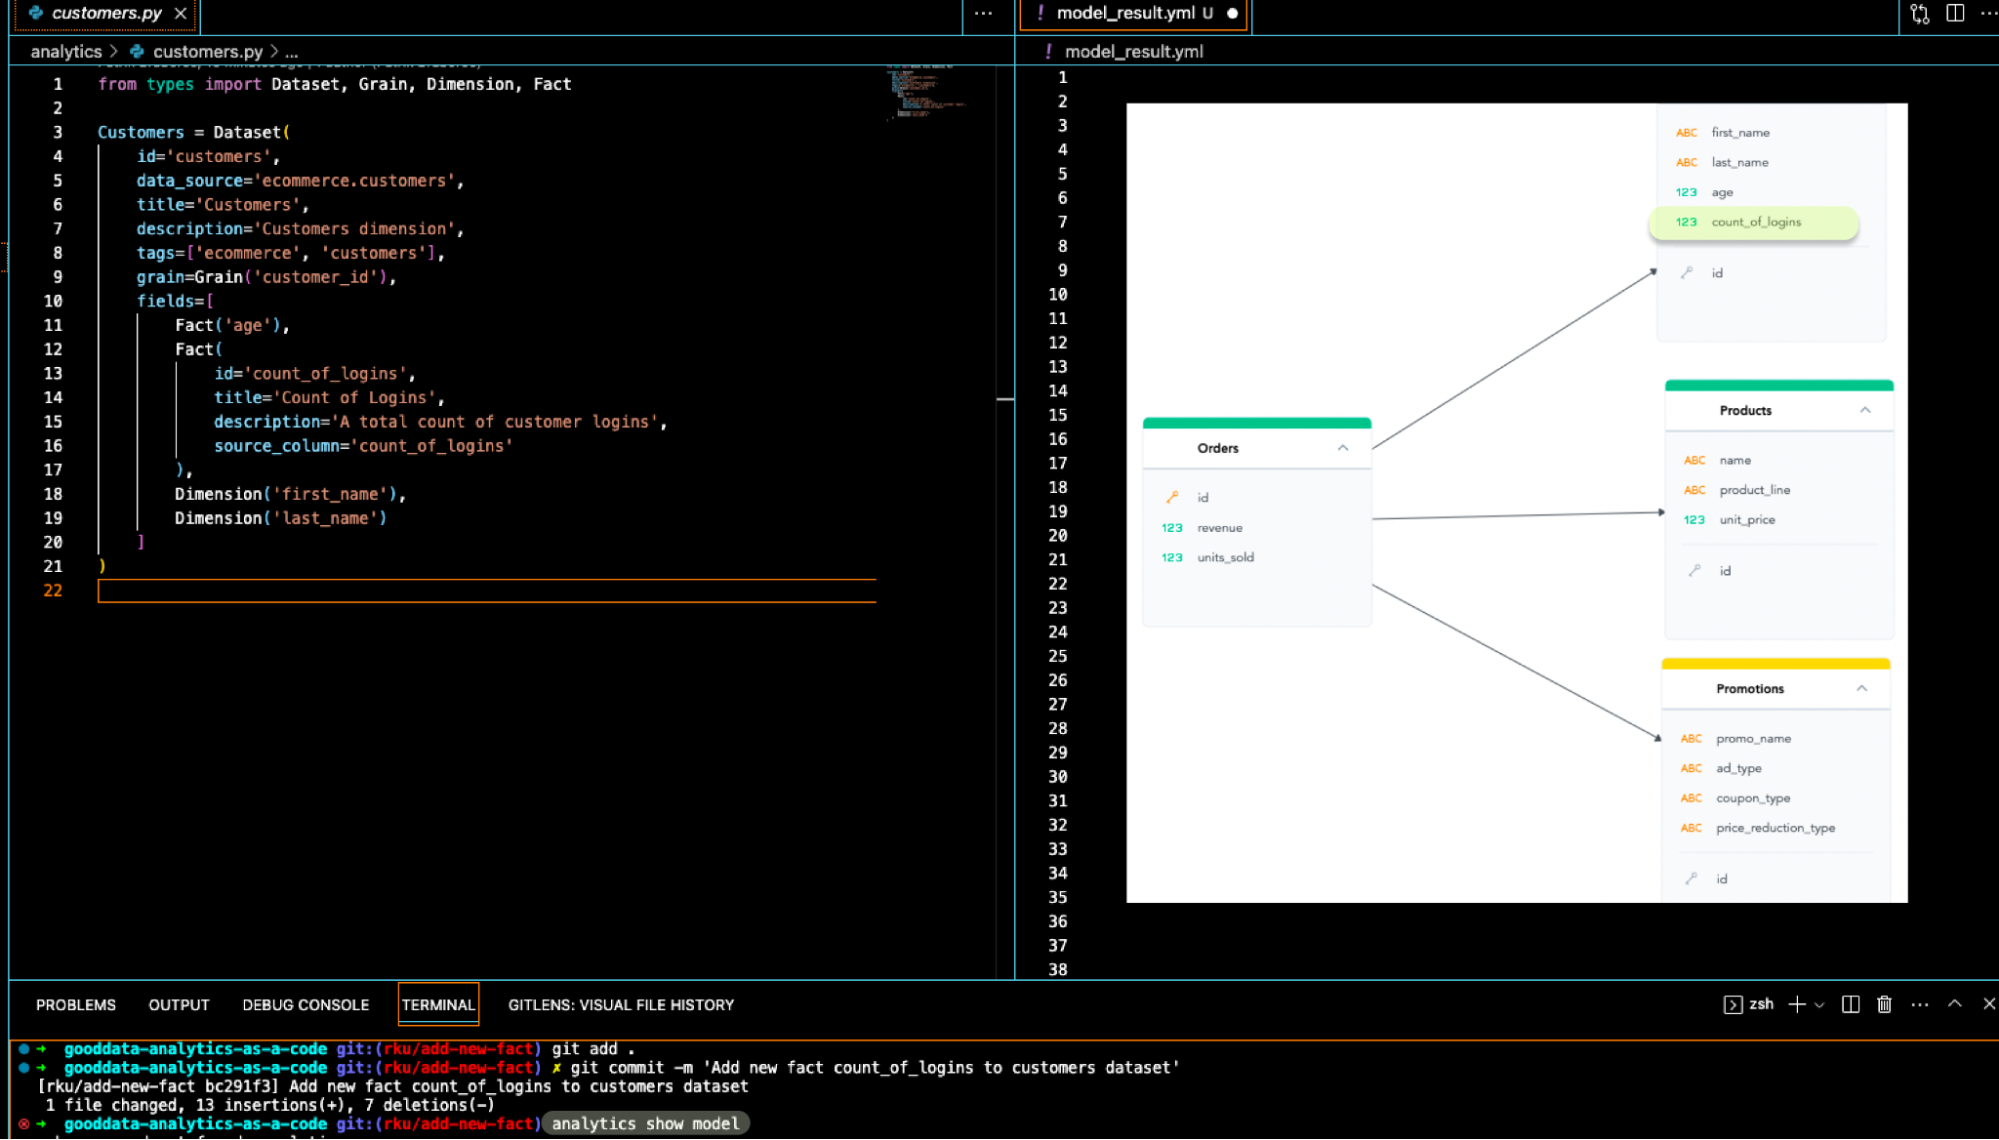
Effectivity
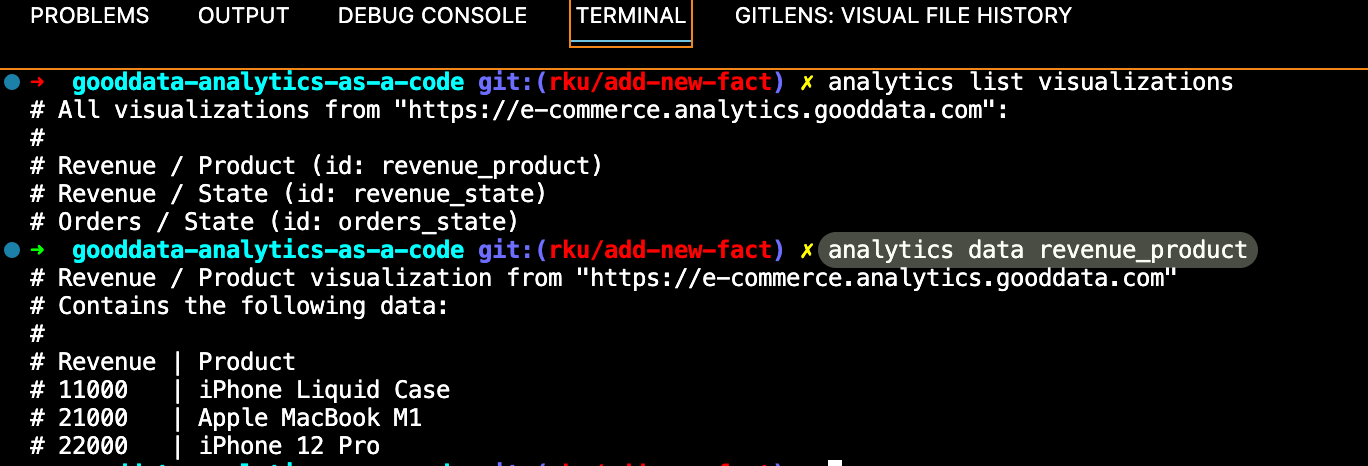
The best way to be effective is to stay in one environment and minimize context switching. Do you want to see data from your analytics? First, list all of your visualizations:

Now, let’s say you want what data contains revenue_product. Just type analytics data revenue_product:
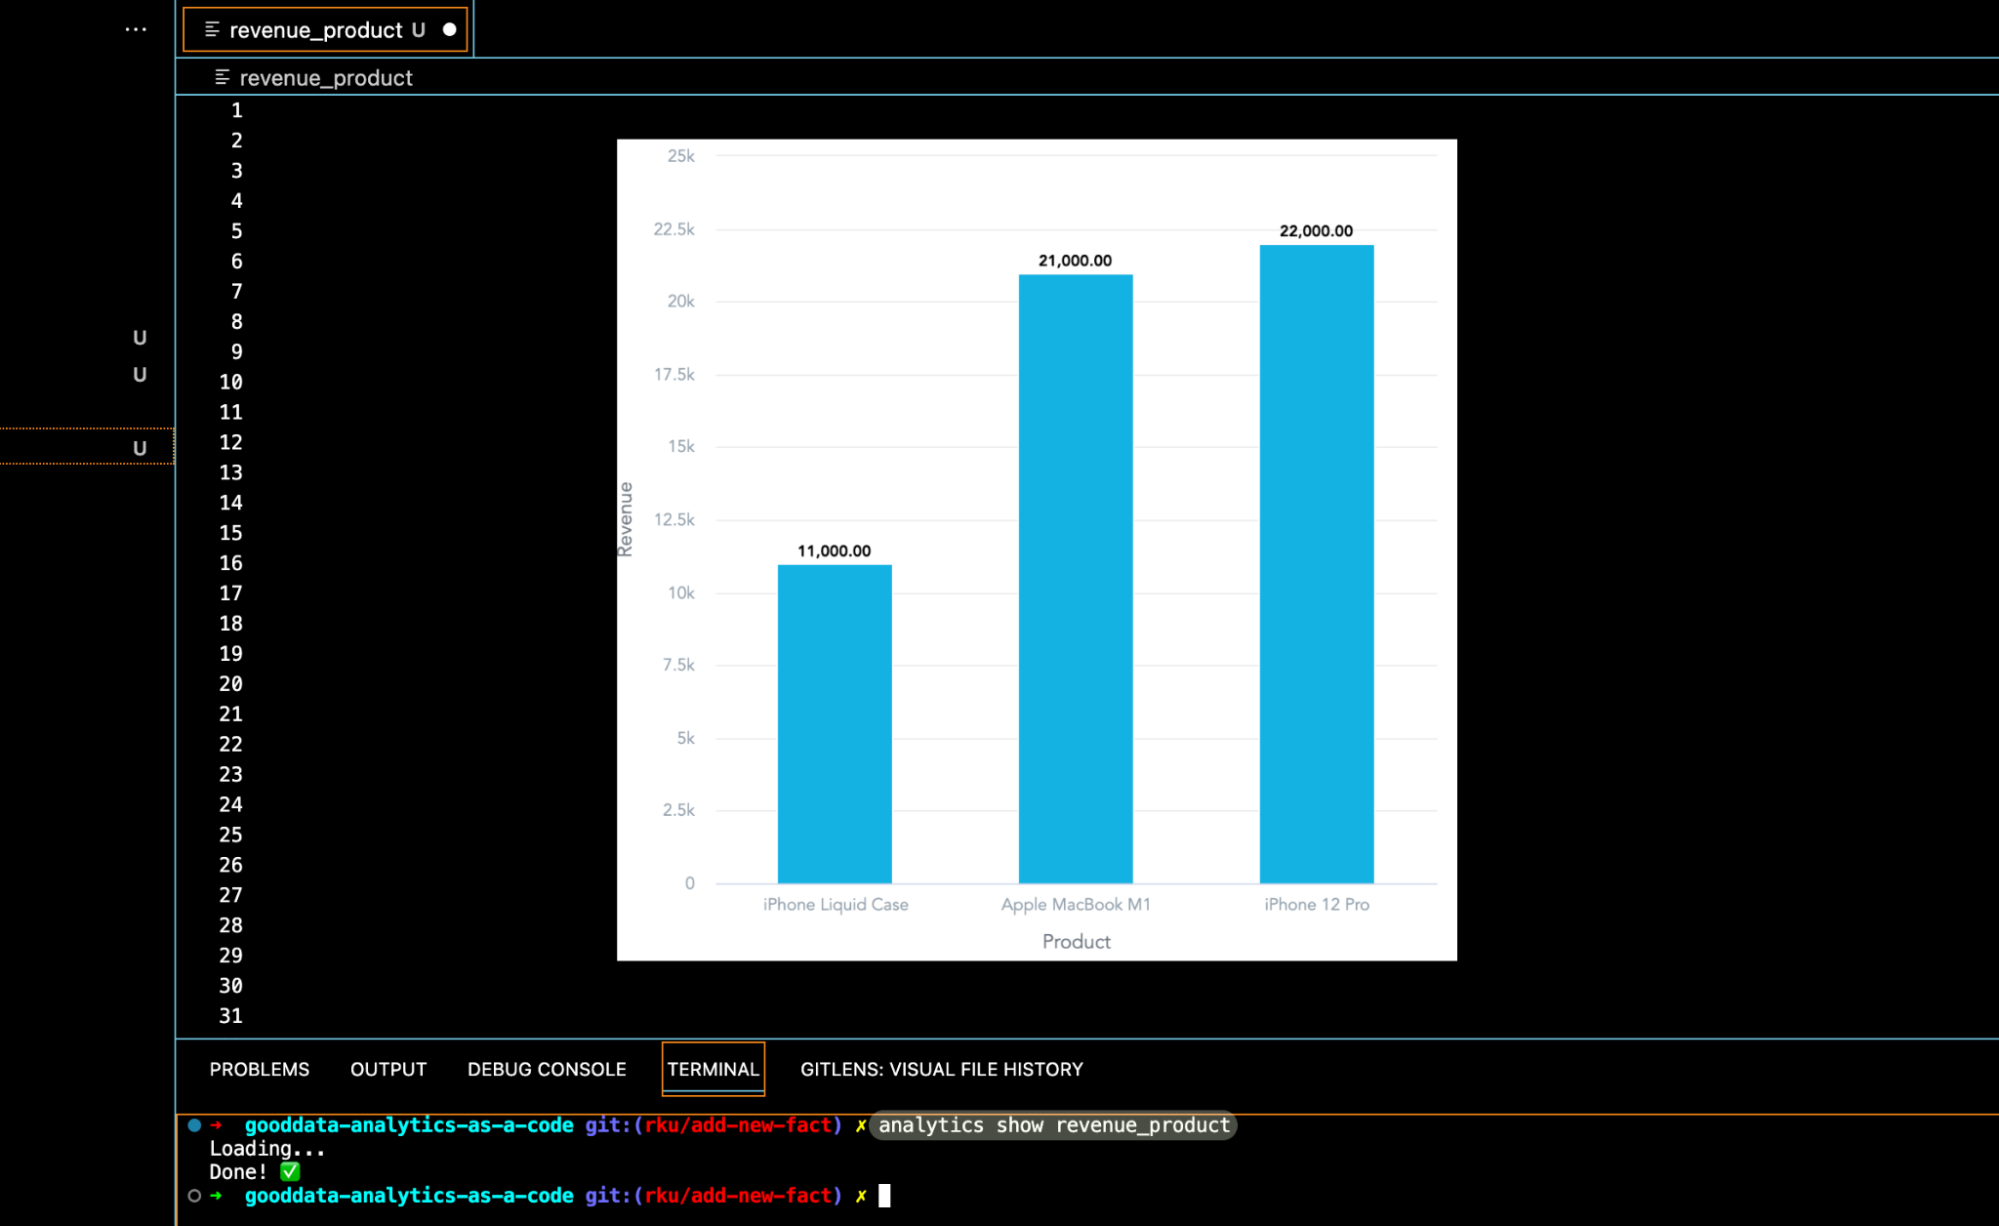
Last thing — print data in the console is good but the ideal approach is to see visualizations in your IDE. Again, with one command, it is possible:
Testing
The ability to test everything after you have made some changes is crucial. You want to be 100% sure that your changes will not break production analytics.
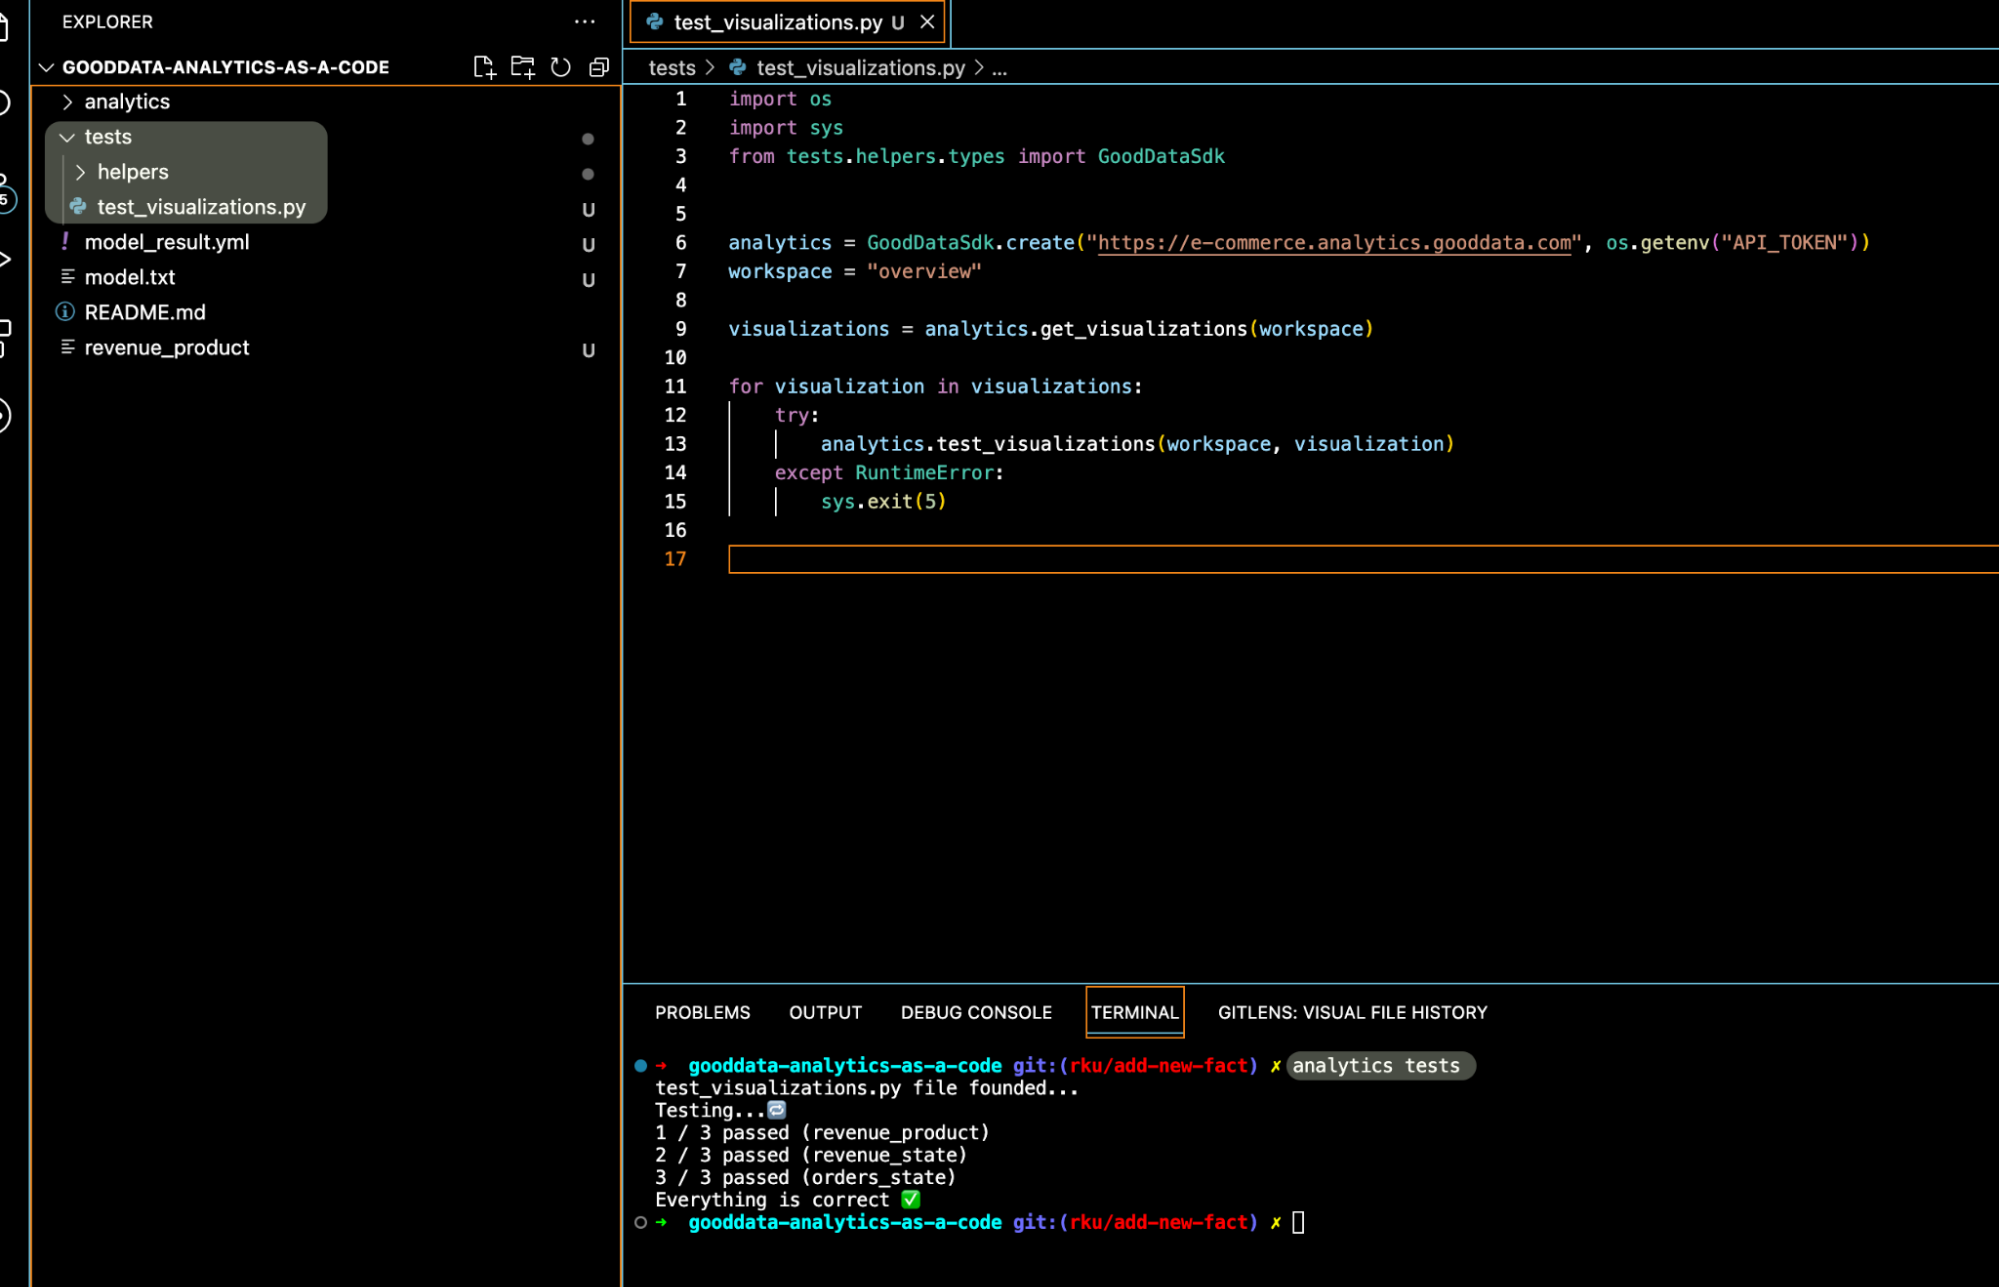
On top of that, you can run tests during delivering changes into production as a part of your CI/CD pipeline!
Do You Want to Stay in Touch?
If you like our approach, you can stay in touch with us and give us your contact — we will inform you about the progress of the plugin!
Thank you for reading! We have shown you the basic pillars of analytics as code approach — collaboration, change management, effectiveness, and testing.
If you are interested in GoodData.CN, please contact us. Alternatively, sign up for a trial version of GoodData Cloud: https://www.gooddata.com/trial/


