Nucleus Research: ROI Case Study on Firehouse Subs
Firehouse Subs, a restaurant brand with individually owned franchises, deployed GoodData to manage analytics dashboards for reporting and scorecarding across the whole company.
Firehouse Subs needed better data management and an easier way for franchises to track their performance. With GoodData’s dashboards, the company saw increased employee productivity and improvements in franchise revenues and scorecard metrics
Nucleus Research analysts
Anne Moxie, Joe Mathias
ROI
683%
Payback
0.2 years
Average annual benefit
$1,423,312
The Company
Firehouse Subs is a fast-casual restaurant chain with a passion for hearty and flavorful food, heartfelt service, and public safety. Founded by brothers and former firefighters Chris Sorensen and Robin Sorensen, Firehouse Subs is a brand built on decades of fire and police service and its commitment to saving lives through the establishment of the non-profit Firehouse Subs Public Safety Foundation.
In 2015, Firehouse Subs expanded its brand presence to the international market, debuting in Ontario, Canada and further expanding in 2017 to Mexico City, Mexico. Also in 2015, the brand introduced its first digital loyalty rewards program, Firehouse Rewards, which allows guests to earn and redeem points for each visit through a smartphone app. Firehouse Subs is consistently recognized as a leader in the fast casual segment. For the last three years, Firehouse Subs was ranked number one by Technomic’s Chain Restaurant Consumers’ Choice Awards among fast casual brands in the categories of overall brand (2017), food quality (2016), service (2015) and atmosphere (2014). Forbes recognized Firehouse Subs in 2015 as a Best Franchise to Buy.
The Challenge
The company originally had a disorganized data management structure with multiple disparate data streams entering different applications. It also lacked adequate analytics tools on the back end of the data pipeline to make sense of the information. The company wanted a way for individual franchises to measure their historical key performance indicators (KPI’s) while being able to compare their results with other Firehouse Subs restaurants.
To compensate, the reporting and analytics team had to spend time manually preparing the data and running ad-hoc reports. These inefficiencies led to missed business opportunities. With hundreds of users, individual report generation was impractical. The company wanted to avoid outsourcing business-wide report processes such as benchmarking KPI’s and scorecard results for each restaurant.
The Strategy
Firehouse Subs started evaluating options in 2013. In addition to considering GoodData, the team also evaluated other BI vendors and a custom data warehouse model. After nine months of evaluation, the company chose GoodData because of a fast time to value and their recommendation of Keboola as an efficient third party deployment team.
Implementation began in January 2014, and took six months. Firehouse Subs required only a small deployment team of two reporting and analytics team members. The finished product was a single application that provided access to KPI and benchmarking functions. The company combined the GoodData business intelligence (BI) tool with Keboola Connection as a data warehousing platform.
Training was a multi-step process. A group of staff members were initially trained as GoodData experts. They then trained other employees on how to use the new tools. Training video refreshers and webinars were also produced to assist in training staff.
Key Benefit Areas
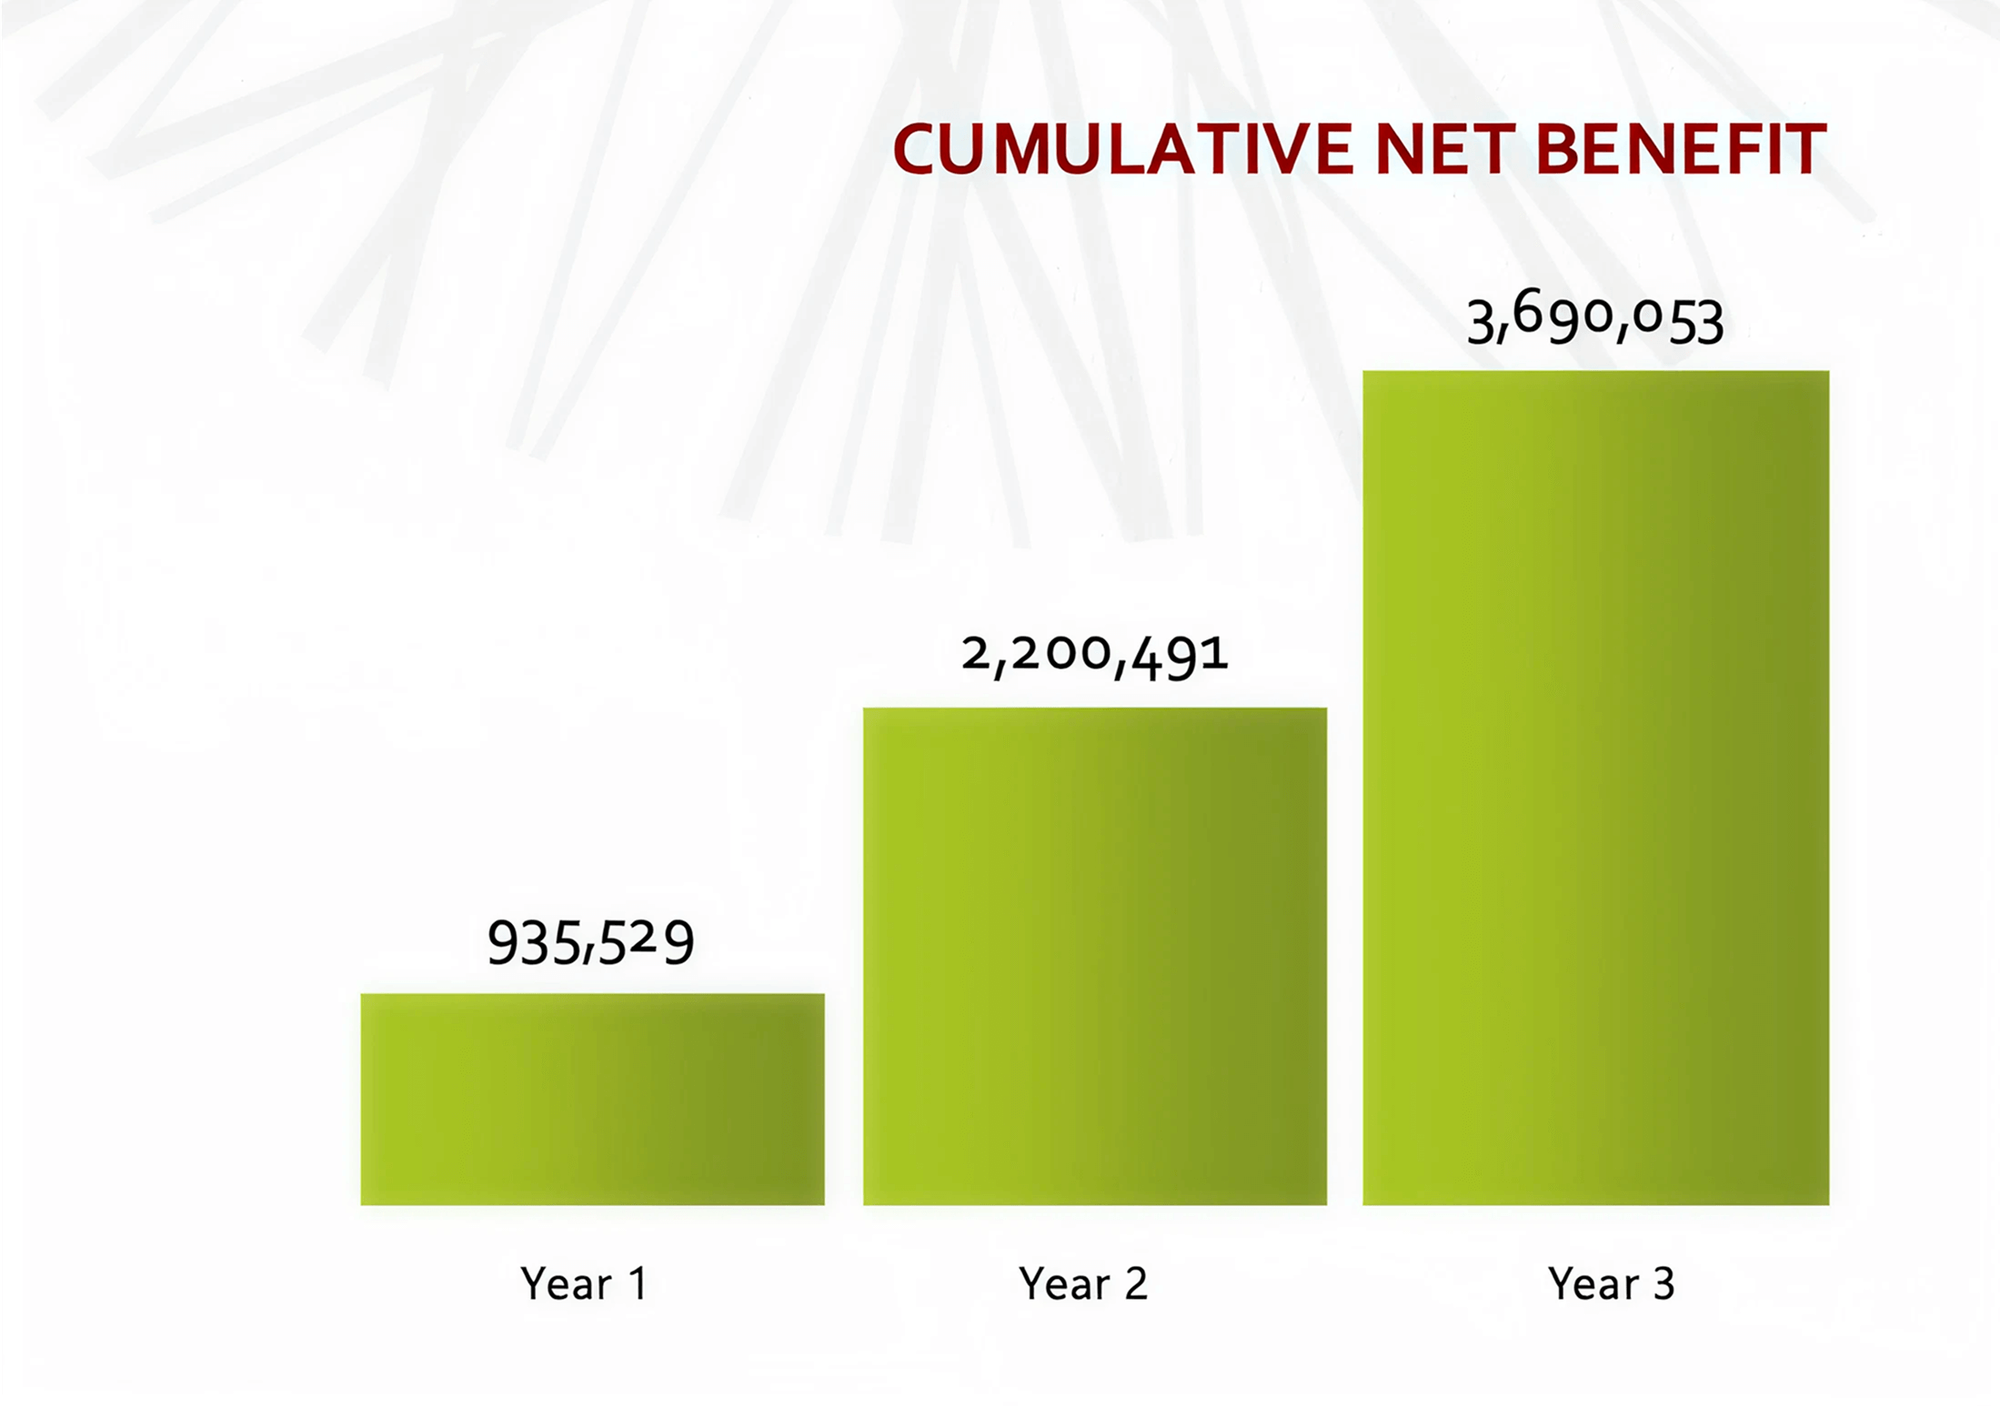
The deployment had two forms of benefits: those resulting from more efficient reporting processes, and those derived from the analytics insights resulting in greater revenue. The company leveraged a greater understanding of their data as they expanded over the period after deployment, deriving a high return on their investment from this growth.
- Faster ad-hoc reporting. With access to GoodData dashboards, employees no longer need to rely on reporting and analytics staff to generate reports, saving the team eight full days per month.
- Less data preparation. With the company’s data stream automatically input into the GoodData dashboards, the reporting and analytics team no longer needed to spend time cleaning and preparing the data for analysis. Along with faster reporting, this boost in productivity has allowed the team to devote time to other projects.
- Increased scorecard grades. Scorecarding is a common way for leaders and managers to track company progress. Because of the increased access to and ease of generating scorecards, the company saw increases in many of its performance metrics. An overall greater understanding of where to improve allowed managers to better focus their efforts.
- Better data management. The GoodData dashboards automatically codify data from customer service, restaurant performance, historical weather conditions, and operations, creating a central repository that is more organized and accessible.
- Increased revenues. The biggest benefit by far was the greater catering revenues that resulted from insight into the company’s data. The GoodData project was responsible for major business growth, with large upticks in sales for many restaurants per year since the deployment.
Key Cost Areas
Costs of the project included software subscription, initial consulting and development, personnel time to implement the application, as well as employee training. Ongoing costs include internal support and external upgrade and development support.
Best Practices
Where there are manual processes, there are inefficiencies that can be eliminated to free up personnel resources. In the case of Firehouse Subs, it was using its data and analytics team to manually prepare incoming data and generate ad-hoc reports. From both data management and analytics perspectives, the GoodData dashboards reduced internal efforts, freed up employee time, and increased data quality.
Self-service reporting is quickly becoming the way for businesses to create insight into their data from a “bottom up” approach. Managers are trained in how to use the analytics dashboards for their individual reporting purposing, eliminating reliance on a reporting team. For a company like Firehouse Subs, which has hundreds of franchises using the reports, individual manager autonomy led not only to faster reports, but improved scorecard results.
Calculating the ROI
Nucleus quantified the initial and ongoing costs of software subscription fees, personnel time to implement the application, employee training time, and consulting over a 3-year period to calculate Firehouse Subs’ total investment in GoodData.
The benefits quantified included increased profits, as well as employee and management productivity driven by the deployment, calculated based on the average annual fully loaded cost of the employees. These productivity savings calculations are modified with a correction factor to account for the inefficient transfer between time saved and increased productivity. Additional indirect benefits not quantified included increased scorecard metrics.
Financial Analysis: Firehouse Subs
Annual ROI: 683%
Payback period: 0.2 years
| BENEFITS | Pre-start | Year 1 | Year 2 | Year 3 |
|---|---|---|---|---|
| Direct | 0 | 0 | 0 | 0 |
| Indirect | 0 | 1,283,312 | 1,423,312 | 1,563,312 |
| Total per period | 0 | 1,283,312 | 1,423,312 | 1,563,312 |
| COSTS - CAPITALIZED ASSETS | Pre-start | Year 1 | Year 2 | Year 3 |
|---|---|---|---|---|
| Software | 0 | 0 | 0 | 0 |
| Hardware | 0 | 0 | 0 | 0 |
| Project consulting and personnel | 0 | 0 | 0 | 0 |
| Total per period | 0 | 0 | 0 | 0 |
| COSTS - DEPRECIATION SCHEDULE | Pre-start | Year 1 | Year 2 | Year 3 |
|---|---|---|---|---|
| Software | 0 | 0 | 0 | 0 |
| Hardware | 0 | 0 | 0 | 0 |
| Project consulting and personnel | 0 | 0 | 0 | 0 |
| Total per period | 0 | 0 | 0 | 0 |
| COSTS - EXPENSED | Pre-start | Year 1 | Year 2 | Year 3 |
|---|---|---|---|---|
| Software | 84,600 | 84,600 | 84,600 | 0 |
| Hardware | 0 | 0 | 0 | 0 |
| Consulting | 47,040 | 60,000 | 60,000 | 60,000 |
| Personnel | 51,563 | 13,750 | 13,750 | 13,750 |
| Training | 6,231 | 0 | 0 | 0 |
| Other | 0 | 0 | 0 | 0 |
| Total per period | 189,433 | 158,350 | 158,350 | 73,750 |
| FINANCIAL ANALYSIS | Results | Year 1 | Year 2 | Year 3 |
|---|---|---|---|---|
| All government taxes | 4.5% | |||
| Cost of capital | 7.0% | |||
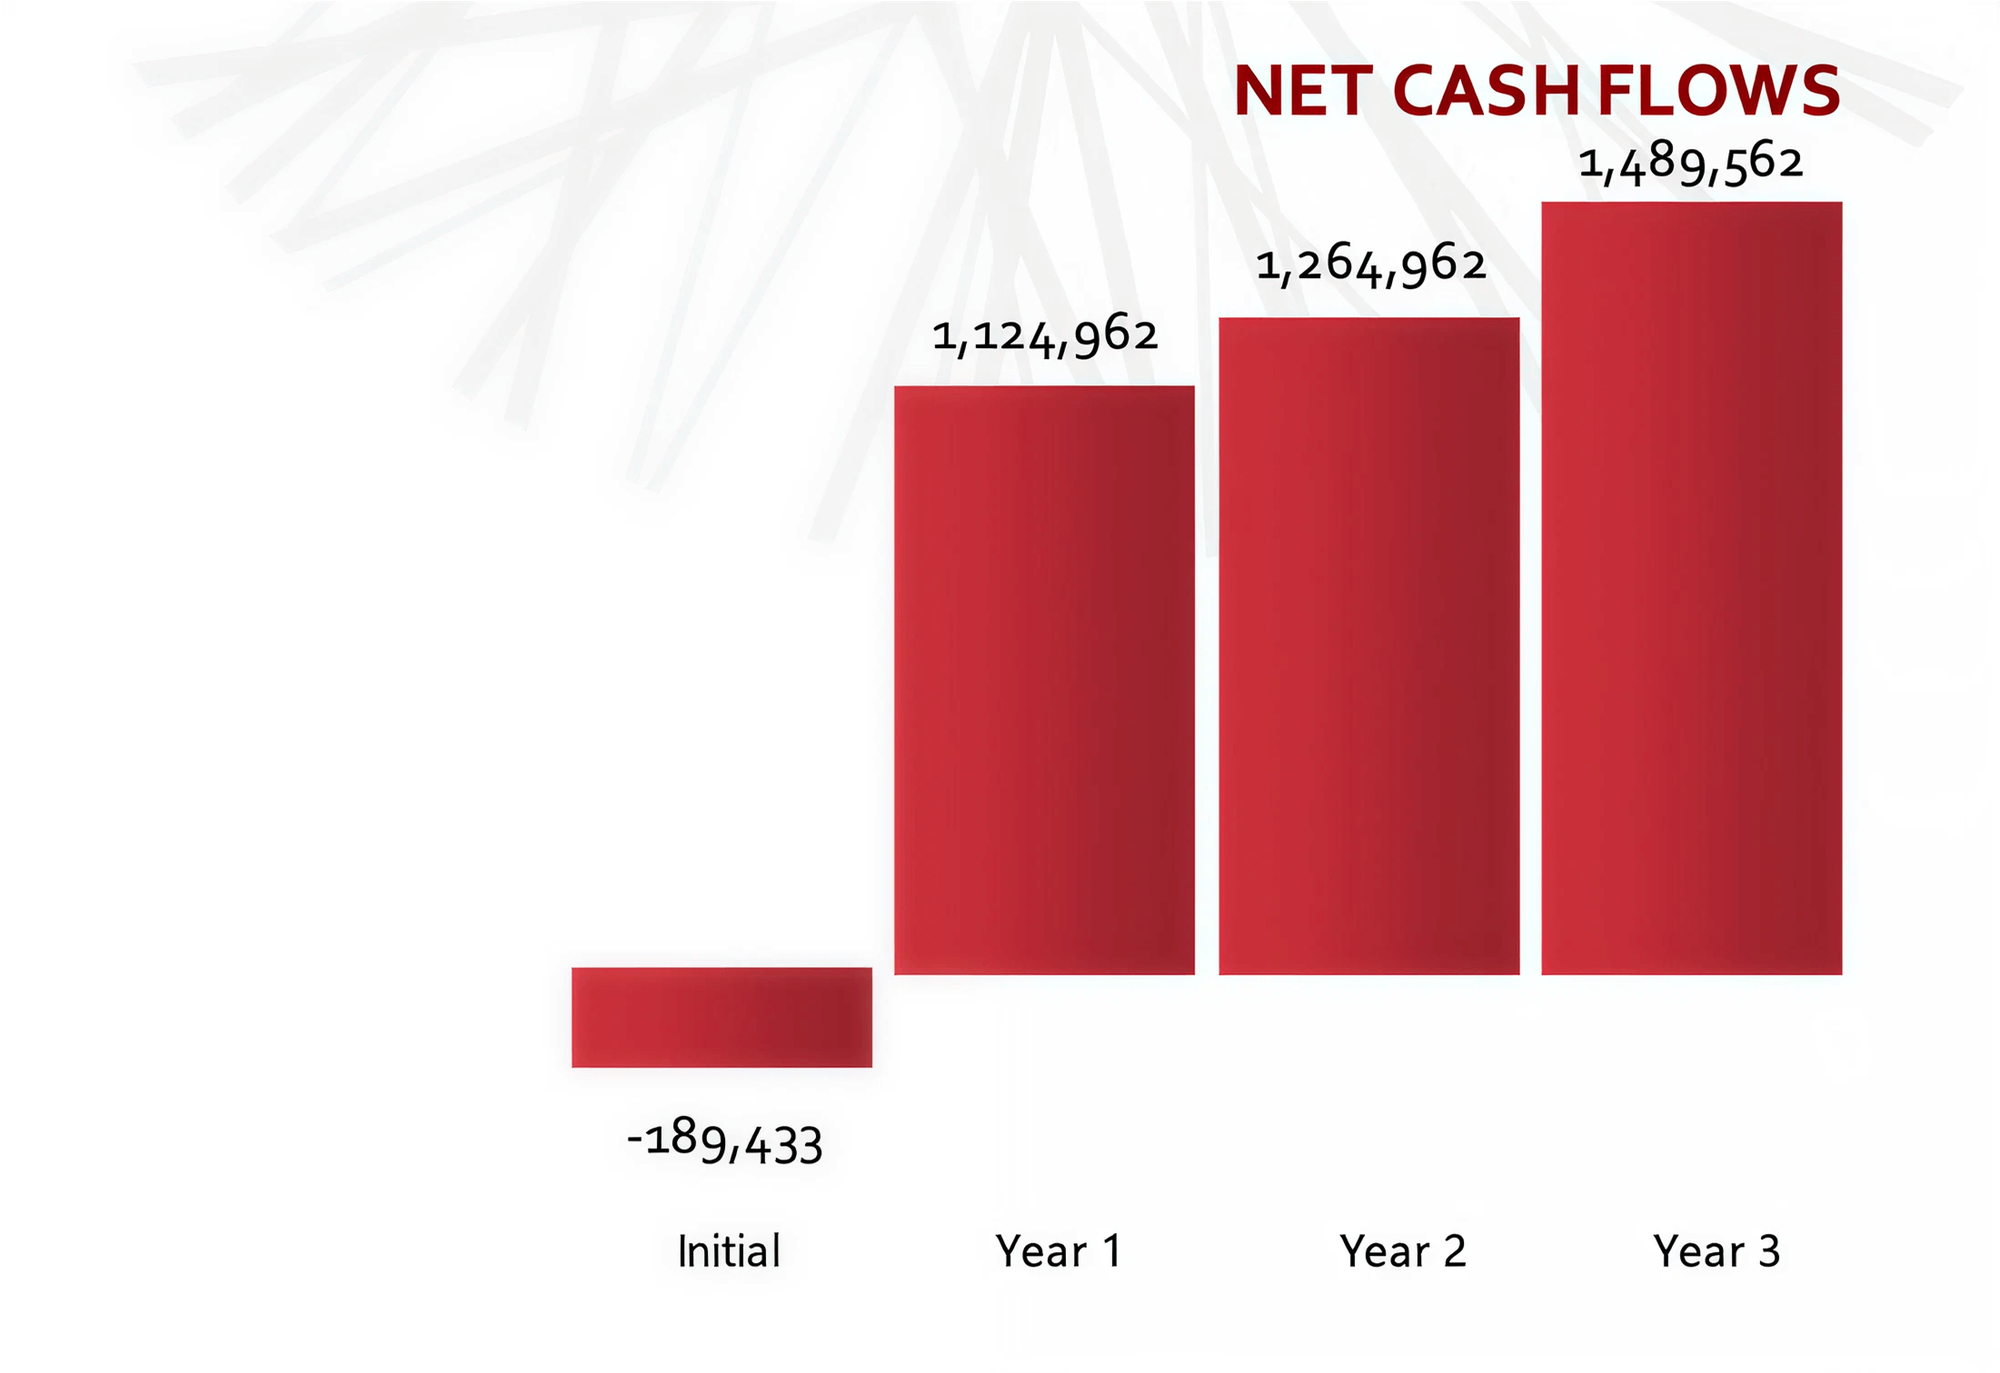
| Net cash flow before taxes | (189,433) | 1,124,962 | 1,264,962 | 1,489,562 |
| Net cash flow after taxes | (104,188) | 618,729 | 695,729 | 819,259 |
| Annual ROI - direct and indirect benefits | 683% | |||
| Annual ROI - direct benefits only | -69% | |||
| Net Present Value (NPV) | 1,750,499 | |||
| Payback period | 0.2 years | |||
| Average Annual Cost of Ownership | 193,294 | |||
| 3-Year IRR | 604% | |||
All calculations are based on Nucleus Research’s independent analysis of the expected costs and benefits associated with the solution.
Does GoodData look like the better fit?
Get a demo now and see for yourself. It’s commitment-free.
Trusted by