Whitepapers
GoodData Architecture Overview
12 min read | Published
The end-to-end analytics and data product platform
Analytics environments are often fragmented, difficult to scale, and costly to operate. Legacy business intelligence platforms are not designed for real-time data access, embedded use cases, or delivery of analytics as data products.
Architectures based on compute-intensive models frequently result in inefficiencies and unpredictable costs. The increasing complexity of integrating artificial intelligence further compounds these issues.
GoodData is a composable analytics platform designed to address these challenges. It enables consistent, scalable delivery of insights across users and applications while maintaining architectural flexibility and cost efficiency.
This document provides an overview of the GoodData platform, its core components, and the architectural principles that support modern data and analytics workflows.
What Is GoodData?
GoodData is a composable, AI-native analytics platform designed to help companies create, operate, and scale modern data products. It unifies business intelligence, artificial intelligence, and analytics infrastructure into a single, modular system that’s flexible for developers and fast for users.
Built on open technologies — including Apache Arrow, DuckDB, Iceberg, and FlightRPC — GoodData delivers high-performance, cost-efficient analytics at scale. It enables enterprises and SaaS providers to embed analytics into their products, power internal decision-making, and future-proof their data strategy with ease.
Whether you’re delivering dashboards to thousands of customers or powering operational decisions with AI-driven insights, GoodData offers the architecture to move from disconnected reports to unified, intelligent data experiences.
A Modular Platform Built for Composability
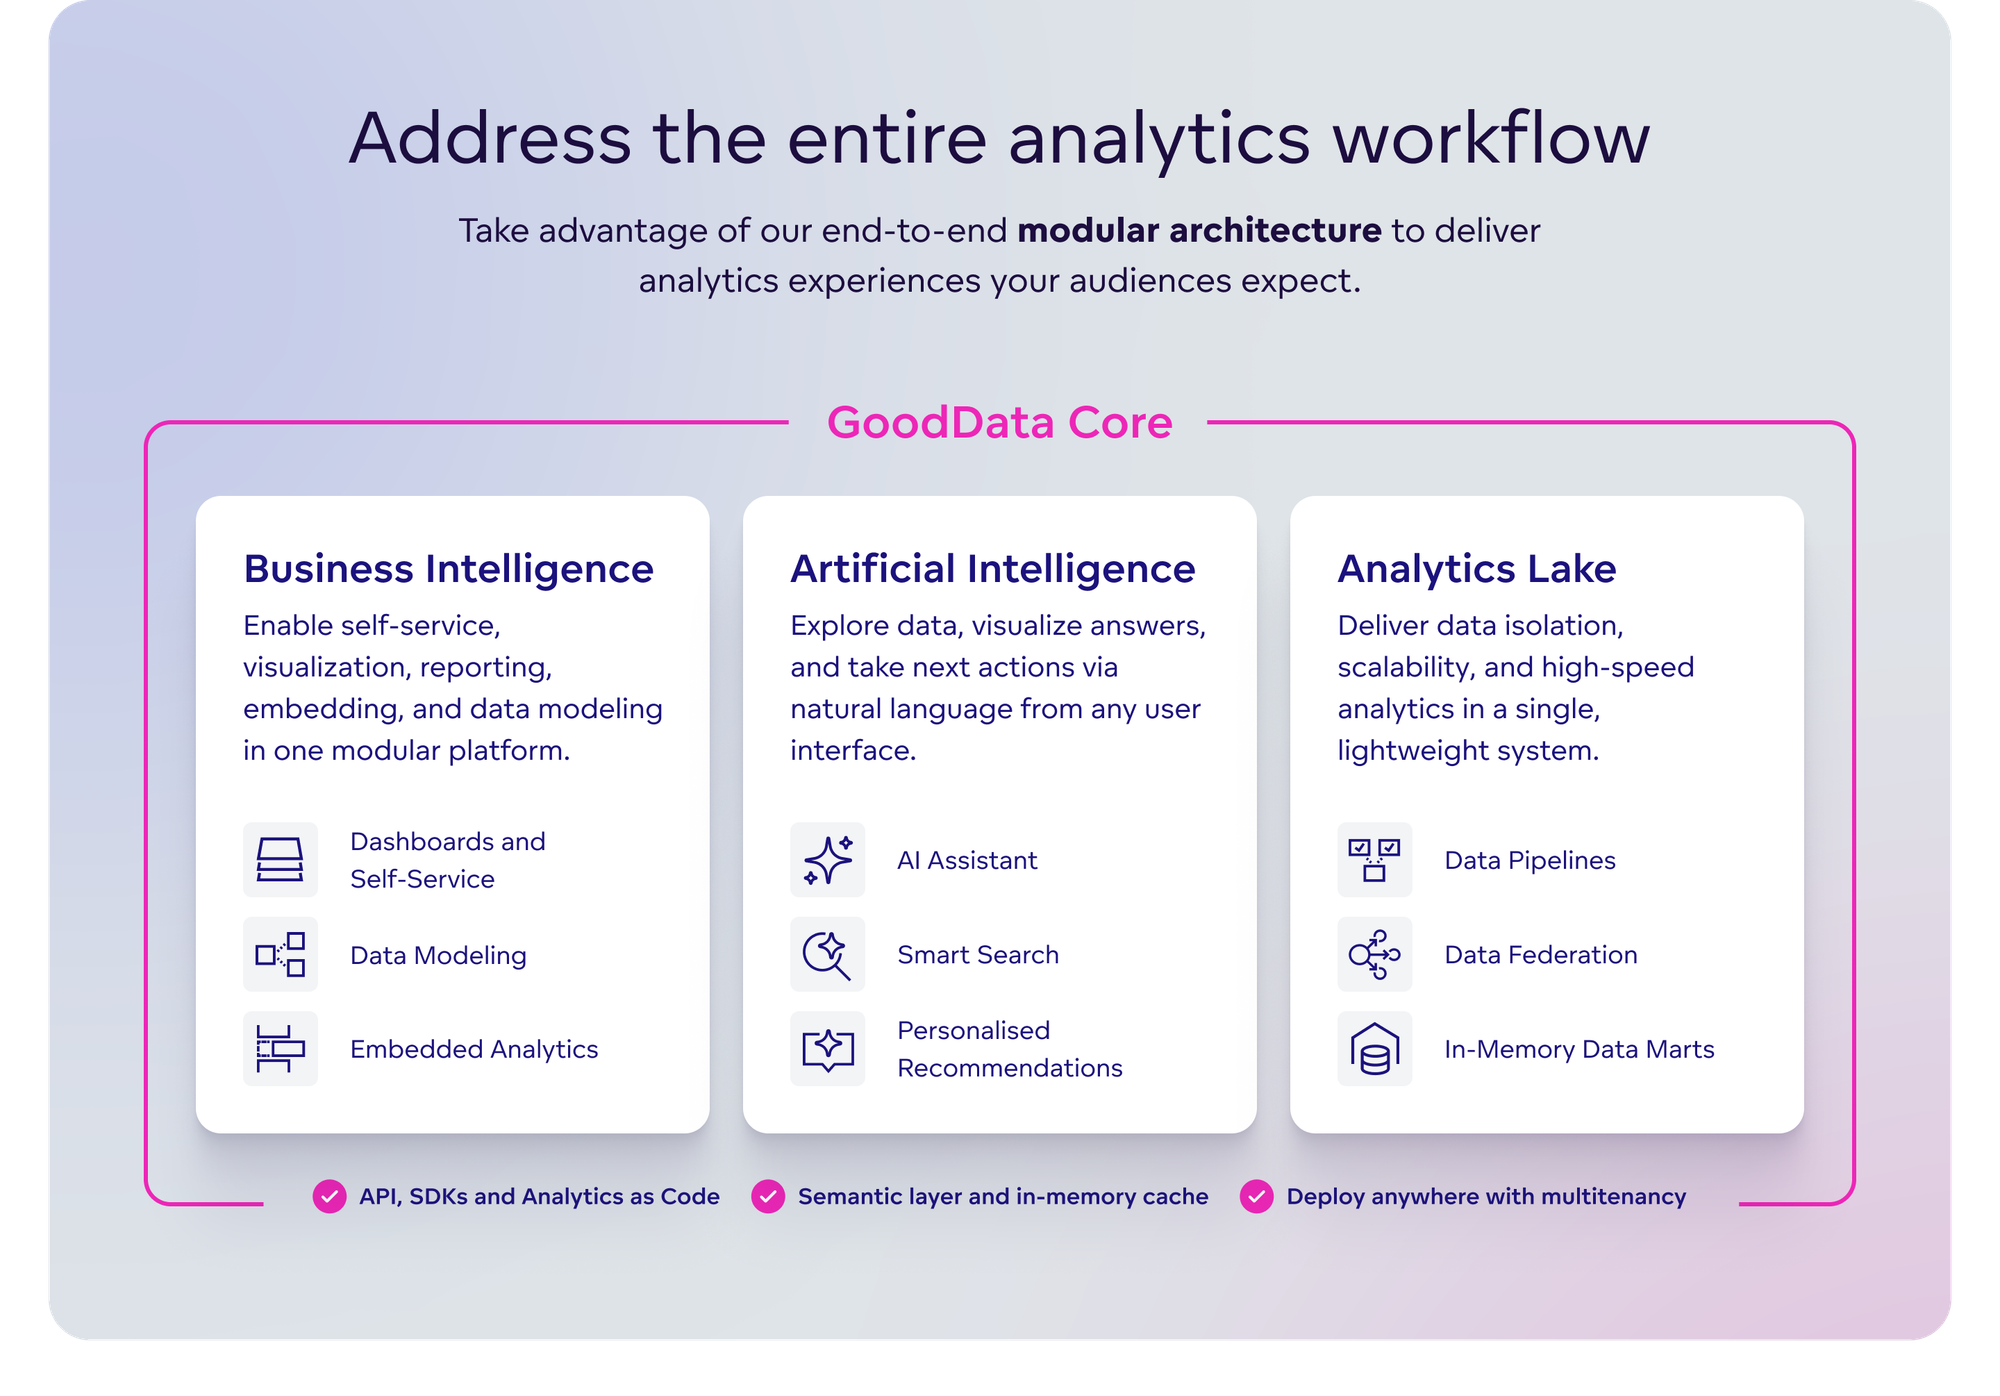
To support the diverse needs of today’s data teams, the GoodData platform is composed of three tightly integrated modules. These can be deployed independently or together — depending on your data maturity, goals, and architecture.
The Platform’s Three Core Modules
- GoodData BI — Multi-tenant, self-service analytics with reusable semantic models, embedded dashboards, and analytics-as-code flexibility.
- GoodData AI — A virtual analyst powered by large language models (LLMs) and machine learning. It offers conversational insights, anomaly detection, and automated data storytelling.
- GoodData Analytics Lake (AL) — A high-performance compute and storage layer combining hot (DuckDB) and cold (Iceberg) storage for scalable, cost-effective query execution.
Together, these modules form a composable analytics stack with a shared control plane and common identity, access, and governance model.
Composable by design: You can start with BI, integrate AI when needed, and rely on AL to support performance and scale modularity without rearchitecting.
Why a New Approach Is Needed
Let’s be clear: this is not just another BI tool or AI bolt-on. GoodData exists because today’s analytics landscape is fractured, expensive, and often counterproductive.
Here are the challenges we’re solving
- Legacy BI is too rigid for modern product teams. It wasn’t designed for composability, multitenancy, or continuous delivery.
- Traditional stacks prioritize compute over outcomes. Many architectures lock customers into high-cost query patterns and limited flexibility.
- AI and BI often operate in silos. This fragmentation causes friction, inconsistent insights, and poor user adoption.
What the Platform Delivers
GoodData delivers value across the entire analytics lifecycle — from data modeling to insight delivery to AI-driven automation.
Business Value Drivers
- Faster Time-to-Insight — AI-powered insights and reusable BI models reduce manual reporting and enable real-time decisions.
- Multi-Tenant Scalability — Architected for SaaS and enterprises with tenant automation and fine-grained governance.
- Developer-Centric Customization — SDKs, APIs, and declarative configs give full control to data and engineering teams.
- Cost Optimization — Smart caching, hybrid storage, and workload-aware compute reduce query costs.
- Composable, Future-Proof Design — Extend the platform with new AI models, data sources, and UIs — no replatforming needed.
Why it matters: Instead of spending time stitching tools together or managing compute costs, your teams can focus on delivering outcomes.
GoodData supports a wide variety of modern analytics needs. Below are the most common use cases and how different teams benefit
Seamlessly integrate dashboards and insights into SaaS products or internal tools. Ideal for product teams delivering analytics in the user workflow.
GoodData supports a wide variety of modern analytics needs. Below are the most common use cases and how different teams benefit
Define analytics objects (models, dashboards, configs) in code for CI/CD, automation, and full version control. Perfect for developers and data engineers.
GoodData supports a wide variety of modern analytics needs. Below are the most common use cases and how different teams benefit
Great for data product managers and commercial teams who want to monetize analytics at scale.
GoodData supports a wide variety of modern analytics needs. Below are the most common use cases and how different teams benefit
Create interactive, intuitive dashboards that communicate key metrics clearly. Useful for analysts, business users, and executive stakeholders.
GoodData supports a wide variety of modern analytics needs. Below are the most common use cases and how different teams benefit
Leverage backend analytics capabilities via APIs and SDKs without prescribing a UI. Enables full customization for developers and integrators.
Who Is It For?
GoodData is built for teams at every stage of the analytics journey — from no-code business users to full-code data engineers. Our platform supports three primary personas:
- Consumers (No Code): Business users who explore curated dashboards, ask questions via natural language, and receive AI-assisted insights — without writing code.
- Data Analysts (Low Code): Power users and analysts who build dashboards, tweak semantic models, and accelerate reporting with explainable AI and low-code tools.
- Analytics Engineers (All Code): Developers and engineers who want full control through APIs, SDKs, and declarative configurations. Ideal for embedding, automating, and scaling analytics as code.
Whether you're exploring data, building dashboards, or designing full-stack analytics solutions — GoodData meets you where you are.
Core Platform Capabilities
Let’s break down the features that power GoodData’s end-to-end value.
Data Modeling & Consistency
- Composable Semantic Layer — Model once, reuse everywhere with tenant-specific overrides.
- Multi-Tenant Architecture — Automate provisioning and enforce data access rules across organizations, customers, or business units.
Insight Delivery & User Experience
- Composable Front-End & SDKs — Modular dashboard components and full API coverage for embedded, branded UIs.
- AI-Integrated Analytics — Natural language queries, anomaly detection, and AI-driven data storytelling.
Performance, Storage & Automation
- Federated Query & Hybrid Storage — DuckDB for interactive hot data, Iceberg for cold storage at scale.
- Automation & CI/CD — YAML/JSON config-driven deployments with full-stack API control.
- Security & Governance — Role-based access, lineage tracking, audit logs, and compliance-ready design.
What Makes GoodData Different
In a market full of analytics tools, GoodData stands out with a platform that’s:
- Best-in-Class for Multitenancy — Serve hundreds of tenants with full-stack automation.
- AI-Native by Default — Built to go beyond dashboards with LLM-powered analytics.
- Composable at Every Layer — APIs, SDKs, and UI components work together or standalone.
- Optimized for Cost and Performance — Caching, storage tiering, and intelligent workload management.
- Made for Developers — Declarative configs, automation hooks, and open integration.
- Future-Proof — Ready for the next wave of AI, real-time data, and hybrid architectures.
Terminology Made Simple
Get up to speed on concepts like the semantic layer, multitenancy, and FlightRPC with our glossary at the end of this whitepaper.
GoodData BI: Composable Intelligence for Every Use Case
The first core module of the GoodData platform is its BI engine — designed not as a traditional dashboarding tool, but as a modern, composable layer for delivering insights at scale.
GoodData BI provides a unified, reusable semantic layer that supports multi-tenant use cases, modular front-end customization, and automation-ready deployment. It's designed for developers, but accessible to business users — offering a powerful blend of consistency, flexibility, and performance.
What Is GoodData BI?
GoodData BI is a self-service analytics platform built for composability. It gives organizations the power to build reusable data models, scale across tenants and teams, and deliver white-labeled insights wherever they’re needed.
Unlike traditional BI tools, GoodData BI integrates tightly with modern data stacks, supports dynamic multitenancy, and enables full automation through APIs and declarative configurations. Whether you’re building internal dashboards or delivering analytics-as-a-service to customers, GoodData BI adapts to the shape of your business.
Designed for developers, loved by builders: GoodData BI unites low-code analytics creation with high-code extensibility.
What It Delivers
- Consistent, Trusted Insights — With a centralized semantic layer, metrics and business logic are defined once and reused across dashboards and tenants.
- Scalable Multi-Tenant Architecture — Easily onboard new customers or departments with configurable inheritance and access control.
- Composable Front-End — Use modular UI components or fully customize via React SDK and APIs.
- Faster Time-to-Value — Reuse models, embed dashboards, and automate deployments to reduce setup time and maintenance.
- Cost and Performance Efficiency — Shared infrastructure with isolated compute, plus intelligent caching to reduce query load.
Who It’s For
- Analytics Builders — Use visual tools to craft dashboards and workflows for non-technical users.
- Business Consumers — Get curated, reliable dashboards embedded where they work.
- Frontend Developers — Use SDKs and APIs to integrate analytics into custom applications.
Whether you're building for internal teams or external customers, GoodData BI enables you to deliver tailored, scalable, and trustworthy analytics with minimal overheads.
From BI to AI: Augmenting Dashboards with Intelligence
While BI brings structure and self-service, modern organizations are increasingly seeking proactive, conversational, and automated insights. Enter GoodData AI — the platform’s intelligent layer that transforms dashboards into dialogue, metrics into meaning, and users into empowered decision-makers.
Let’s explore how GoodData AI unlocks the next level of data experience.
GoodData AI: Intelligence at the Point of Decision
As expectations rise for faster, smarter decisions, analytics must move beyond dashboards. GoodData AI brings natural language, and automated insight generation to your analytics stack — bridging the gap between raw data and real-world decisions.
Designed as a modular, embeddable layer, GoodData AI gives teams the power to ask questions in natural language, uncover hidden patterns, and receive contextual recommendations — without switching tools or writing code.
What Is GoodData AI?
GoodData AI is an intelligent analytics layer that uses large language models (LLMs), small language models (SLMs), and traditional machine learning (ML) to deliver insight at speed and scale. It orchestrates the right model for the right task, balancing performance, accuracy, and cost.
From search-based exploration to conversational insights, GoodData AI turns passive data into an active asset.
Analytics without friction: From metric to meaning in seconds, using language anyone can understand.
What It Delivers
- Natural Language Insights — Ask questions conversationally and receive visual answers, explanations, or recommended actions.
- Search-Driven Exploration — Surface relevant metrics, reports, or dashboards using smart search across your analytics catalog.
- Root Cause & Anomaly Detection (Roadmap 2025) — Automatically detect and explain outliers, variances, and trends.
- Narrative Storytelling (Roadmap 2025) — Automatically generate summaries and insights in plain language alongside visual dashboards.
Who It’s For
- Executives & Business Users — Ask and explore without needing technical skills.
- Data Teams — Extend existing models and analytics with AI without duplicating effort.
- Product Owners & SaaS Providers — Embed smart, value-added insights directly into customer-facing applications.
GoodData AI makes insight delivery proactive, not reactive — meeting users where decisions happen.
Key Capabilities
AI Engine & Orchestration
- Model-Aware Routing — Dynamically selects the optimal model for each task: large language models (LLMs) for complex reasoning, small language models (SLMs) for speed and efficiency, and traditional ML models for predictive analytics.
- Adaptive Prompting — Supports multiple LLMs by tailoring prompts to your business language, data context, and model-specific nuances to optimize response quality.
- Ontology-Driven Context — Enhances AI understanding by aligning responses with your business language and data model, using domain ontologies and semantic context.
User Interfaces & Interactions
- Chatbot Embeds — Natural language Q&A via standalone chat or within existing dashboards.
- Search Everywhere — Surface insights across dashboards, visualizations, metrics, attributes, or facts.
- Narrative Widgets (Roadmap 2025) — Auto-generate insights and summaries embedded in dashboards.
- Model Context Protocol — MCP (Roadmap 2025) — Enables secure, standardized connections between AI and external data sources, giving interfaces real-time access to business context for more accurate, relevant responses.
Developer Tools & Extensibility
- API-First Architecture — Embed AI into apps, workflows, or custom frontends.
- Automation Triggers — Schedule, push, and alert based on AI outcomes.
- Governance Ready — Track AI decisions, prompts, and audit logs.
What Makes It Different
- Dynamic AI Orchestration — Balances power, speed, and cost by selecting the right AI model per task.
- Embedded by Default — Bring insights into any experience, not just a dashboard.
- Modular and Extensible — Use out-of-the-box AI features or extend with custom logic and workflows.
- Accessible for All — Democratizes insight generation via natural language interfaces.
- Designed for the Real World — Scales across departments, teams, and use cases with performance and governance in mind.
GoodData Analytics Lake (AL): Powering Performance and Scale
Behind every great insight is a high-performing infrastructure. GoodData Analytics Lake (AL) is the compute and storage engine that underpins the entire GoodData platform. It ensures that analytics workloads — whether in BI dashboards or AI queries — run fast, scale efficiently, and deliver consistent performance across use cases.
What Is GoodData AL?
GoodData Analytics Lake is a modern data infrastructure layer optimized for analytics workloads. It blends cold storage using Apache Iceberg with hot, in-memory storage powered by DuckDB — allowing organizations to balance performance and cost based on workload types.
More than just a data lake, AL is a purpose-built analytics engine tailored for multitenancy, high concurrency, and cost-aware execution.
AL is deeply integrated with GoodData BI and AI, managing multitenancy, automating query acceleration, and caching data to reduce latency and infrastructure overheads.
Purpose-built for analytics: Unlike general-purpose data lakes or warehouses, AL is tuned for delivering insights at scale.
Why It Matters
- Performance — Pre-aggregates and caches the most frequently accessed data for instant responsiveness.
- Cost Optimization — Offloads expensive compute from external DWHs, and controls storage tiers based on data recency.
- Convenience — Acts as a fully-managed performance layer or a primary data store depending on your needs.
- Flexibility — Built on open standards, enabling integration with diverse tools and custom pipelines.
Who It’s For
- Enterprises managing hundreds of tenants or departments who need strong performance and isolation.
- SaaS providers looking for embedded analytics with predictable cost.
Core Capabilities
Build on Open Technologies
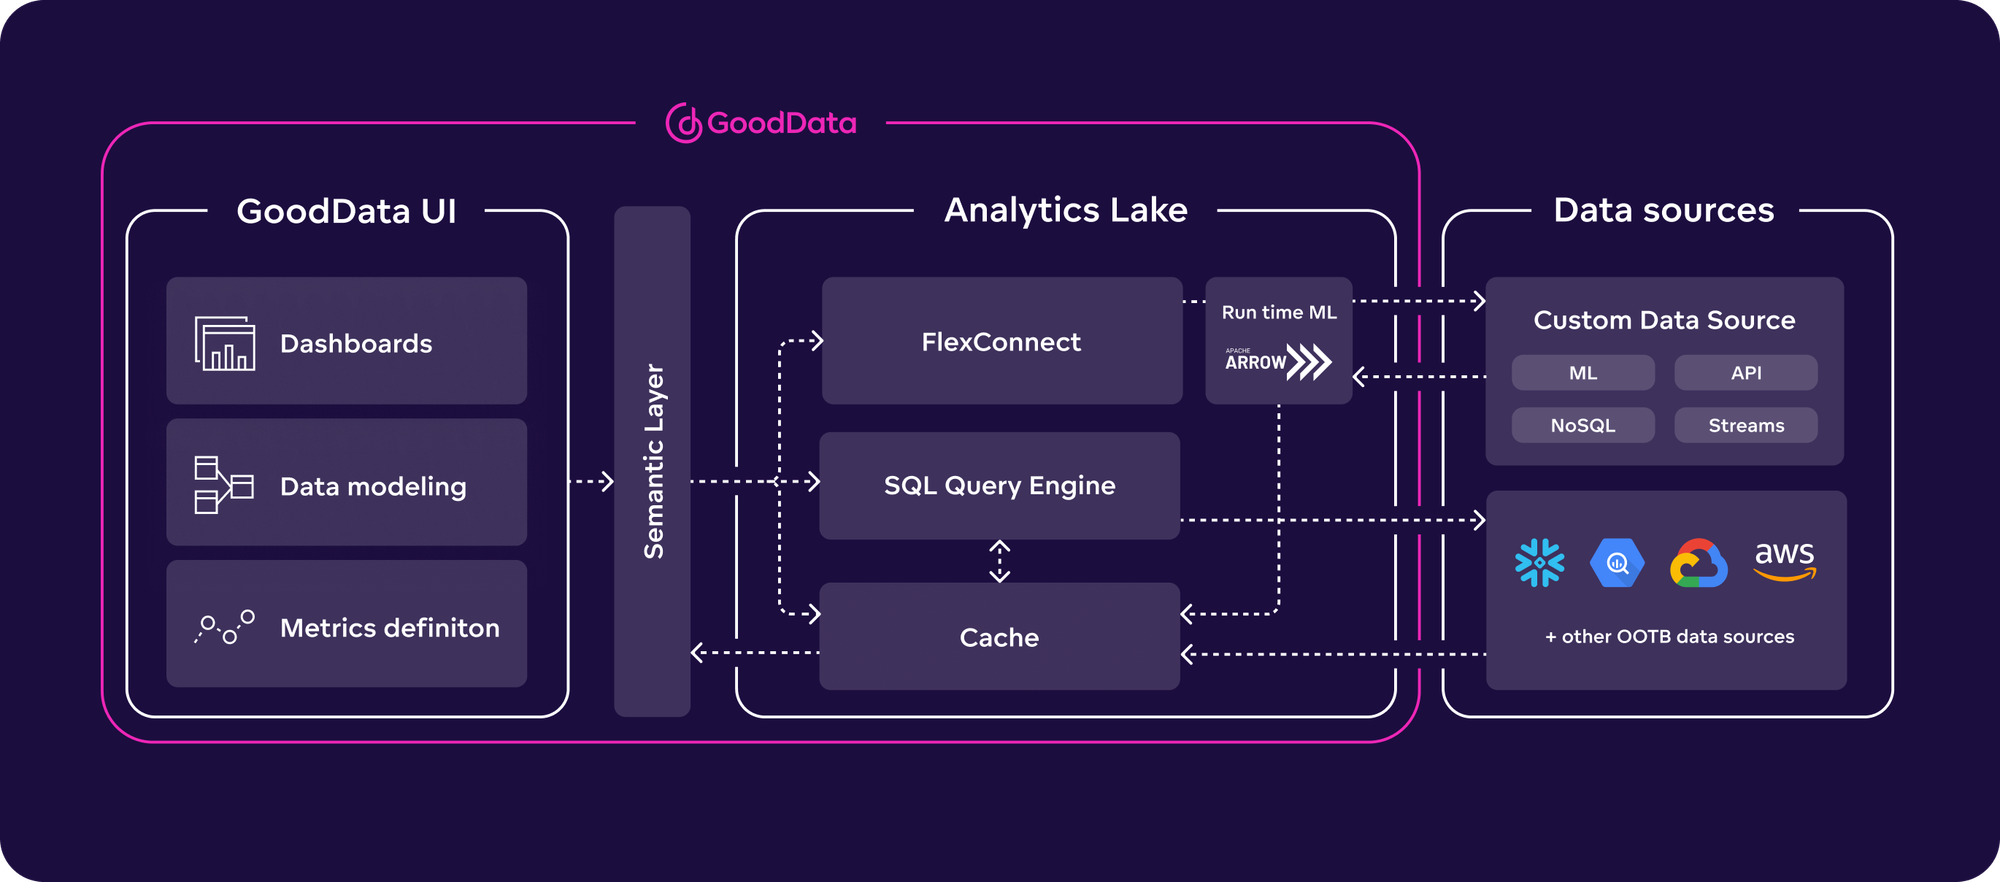
GoodData Analytics Lake is built on a modern, scalable architecture using industry-leading open technologies. It leverages open table formats like Apache Arrow and Apache Iceberg for efficient querying and optimized storage. A distributed SQL engine supports fast analytics execution, while the integrated semantic layer ensures consistent data modeling and governance across the platform. These technologies enable extensibility, openness, and seamless integration with modern data ecosystems.
In-Memory Caching and Computation
GoodData AL caching layer is an Arrow-based cache that stores query data for retrieval at runtime, saving the customer the time and cost of querying the underlying database.
FlexConnect
FlexConnect empowers engineers to construct their own data connectors, enabling them to link to any desired source system or API. It also allows the integration of custom computations such as benchmarking or live currency conversion directly within the connector itself. This feature proves particularly valuable for logic that necessitates dedicated compute resources or assured governance.
Data Blending
Data blending allows analytics engineers to combine data from multiple databases into a single dashboard, visualization, or metric without the need for complex ETL.
What Makes It Different
- Analytics-First Architecture — Purpose-built to serve BI and AI, not general-purpose storage.
- Cache-Aware Design — Maximizes performance through adaptive cache layers.
- Multi-Tenant Smartness — Provisioned, isolated, and performance-optimized per tenant.
- Elastic but Predictable — Performance at scale with controllable infrastructure spend.
- Built on Open Technologies — Iceberg, DuckDB, Arrow, FlightRPC — designed for extensibility.
Together, GoodData BI, AI, and AL deliver a fully composable, high-performance analytics platform — built for the speed, scale, and complexity of modern data products.
Together, GoodData BI, AI, and AL deliver a fully composable, high-performance analytics platform — built for the speed, scale, and complexity of modern data products.
Platform Architecture & Deployment Overview
GoodData’s architecture is built to be modular, scalable, and developer-friendly — offering a clean separation of concerns across data, logic, and experience layers. Whether you are embedding analytics in an SaaS product or powering data-driven decision-making in a global enterprise, the platform adapts to your infrastructure needs and delivery patterns.
Deployment Flexibility
GoodData is designed to deploy across multiple environments and align with your DevOps practices:
- Cloud-Native — Delivered as a service or via containerized deployment in your cloud.
- Declarative Configuration — YAML/JSON-driven deployments enable CI/CD pipelines and version control for analytics.
- API-First Infrastructure — Everything in GoodData is accessible via APIs for integration and automation.
- Multi-Environment Support — Easily manage dev, staging, and production environments with strict separation and promotion workflows.
Security & Governance Architecture
Security is embedded at every layer:
- RBAC (Role-Based Access Control) across all modules.
- Data Lineage and Audit Logging for compliance and traceability.
- Workspace Isolation and Tenant Scoping for multi-tenant deployments.
- Open Protocol Support (OAuth, OIDC, HTTPS, encrypted storage).
Future-ready by design: Whether you're scaling to thousands of customers or experimenting with new AI workloads, GoodData's architecture is built to grow with you.
Conclusion: Building the Future of Analytics
Most analytics platforms can’t keep up with modern product teams. GoodData redefines what’s possible with a composable, AI-native platform — built to deliver insights as a product, at speed and scale, and prepared for what’s next.
By combining reusable business logic, dynamic frontends, intelligent automation, and a purpose-built analytics lake, GoodData enables teams to deliver analytics as a true product. Whether you’re embedding insights in a SaaS platform or standardizing KPIs across a global enterprise, the platform adapts to your goals — not the other way around.
With its developer-first mindset, open architecture, and seamless AI integration, GoodData helps you move faster, reduce cost, and ensure you’re ready for what’s next.
Best-in-Class Multitenancy
Here’s how GoodData delivers differentiated value when fully deployed
Deeply embedded, flexible analytics experiences at scale and efficiency unmatched by competitors.
AI-Native Analytics
Here’s how GoodData delivers differentiated value when fully deployed
Virtual analysts, search-based insights, and automated data storytelling elevate analytics beyond traditional dashboards.
True Composability
Here’s how GoodData delivers differentiated value when fully deployed
Enables custom analytics stacks without vendor lock-in, from low-code to fully custom SDK-driven experiences.
Performance & Cost Optimization
Here’s how GoodData delivers differentiated value when fully deployed
Unique query acceleration and storage tiering minimize latency and cost, making high-scale analytics viable.
Built for Developers, Not Just Analysts
Here’s how GoodData delivers differentiated value when fully deployed
An API-first approach with open-source extensibility and automation hooks.
Future-Proof Modularity
Here’s how GoodData delivers differentiated value when fully deployed
Composable architecture makes it easy to integrate new AI models, process real-time data, and analyze insights directly at the source.
Glossary of Key Technical Terms
Analytics-as-Code: The practice of defining analytics objects (dashboards, models, configurations) in declarative formats like YAML or JSON, enabling version control and CI/CD.
Apache Arrow: An in-memory columnar data format used for efficient analytics and caching within GoodData AL.
Composable Analytics: A modular architecture approach where components like BI, AI, and compute can be deployed independently or together, based on specific use cases.
Data Lineage: The ability to trace the flow of data from source systems through transformations and into final visualizations or outputs. Critical for compliance, auditing, and debugging.
Declarative Configuration: Defining infrastructure, models, and UI components in code, which can then be deployed automatically across environments.
DuckDB: A high-performance, in-memory database engine used for real-time querying in the hot layer of GoodData AL.
FlexConnect: A feature in GoodData AL that allows developers to build custom data connectors, integrating external APIs or data pipelines with embedded logic directly into ingestion flows.
FlightRPC: A lightweight, high-speed protocol used to transport data efficiently between services and systems.
Iceberg (Apache Iceberg): An open table format optimized for large-scale analytical workloads and cost-effective cold storage in GoodData AL.
LLM (Large Language Model): AI models trained on vast datasets to understand and generate natural language (e.g., for AI chat and storytelling features).
Longbow: The codename for GoodData’s in-memory caching layer built on Apache Arrow. It accelerates query performance by caching frequently accessed data in a lightweight format.
Materialization: The process of persisting query results or intermediate computations to speed up performance and avoid reprocessing for repeated queries.
Multitenancy: The ability to isolate and manage analytics experiences, data models, and access across different customers, teams, or business units.
RBAC (Role-Based Access Control): A permission system that grants users access to specific resources based on their assigned roles.
Semantic Layer: A reusable modeling layer where metrics, dimensions, and business logic are defined once and reused consistently across reports and users.
SLM (Small Language Model): Lightweight language models used for simpler or faster AI tasks that don’t require the scale of LLMs.
Workspace: A tenant-level environment within GoodData where models, dashboards, permissions, and configurations are scoped and deployed.
YAML/JSON: Human-readable file formats used to define declarative analytics configurations in GoodData.
This glossary will continue to evolve with the platform. For the most up-to-date definitions and technical documentation, please visit https://www.gooddata.com/docs/cloud/.
Resources
The GoodData platform is designed to meet teams where they are — whether you're evaluating, building, or scaling analytics products. Here are some helpful resources to dive deeper:
- Try GoodData Cloud — Get hands-on with a trial of the full platform.
- Product Tours — Watch quick overviews of GoodData modules and capabilities.
- Customer Stories — Learn how real teams are scaling data products with GoodData.
- Webinars — Join live and on-demand sessions, hosted by the GoodData team and featuring guest experts.
- GoodData University — Explore self-paced courses and interactive training resources.
- Developer Docs & GitHub — Access API/SDK documentation and open-source tools to build and extend your solutions using with ready-made templates and guides..
- Community & Slack — Ask questions, join discussions, and connect with peers and GoodData engineers.
Need help assessing your use case or planning an implementation? We're here to help. Reach out to us here.
Enjoy this article as well as all of our content.
Trusted by


Does GoodData look like the better fit?
Get a demo now and see for yourself. It’s commitment-free.