Claims insights
Greater efficiency, better adjusting decision and increased customer satisfaction
Request a demo
Live demo + Q&A

Key features
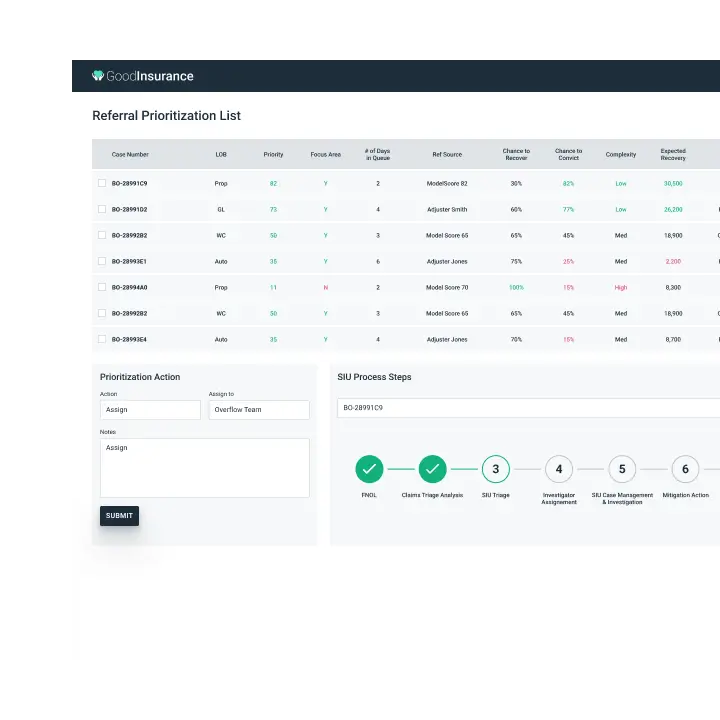
Manager's view
Claim and SIU managers gain quick insights on the priorities of the fraud referrals based on the priority scores calculated by a predictive model. Additional information such as the source of the referral, summary of the loss, and who would be the best adjustor for a specific claim is also provided. Armed with more contextual information, claims teams are better equipped to determine the next best action.
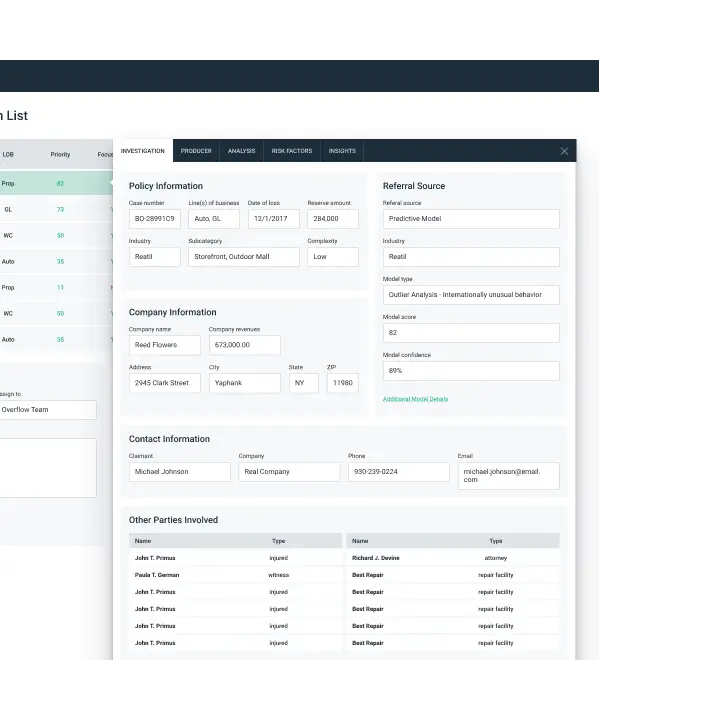
Claims investigation
GoodData provides the ability to pull in all the relevant data from internal and external sources together for claims teams to make informed decisions. This automated process allows the domain experts to spend more time adjusting the claim or fraud referral instead of digging up the relevant information manually.
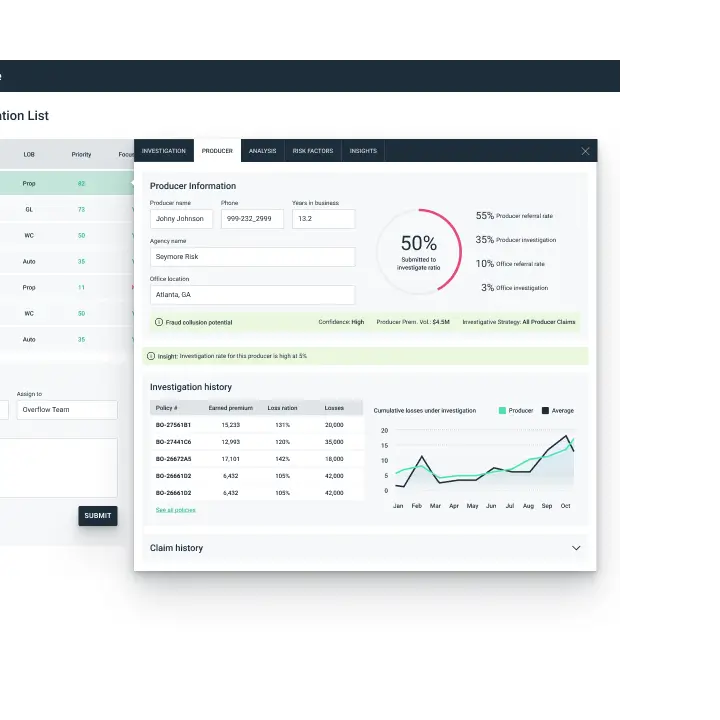
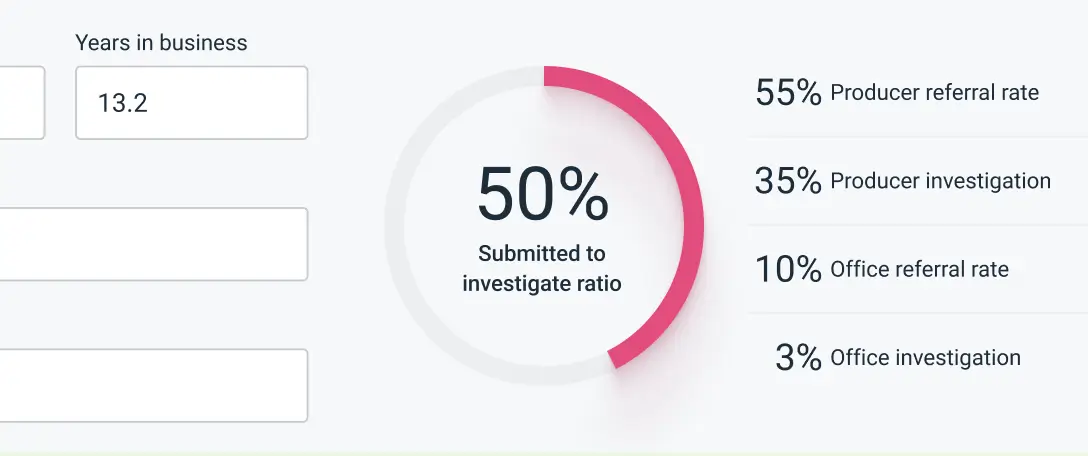
Producer & broker details
Not only does GoodData Claims Insights provide deeper visibility into the policyholder and their claims, but it also reveals information about agent or broker around fraud collusion potential, past fraudulent claims, number of SIU referrals along with loss ratio on their book of business. Such information helps field reps and adjusters make better management decisions for their territory.
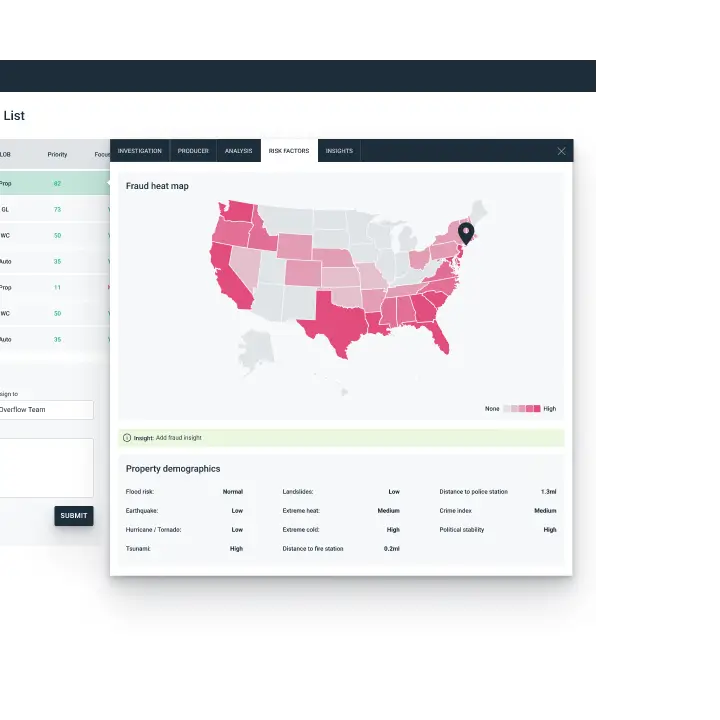
Risk overview
SIU and claims managers can easily obtain a comprehensive view on the risk factors in the claim region. Claims teams can rely on the Fraud Heat Map, as well as additional data points in the target region to make educated claim evaluation and effectively identify potential fraudulent claims.
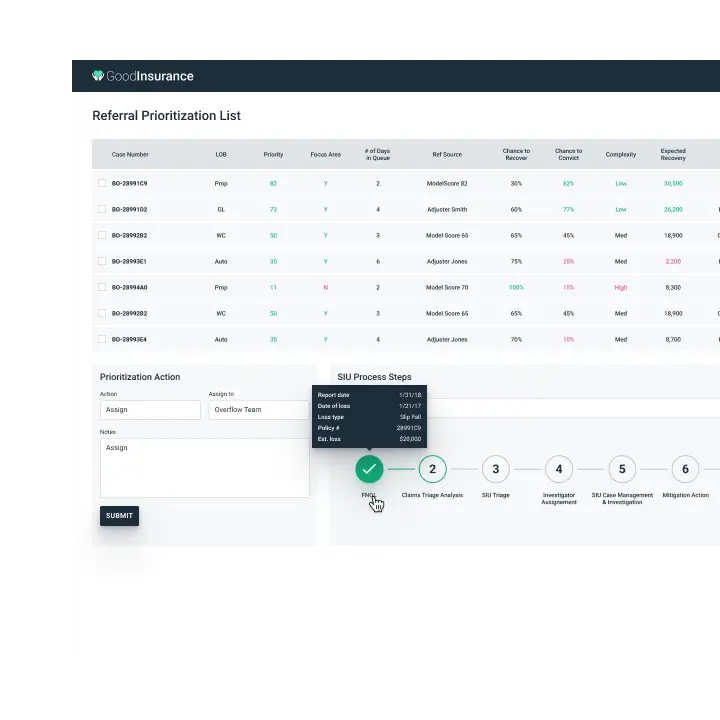
End-to-end claim visibility
An end-to-end, time-series claims view uncovers critical information at each phase of the claim investigation while delivering the best next action recommendations powered by machine learning and AI. Claims managers and SIU investigators can hover over the various process steps to view exactly what has happened to the claim and what the next best action should be taken.
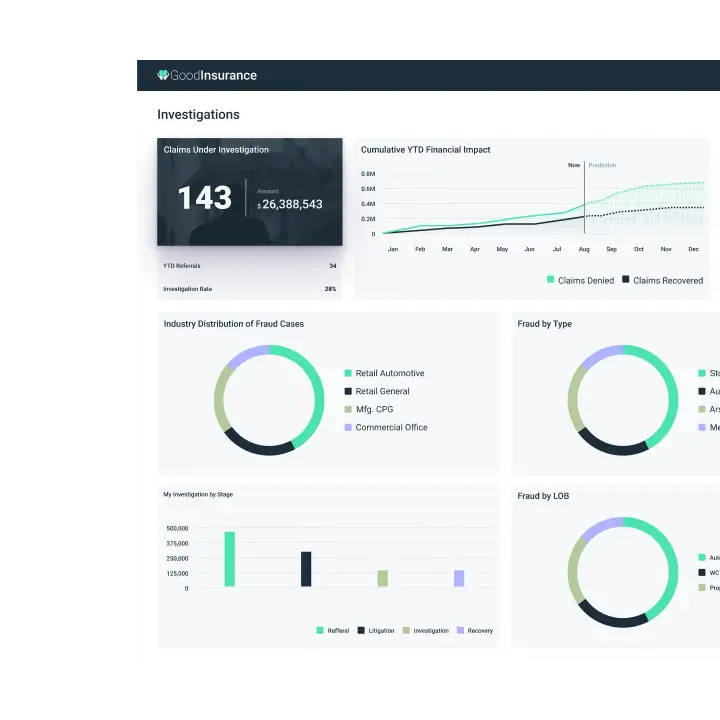
Claims summary dashboard
Regional managers and claims leaders are provided with a dashboard view with aggregated KPIs vital to their business. A summary of the claims trends by line of business, industry or cause of loss and more is readily available. Key metrics such as Average Number of Days to Close, Reserve Deviation, etc, are also revealed. Unlike a static report, the interactive dashboard allows drill-down into the source systems for further analysis.
Try GoodData yourself
Request a demo
Live demo + Q&A
Try it now
30-day trial

A trusted platform, loved by users