Key questions and answers from the fintech technical webinar
2 min read | Published
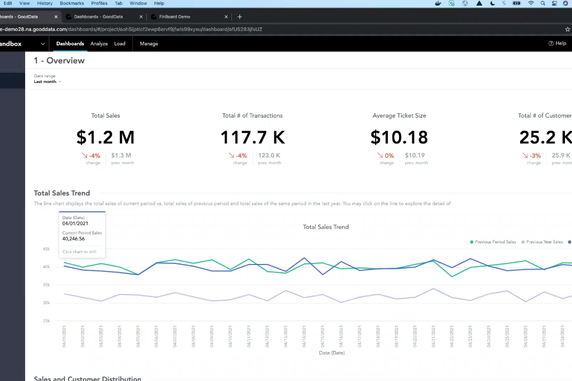

Our recent fintech webinar demonstrated how to build a benchmarking tool with the GoodData platform. During the technical webinar, two of our experts shared a live demo and explained how to create the logical data model (LDM); produce measures, insights, and KPI dashboards; integrate GoodData analytics into a fintech company’s application; and more. If you missed the webinar, you can watch the full recording here.
Below are the top questions from the Q&A portion of the event.
Thanks for sharing your development process for a single client of Finboard. Does this mean we have to replicate this process for every single one of our clients? Or, is there an easier way to distribute to our clients?
This is definitely possible to do in GoodData. For demo purposes, we showed a single workspace with data loaded from a CSV, but we have out-of-the-box tools to help configure workspace and user provisioning, as well as release or roll out via Life Cycle Management (LCM).
Additionally, we have Automated Data Distribution (or ADD) available out of the box to orchestrate and execute data distribution to all of your client workspaces.
If you are interested in learning more about these functions, we have some great materials at GoodData University as well as our help documentation.
What's the difference between embedding a dashboard using an iframe and using GoodData.UI?
This GoodData Community article, Embedding via iFrame vs GD.UI DashboardView, provides an in-depth explanation to this question.
Want to see what GoodData can do for you?
Get a guided tour and ask us about GoodData’s features, implementation, and pricing.
Request a demoIs there a way to automate data loads, or do we need to keep refreshing the LDM Modeler updated CSVs for each of our clients?
Yes, automation of data pipelines or loads are all possible in GoodData’s Data Integration Console. This is an interface used by data engineers and architects to configure different ETL components such as data loads via ADD.
You can have jobs run in different cadences that fit your data pipeline needs. Dragging and dropping CSVs in the LDM is really recommended as a development approach. For production, we highly recommend automation through our standard bricks in Data Integration Console.
Can I use GoodData.UI in a non-React environment?
Yes, although GoodData.UI is designed to be used in a React environment, it can technically be used with any other front-end frameworks and libraries. There’s also gooddata-js, which is a vanilla JavaScript low-level wrapper around our APIs (and completely independent of React).
For the benchmarking dataset you used in this demo, what is the granularity of the dataset?
The primary key for this file is set at the aggregation of Location ID and Date. This way, we were able to anonymize what companies were considered in the peer group for different locations. It’s important that these aggregations or benchmarks can be mapped back to the rest of the LDM in a meaningful way that satisfies all of the reporting requirements you want to provide for your end users.
Can I embed individual insights in the same manner as you embedded the whole dashboard?
Yes, similar to how dashboards are embedded using GoodData.UI’s <DashboardView /> component, you can make use of an <InsightView /> component to integrate a single insight.
To learn more about how GoodData can help you keep pace with the evolution of financial services, schedule a demo with one of our engineers at gooddata.com/demo.