How to Build Internal Analytics Without Relying on Senior Engineers
4 min read | Published

Revamping internal analytics often requires a delicate balance between data expertise and technical prowess. What if your team lacks an army of senior engineers? This article unveils our journey in reconstructing internal analytics from scratch with only two individuals armed with limited SQL and Python skills. While senior engineers typically tackle feature development and bug fixes, we demonstrate that resourceful planning and strategic tool selection can empower you to achieve remarkable results.
The Architecture of Internal Analytics
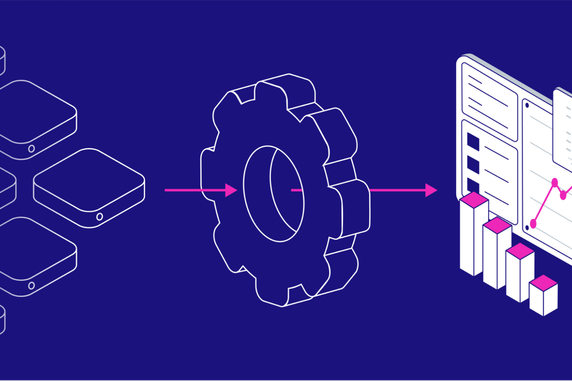
With just two data analysts proficient in SQL and, to a limited extent, Python, we adopted an approach emphasizing long-term sustainability. To streamline our process, we drew inspiration from the best practices shared by our engineering colleagues in data pipeline development (for example, Extending CI/CD data pipelines with Meltano). Leveraging tools like dbt and Meltano, which emphasize using YAML and JSON configuration files and SQL, we devised a manageable architecture for internal analytics. Check the open-sourced version of the architecture for details.

As you can see in the diagram above, we employed all the previously mentioned tools — Meltano and dbt for most extract, load, and transform phases. GoodData played a pivotal role in analytics, such as creating all metrics, visualizations, and dashboards.
Data Extraction and Loading With Meltano
To centralize our data for analysis, we harnessed Meltano, a versatile tool for extracting data from sources like Salesforce, Google Sheets, Hubspot, and Zendesk. The beauty of Meltano lies in its simplicity. Configuring credentials (URL, API key, etc.) is all it takes. Loading the raw data into data warehouses like Snowflake or PostgreSQL is equally straightforward, further simplifying the process and eliminating vendor lock-in.
Transformation With dbt
Transforming raw data into analytics-ready formats is often a formidable task. Enter dbt — if you know SQL, you basically know dbt. By creating models and macros, dbt enabled us to organize data for analytics seamlessly.
Models are tools you'll use in analytics. They can represent various concepts, such as a revenue model derived from multiple data sources like Google Sheets, Salesforce, etc., to create a unified representation of the data you want to observe.
The advantage of dbt macros is their ability to decouple data transformation from underlying warehouse technology, a boon for data analysts without technical backgrounds. Most of the macros we've used were developed by our data analysts, meaning you don't need extensive technical skills to create them.
Analyzing With GoodData
The final output for all stakeholders is analytics. GoodData sealed this loop by facilitating metric creation, visualizations, and dashboards. Its easy integration with dbt, self-service analytics, and analytics-as-code capabilities made it the ideal choice for our product.
Our journey was marked by collaboration with most of the work spearheaded by our data analysts. We didn't need to do any advanced engineering or coding. Though we encountered certain challenges and some things didn't work out of the box, we resolved all the issues with invaluable support from the Meltano and dbt communities. As both projects are open-source, we even contributed custom features to speed up our implementation.
Best Practices in Internal Analytics
Let's also mention some best practices we found very useful. From our previous experience, we knew that maintaining end-to-end analytics is no easy task. Anything can happen at any time: an upstream data source might change, the definition of certain metrics might alter or break, among other possibilities. However, one commonality persists — it often leads to broken analytics. Our goal was to minimize these disruptions as much as possible. To achieve this, we borrowed practices from software engineering, such as version control, tests, code reviews, and the use of different environments, and applied them to analytics. The following image outlines our approach.
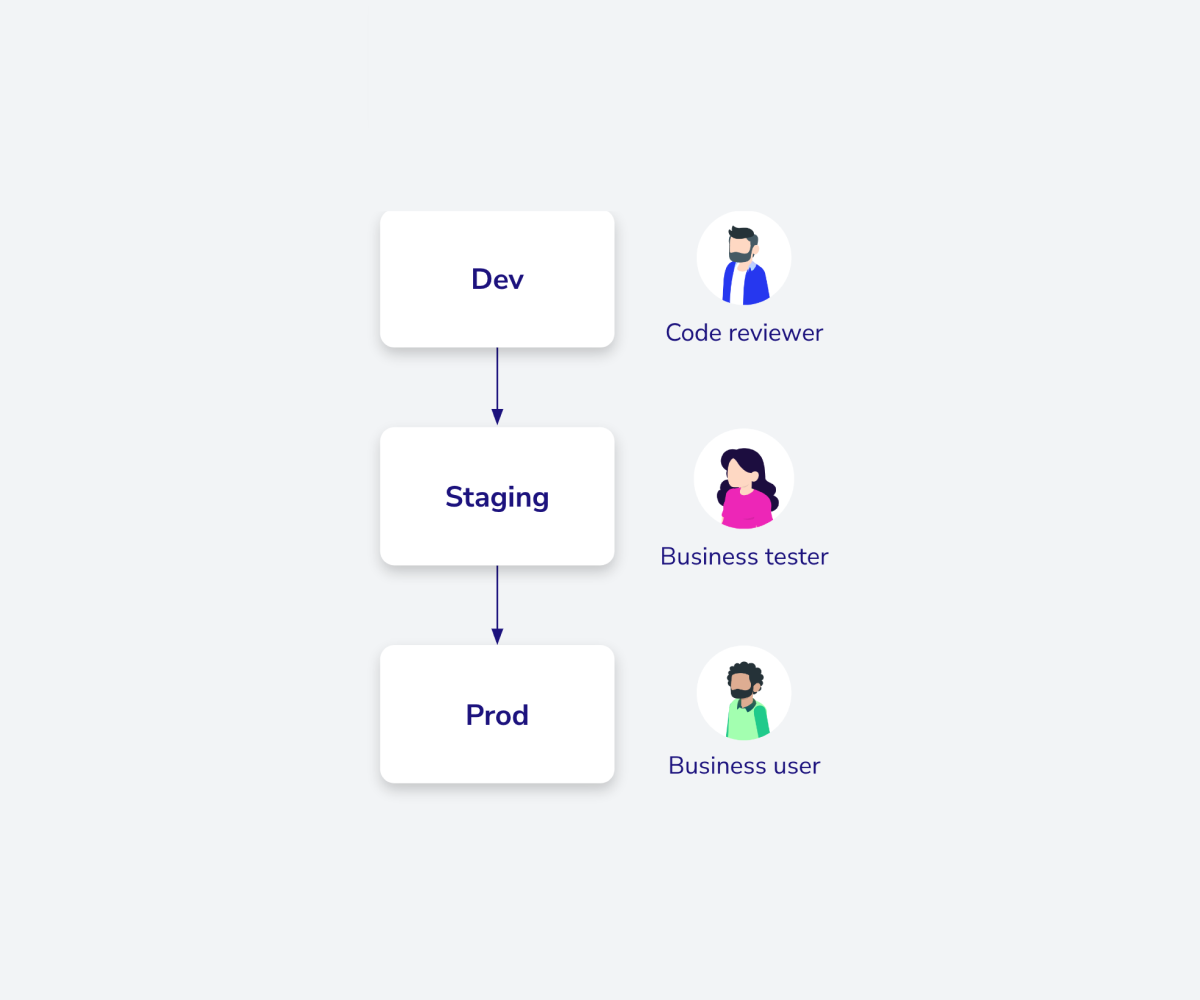
We utilized multiple environments: dev, staging, and production. Why did we do this? Let's say a data analyst wants to change the dbt model of revenue. This would likely involve editing the SQL code. Such modifications can introduce various issues, and it's risky to experiment with production analytics that stakeholders rely on.
Therefore, a much better approach is to first make those changes in an environment where the data analyst can experiment without any negative consequences (i.e., the dev environment). Furthermore, the analyst pushes their changes to platforms like GitHub or GitLab. Here, you can set up CI/CD pipelines to automatically verify the changes. Another data analyst can also review the code to ensure there are no issues. Once the data analysts are satisfied with the changes, they move them to the staging environment, where stakeholders can review the changes. When everyone agrees the updates are ready, they are then pushed to the production environment.
This means that the probability of something breaking is still the same, but the probability of something breaking in production is much lower.
Effectively, we treat analytics similarly to any software system. Combining tools such as Meltano, dbt, and GoodData facilitates this harmonization. These tools inherently embrace these best practices. Dbt models provide universally comprehensible data model definitions, and GoodData allows for the extraction of metric and dashboard definitions in YAML/JSON formats, enabling analytics versioning via git. This approach resonates with us because it proactively averts production issues and offers an excellent operational experience.
Check It Out Yourself
The screenshot below shows the demo we've prepared:

If you want to build it yourself, check our open-sourced GitHub repository. It contains a detailed guide on how to do it.
Strategic Preparation is Key
What began as a potentially lengthy project culminated in a few short weeks, all thanks to strategic tool selection. We harnessed the prowess of our two data analysts and empowered them with tools that streamlined the analytics process. The main reason for this success is that we chose the right tools, architecture, and workflow, and we have benefited from it since.
Our example shows that by applying software engineering principles, you can effortlessly maintain analytics, incorporate new data sources, and craft visualizations. If you're eager to embark on a similar journey, try GoodData for free.
We're here to inspire and assist — feel free to reach out for guidance as you embark on your analytics expedition!
Experience GoodData in Action
Discover how our platform brings data, analytics, and AI together — through interactive product walkthroughs.
Explore product tours

