GoodData CoreUI Integration
3 min read | Published

There is a wealth of open-source HTML bootstrap templates for analytics, and finding the option that best suits your needs is an important task that takes time. However, you can only see the real value of each template when you plug in actual data underneath. So we asked ourselves:
What does it take to replace dummy template data with real-time interactive analytics powered by GoodData?
Let's find out.
Analytics HTML Website Templates
To choose the best template, you'll have to consider many different factors, but you should always start by asking yourself the question: Who is my typical customer? Once you know the answer to this, you can proceed to answer the questions below:
- What is the license?
- Is the template up-to-date and well-maintained, with a community behind it that can offer help?
- Does it contain the types of visualizations I'll be needing most?
- Will it work on a desktop as well as on a tablet or phone?
- Does it come only in plain HTML, or does it also come with out-of-the-box support for JSX (React), Handlebars (Ember), or another language?
For this exercise, we decided to go with CoreUI, specifically CoreUI for React.js. To set it up, let's just peek into CoreUI's README:
# clone the repo
$ git clone https://github.com/coreui/coreui-free-react-admin-template.git my-project

# go into app's directory
$ cd my-project

# install app's dependencies
$ yarn install // or npm install
And this is how it looks fresh out of the box:
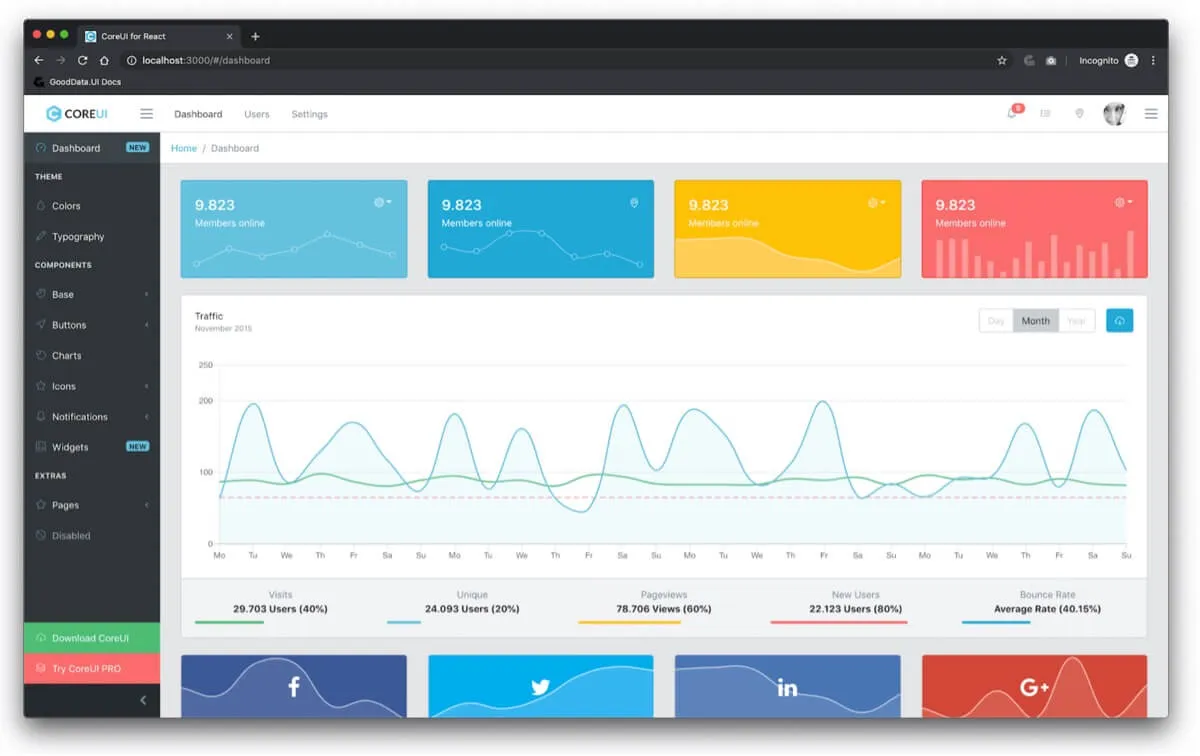
What's wrong with it? Absolutely nothing, except… it shows dummy data! So let's go ahead and replace the hard-coded numbers with some real analytics.
Experience GoodData in Action
Discover how our platform brings data, analytics, and AI together — through interactive product walkthroughs.
Explore product toursBefore We Begin
GoodData is a secure platform that requires proper authentication to access the analytics. However, for the simplicity of this exercise, we are going to connect to an exposed dummy workspace that does not require any means of authentication.
Import GoodData.UI
Now let's navigate to the source code of CoreUI for React.js and add GoodData.UI as a dependency:
# inside my-project folder
$ yarn add @gooddata/sdk-backend-base @gooddata/sdk-backend-bear @gooddata/sdk-model @gooddata/sdk-ui
The GoodData platform is only accessible via secured HTTPS, so we need to tell that to react-scripts by updating package.json accordingly:
# /package.json

-    "start": "react-scripts start",
+    "start": "HTTPS=true react-scripts start",
Note: If you are using Windows (cmd.exe), use set HTTPS=true&&npm start instead. For more information, see the Create React App page.
The last modification needed is to create a gooddata.js config file in the /src folder:
import bearFactory from '@gooddata/sdk-backend-bear'
import { AnonymousAuthProvider } from '@gooddata/sdk-backend-base'

const backend = bearFactory({
  hostname: 'https://interactive-examples-proxy.herokuapp.com/',
}).withAuthentication(new AnonymousAuthProvider())

export default backend
That's it! All the configuration needed is done, so now is a good time to restart the localhost development server. If it's still running, stop it with CTRL+C, then restart it by running:
$ yarn start // or npm start
Let's now move on to rendering our first visualization!
Render a KPI
To render a KPI, let's start by navigating to /src/views/Widgets/WidgetDropdown then importing GoodData.UI and the configuration we created earlier to the beginning of the file:
# /src/views/Widgets/WidgetDropdown.js

import { Kpi } from '@gooddata/sdk-ui'
import { newMeasure } from '@gooddata/sdk-model'
import gooddata from './../../gooddata'
Now let's pick a nice place to put our first Headline component and add the following line:
<Kpi
  backend={gooddata}
  workspace="psk46untnn2vhzs5bokdav3bu2puf6s6"
  measure={newMeasure('abljxJ9HatLT')}
/>
Note: The "abljxJ9HatLT" identifier represents the "Total Revenue" metric that exists in our demo workspace. We hardcoded it here to help you get started quickly. If you don't like magical constants in your code, you may want to check out our Catalog CLI tool.
Since CoreUI for React comes with a server hot reloading feature, once the Dashboard.js file is updated and saved, you should see your app automatically refresh to reflect the new changes:
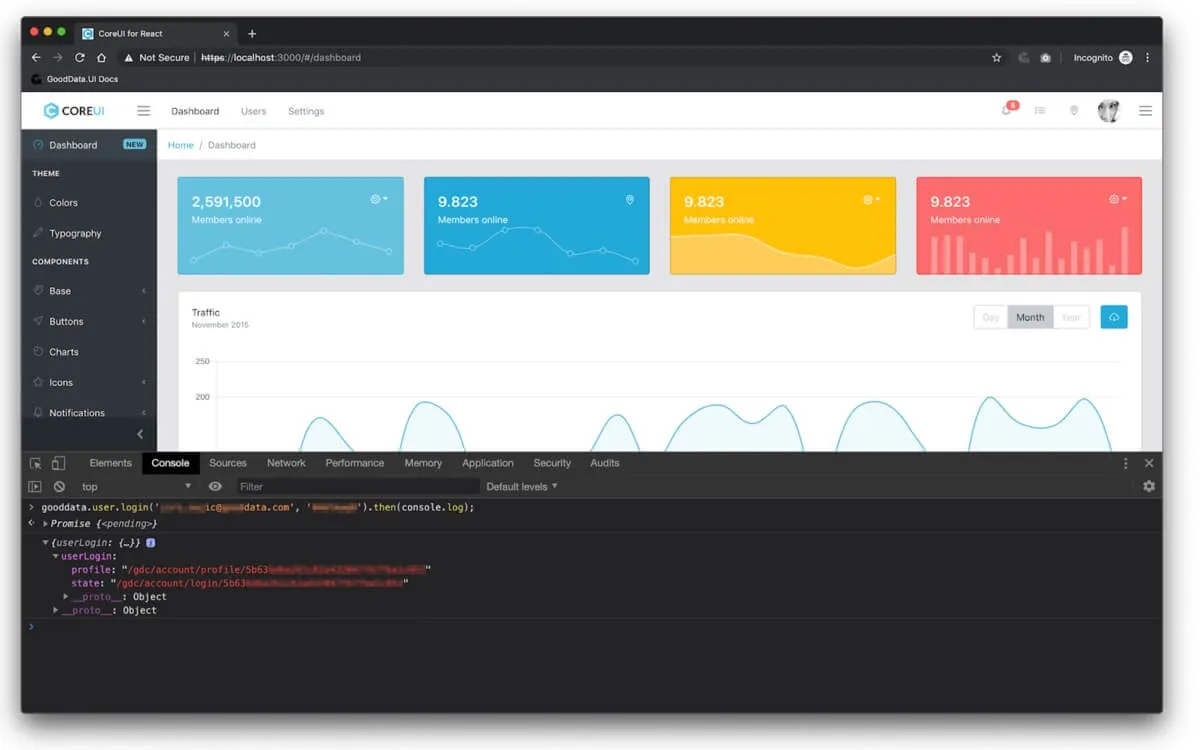
Double-check that you're running on HTTPS, and not HTTP! You should see that the first KPI on your screen is now live and that its formatting is different from other KPIs — the comma is used as a delimiter instead of a dot.
Summary
Well, that was it! You can find the result at: https://github.com/gooddata/gooddataui-coreui-example/tree/article.
Want to see for yourself how quick and easy it can be? Register for our free trial, create some insights from our library of visualizations, and design your first dashboard! And to kickstart your GoodData analytics experience, sign up for our GoodData University course.
Experience GoodData in Action
Discover how our platform brings data, analytics, and AI together — through interactive product walkthroughs.
Explore product tours