Embedded Analytics: GD.UI with a Product Marketer
5 min read | Published

Building a B2B application with analytics can be a complex and lengthy process. Not only do you need to decide how and what data you will be collecting, aggregating, and displaying, but you also need to build a state-of-the-art UI as well as visualizations for your ever-demanding users.
For some of us, this may be intimidating. What tools should be used? How many resources and how much time should be allocated? How difficult will it be? After all, not all of us were born to be developers, nor should we. I am, for example, a product marketer. But we all understand the importance of providing our users with the insights they need, simply and effectively, by giving them an interface they love and deserve.
What is GoodData.UI?
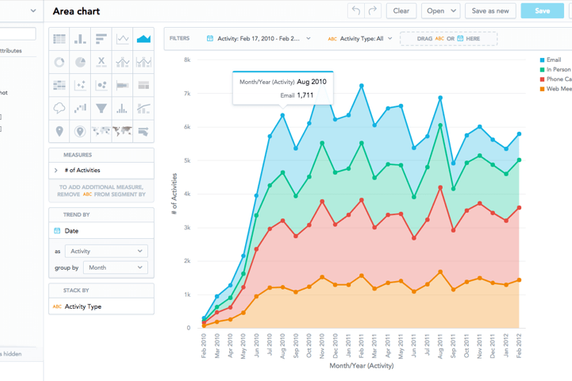
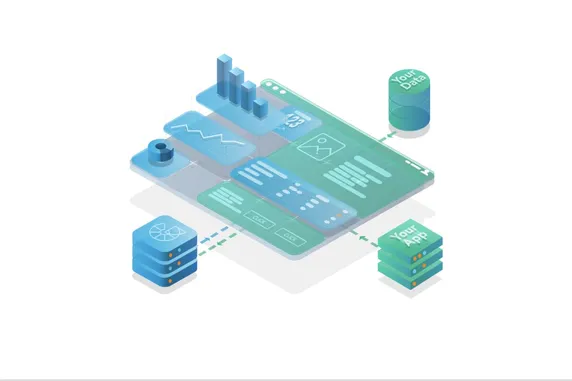
GoodData.UI was born to do exactly that. It is a component library that provides a fully open-sourced extensible framework and development productivity tools for JavaScript/TypeScript developers, a collection of proprietary Highchart based visualizations, and extensive documentation with interactive code samples. And it is designed to help your application developers quickly create and evolve interactive data analytics applications tailored to the needs of your users.
With GoodData.UI, you can take our pre-built components and put them together like LEGO® bricks while the GoodData analytics platform takes care of all queries and API calls for you. Or if you are not a LEGO enthusiast, you can think of it as the IKEA of analytics. GoodData.UI gives you the tools and instructions, and the only thing you need to do is to pick up your imaginary Allen key and assemble your data product. Ready-to-assemble analytics, at your service.
Getting started with GoodData and GoodData.UI
As a newly appointed product marketer at GoodData, I was eager to familiarize myself with our product, and what better way to do that than get my hands dirty.
GoodData offers hosted as well as cloud-native versions, the latter, GoodData.CN, coming in a community version suited exactly to my needs - evaluation and prototyping. Having docker already installed on my laptop, I just had to install the all-in-one GoodData image:
Docker pull gooddata/gooddata-cn-ceDocker run -i -t -p 3000:3000 -p 5432:5432 --name gooddata-demo --rm gooddata/gooddata-cn-ceThe image contains a demo workspace and includes a Postgres database with demo data. You can easily register a new data source for the direct connect (no moving data or duplication) and scan the model. Because I wanted to explore my own data, for the sake of my prototype, I added a new schema to the Postgres db and loaded the data there.
So, a batch of non-business-related data from 2020 and a
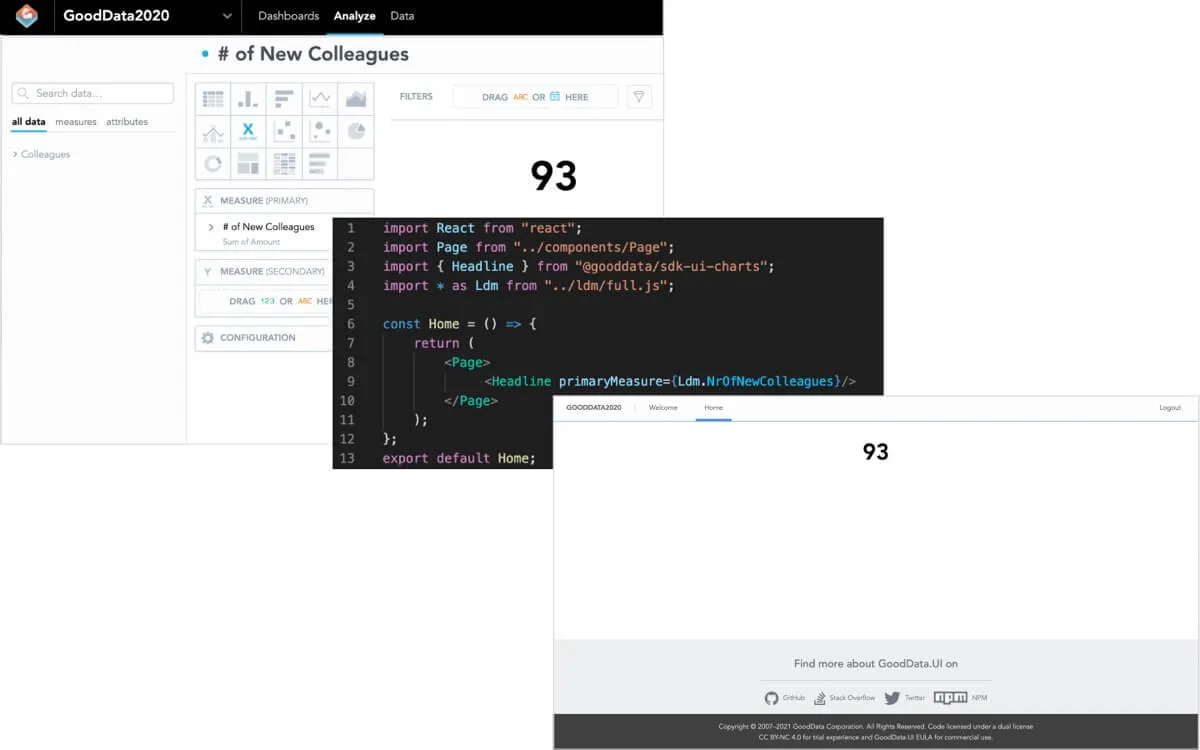
$ npx @gooddata/create-gooddata-react-app --backend tigercommand later, I had built my first analytical application with embedded analytics, GoodData2020. Playing with the GoodData analytical platform and GoodData.UI quickly demonstrated why themes like Quickly create and Tailored to the needs of your users are so important in the world of embedded analytics.
Experience GoodData in Action
Discover how our platform brings data, analytics, and AI together — through interactive product walkthroughs.
Get startedQuickly create — simple & seamless
You don’t need a PhD to utilize the GoodData analytical platform and you do not need a Masters in Computer Science to utilize GoodData.UI. GoodData.UI helps you to get your embedded analytics up and running quickly with a set of React.js components with Typescript types, granular packaging, detailed documentation, and interactive code samples.
Thanks to the pre-built components that connect directly to the GoodData platform and analytics engine, your productivity isn’t impacted by waiting on your back-end engineers. Once you have your data, the process of getting that data embedded on your users’ screens is straightforward and requires just a few lines of code. And just like that, with a few keystrokes, I successfully created a GoodData-powered application and embedded my first insight. It ain’t much but it is honest work.
Tailored to the needs of your users — flexible & adaptable
An embedded analytics platform equipped only with static iframes and other basic embedding options means that your UX teams and developers will be limited in bringing the best version of your analytics to your customers, workers, and partners. Even though the simplicity may be appealing and your solution may meet the requirements of today, you should always be thinking about the requirements of tomorrow. How much flexibility does your analytical platform offer if you need to change the built-in visualizations, interaction patterns, or other components?
If we continue with our IKEA analogy, you should never have to settle for the items they have in their catalog when you are planning to fit new items into a pre-existing environment that has its own unique design. Ready-to-assemble furniture has its time and place, but when you want to achieve the wow effect, you need something that is designed just and only for you.
With GoodData.UI, you can take the pre-built analytics components and customize them to meet your users’ exact needs. Everything is customizable. And when we say everything, we mean everything. And this full customizability allows you to create embedded analytics tailored to the needs of your users. Your users of today and tomorrow.
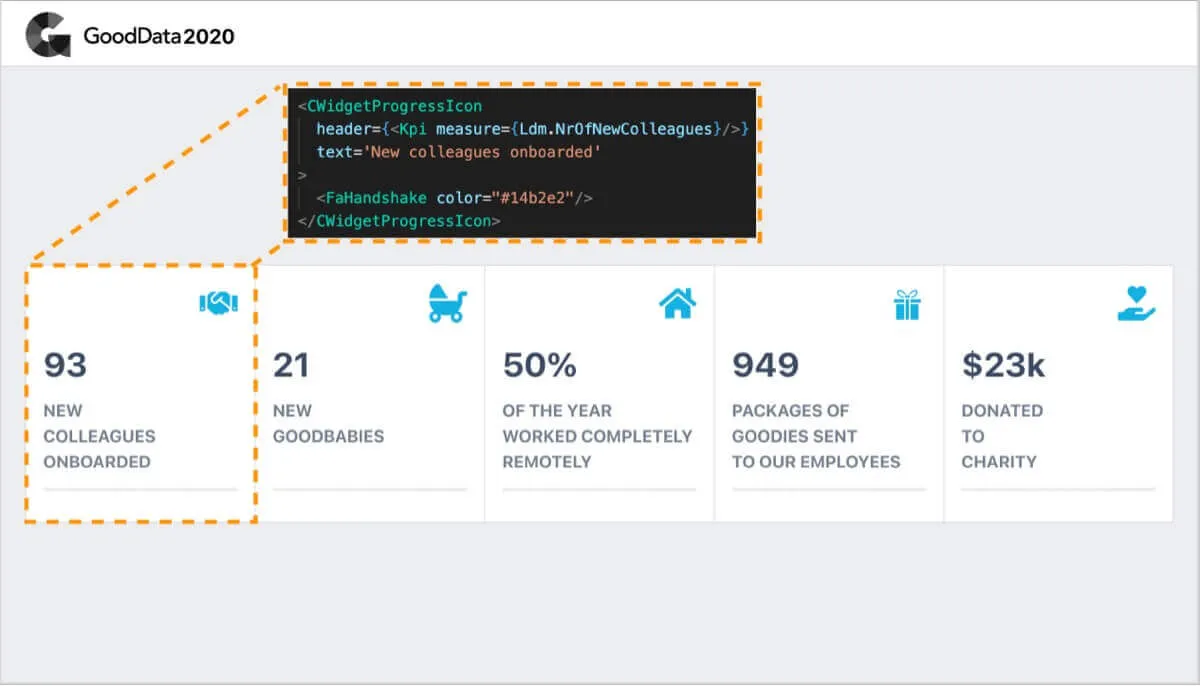
The core part of GoodData.UI is available under the MIT license and is ready to use even with the GoodData analytics platform’s free tier. It can be used with our pre-packaged filter components and Highcharts visualizations or with any of the thousands of controls and charting libraries available via npm. Therefore, you never have to compromise between your analytical platform’s capabilities and the desires of your customers and stakeholders again. You can build exactly what you need and update it as the requirements change in the future.
A powerful Javascript library for building better analytical applications
With analytics that can be developed, deployed, and customized faster to the final product, you and your customers get insights more quickly, which also then results in a better return on investment of the analytics solution, as the time to market is faster. Enhanced tools like GoodData.UI help spread analytics into every facet of your business and organization, empowering your workers, customers, and partners at all levels with analytics.
As mentioned earlier, there is nothing wrong with using static iframes and other basic embedding options when starting your analytical journey. You shouldn't reinvent the wheel if your use case does not require it. But it is equally important to understand that you need to be ready to take your analytical solution to the next level when the time comes and know that there are analytical solutions that can make that transformation easy, fast, and flexible.
If a product marketer, like myself, is capable of utilizing GoodData’s open-source component library on their first try, imagine what your dedicated developers can create for you and your users if they get their hands dirty with such a powerful tool like GoodData.UI.
I don’t always embed my analytics, but when I do, I use GoodData.UI.

Try it for yourself
Want to try it for yourself? Check out our cloud-native analytics platform or start directly with
Docker pull gooddata/gooddata-cn-ceon your command-line to get started. Create some insights from our library of visualizations and produce your first embedded analytics use case with GoodData.UI today.
Experience GoodData in Action
Discover how our platform brings data, analytics, and AI together — through interactive product walkthroughs.
Get startedIf you are interested in GoodData.CN, please contact us. Alternatively, sign up for a trial version of GoodData Cloud: https://www.gooddata.com/trial/