E-commerce and Retail Dashboard Examples: Transform Your Data into Actionable Insights


Summary
This article highlights key dashboard examples for e-commerce and retail, showing how they bring clarity to sales, marketing, customers, inventory, and operations. Each dashboard offers practical ways to track performance and uncover insights that support smarter decisions and smoother day-to-day management.
E-Commerce and Retail Dashboard Examples
Running an e-commerce or retail business is no small feat. It involves constantly juggling orders, staying on top of inventory, keeping customers happy, and making sure your marketing hits the mark. And that’s just the tip of the iceberg.
With so many moving parts, dashboards become your command center. They pull together scattered data from across your operations and turn it into clear, visual insights that help you make smarter, faster decisions.
When powered by the right data analytics platform, the eight dashboards below can help you stay in control and ahead of the competition
1. Executive Overview Dashboard
Designed for business leaders and executives, the Executive Overview Dashboard provides a high-level summary of a company’s performance (both online and offline). It tracks essential KPIs such as total sales, growth over time, customer acquisition costs, and the balance between online and offline channels. Decision-makers can then quickly assess the overall health of the business, compare current results to historical trends, and identify areas that need attention. This dashboard is the perfect starting point for aligning teams around core objectives and making informed strategic decisions.
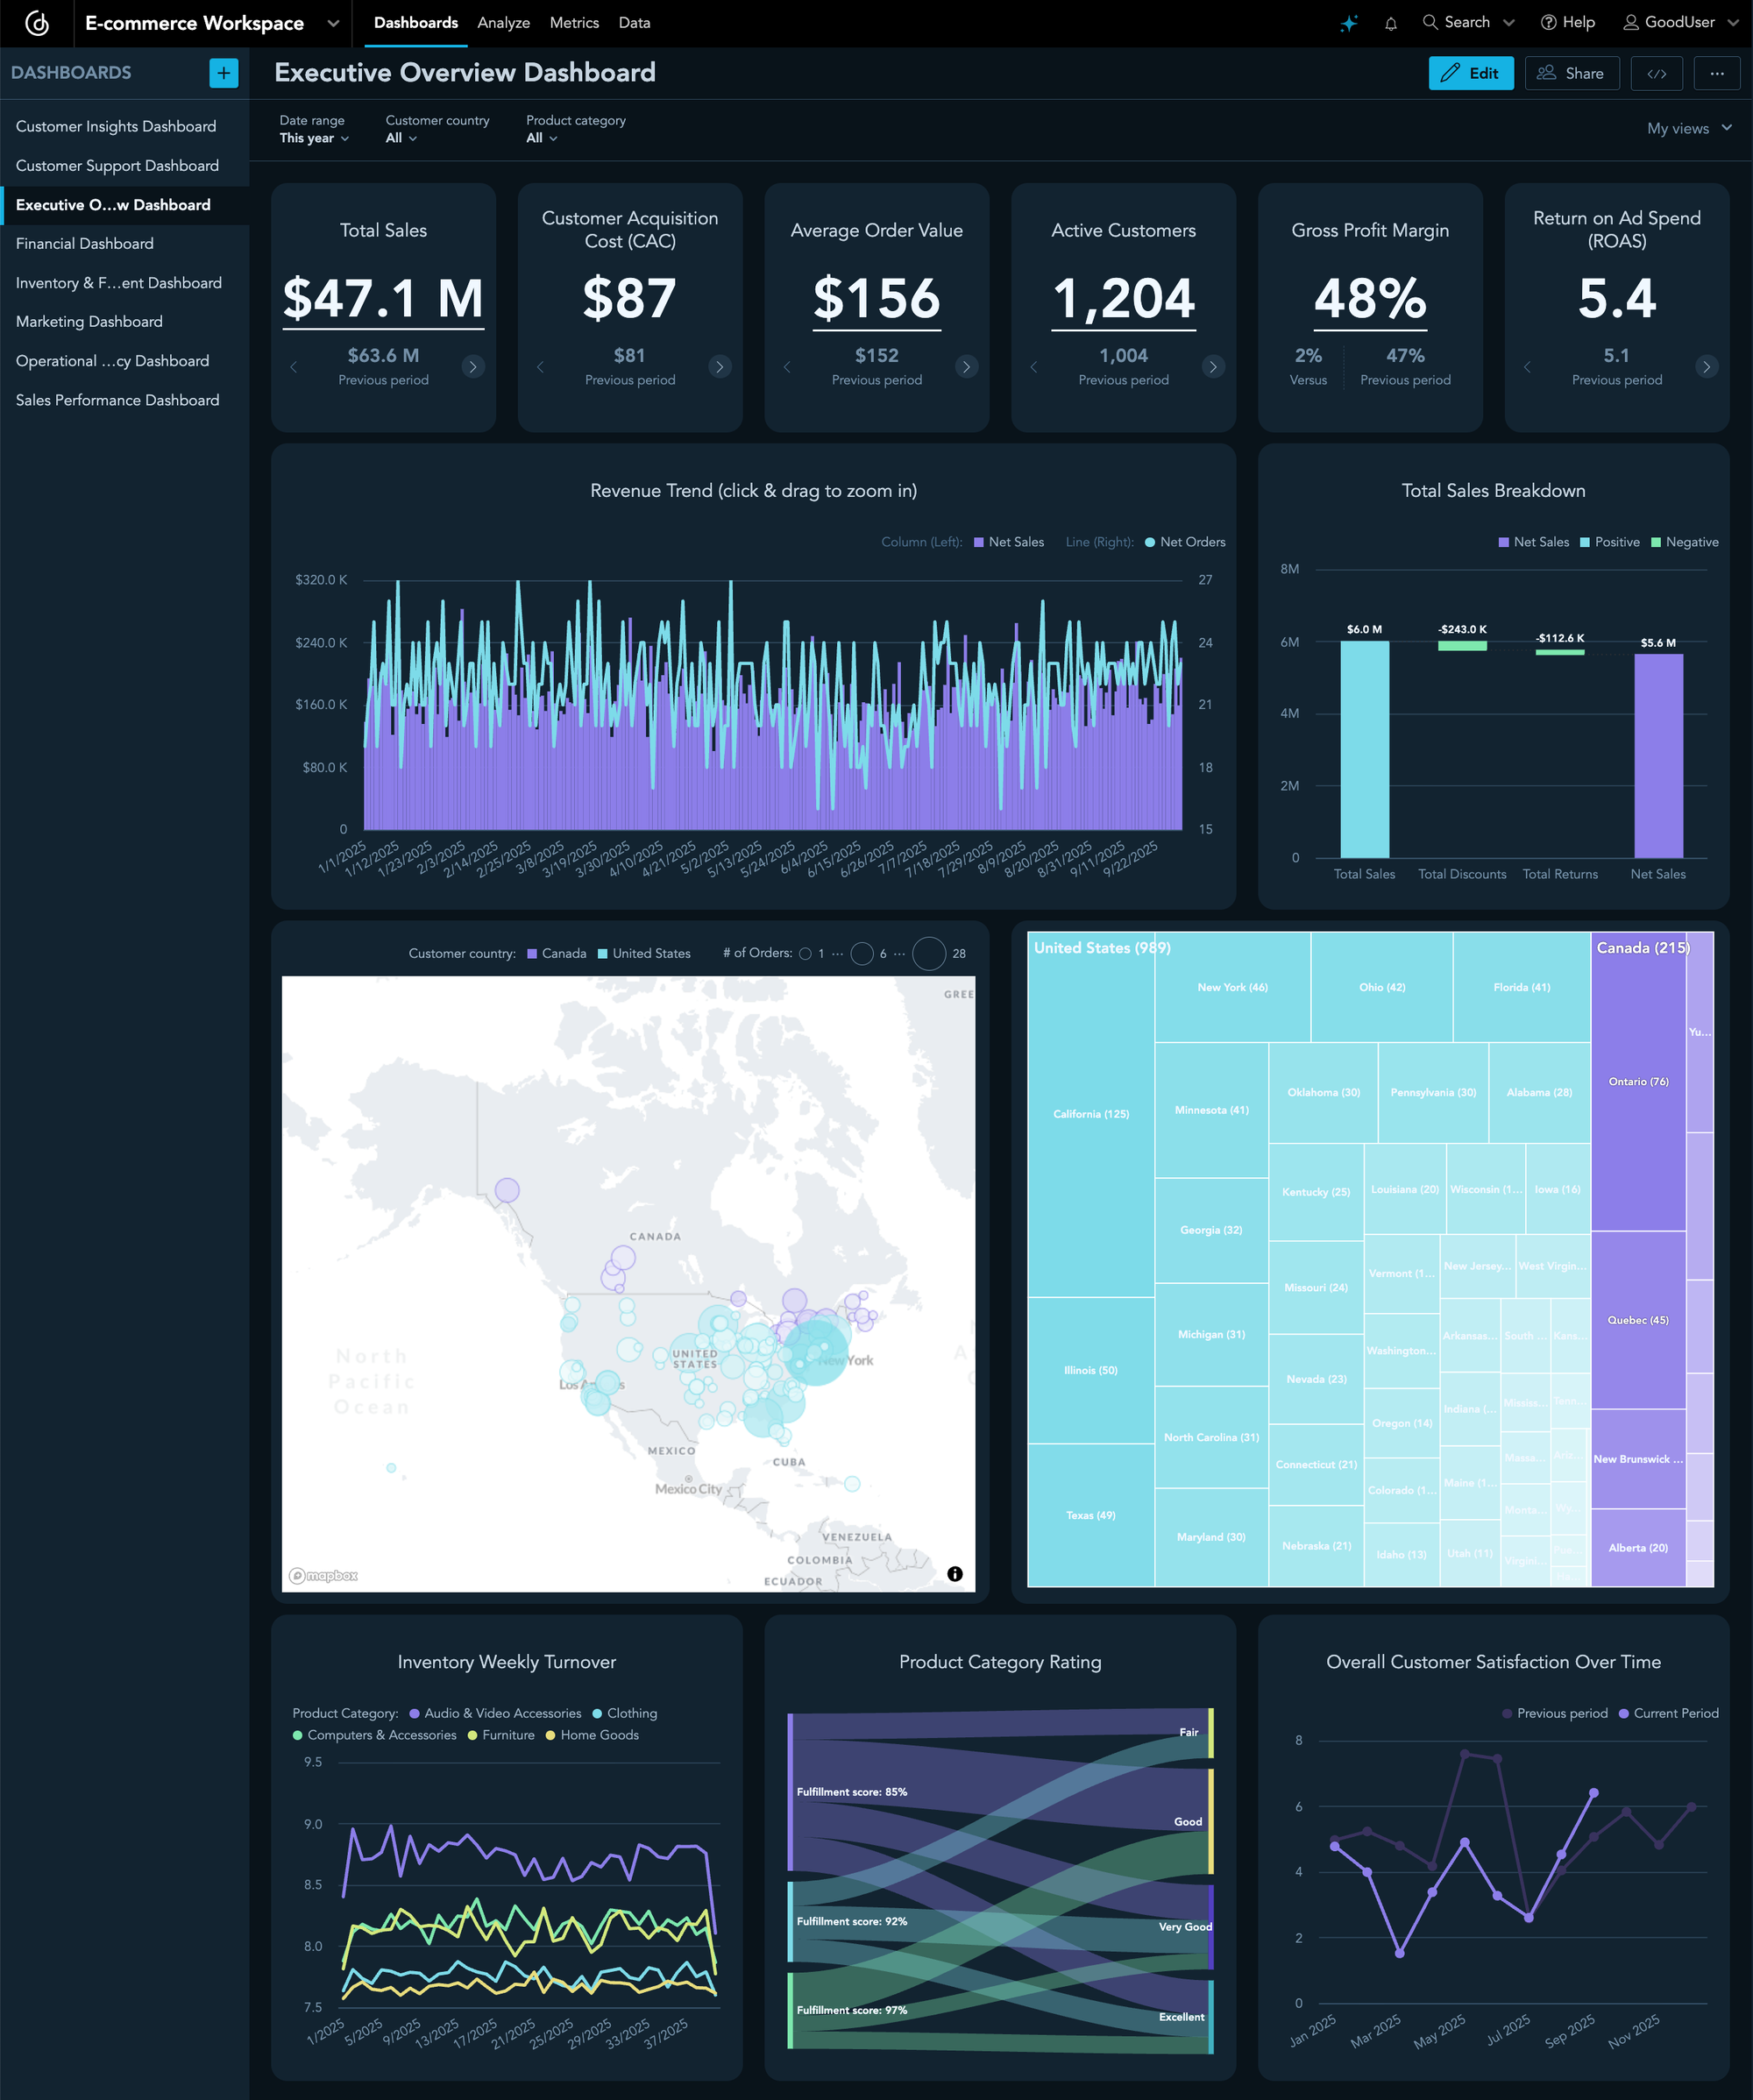
Executive Overview Dashboard
2. Sales Performance Dashboard
If you want a deep dive into what’s driving revenue, the Sales Performance Dashboard is your go-to. It breaks down sales data by product categories, regions, and sales channels, offering a clear view of what’s working and areas where there’s room to grow. Whether you're tracking top-selling items, analyzing web vs. in-store performance, or monitoring return rates, this dashboard helps you spot patterns and uncover opportunities.
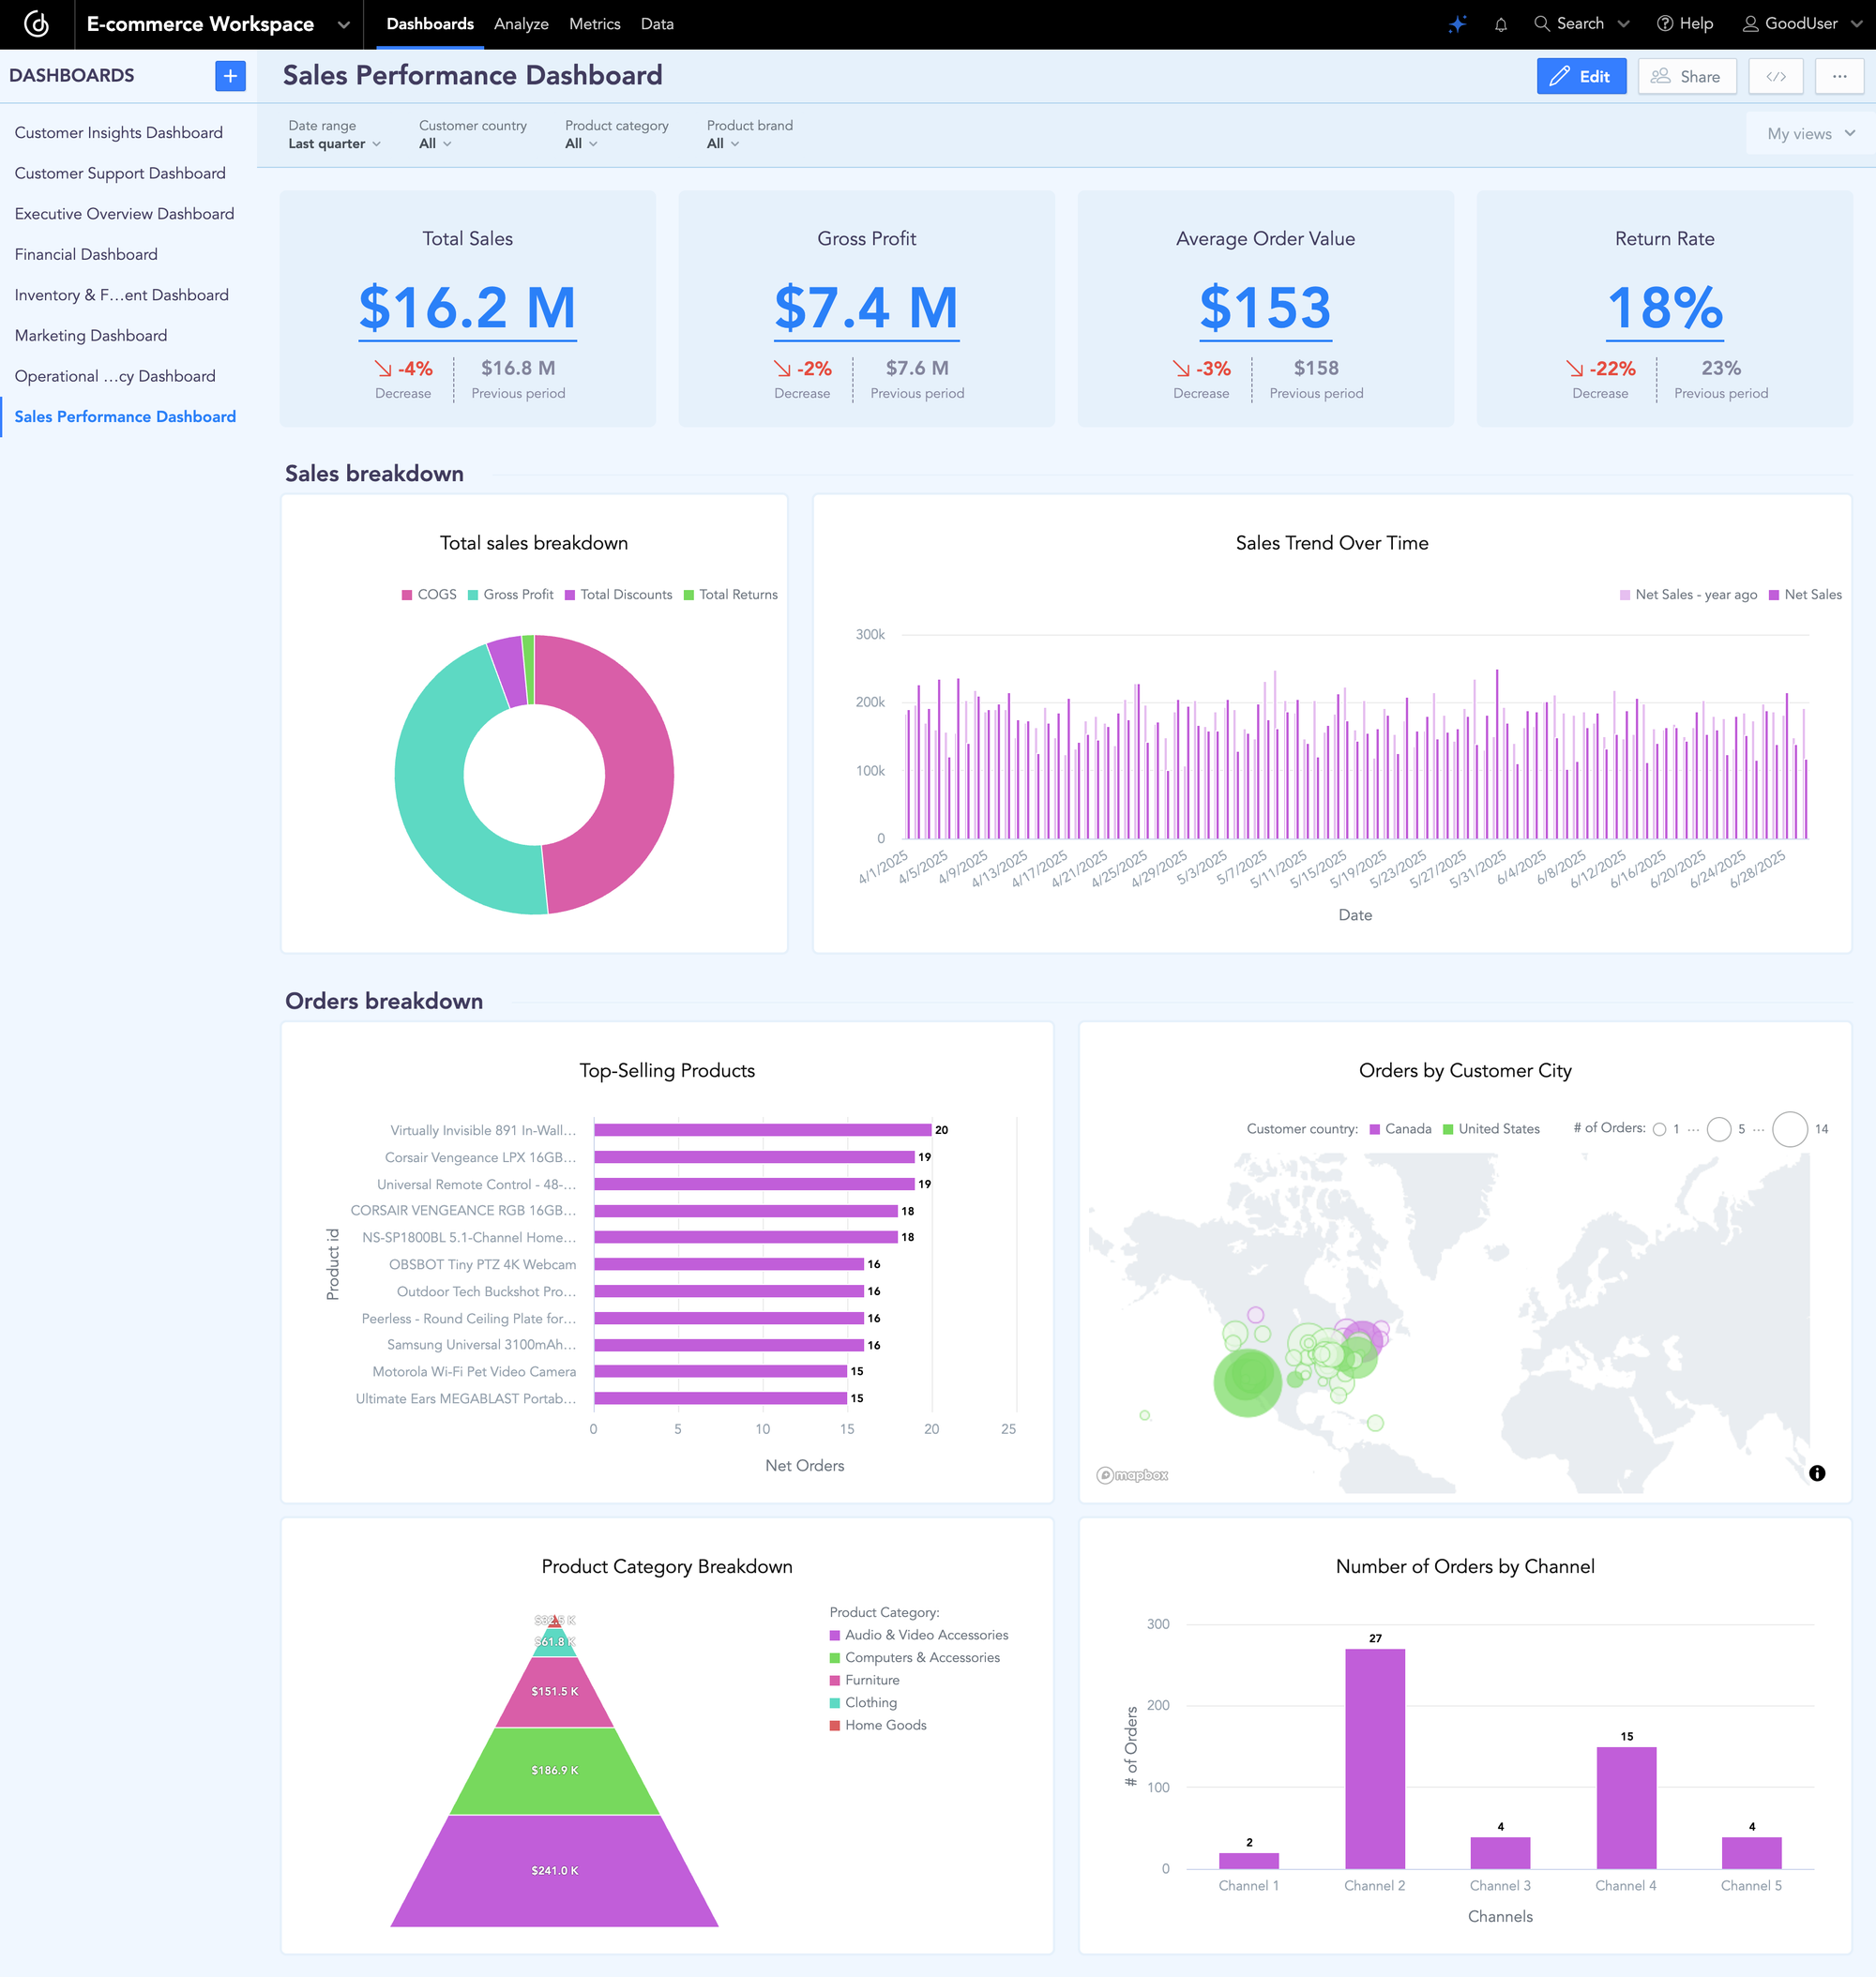
Sales Performance Dashboard
3. Marketing Dashboard
Marketing efforts can only be optimized if you know what’s actually working. A Marketing Dashboard gives your team the clarity they need by tracking campaign performance across channels. From return on ad spend (ROAS) and customer acquisition cost (CAC) to traffic sources and engagement metrics, this dashboard tells a story about how your audience is interacting with your brand. It reveals which campaigns are converting, which emails are being opened, and where your paid ad spend is most effective. This helps you refine messaging, allocate budgets, and ultimately drive more conversions with less waste.
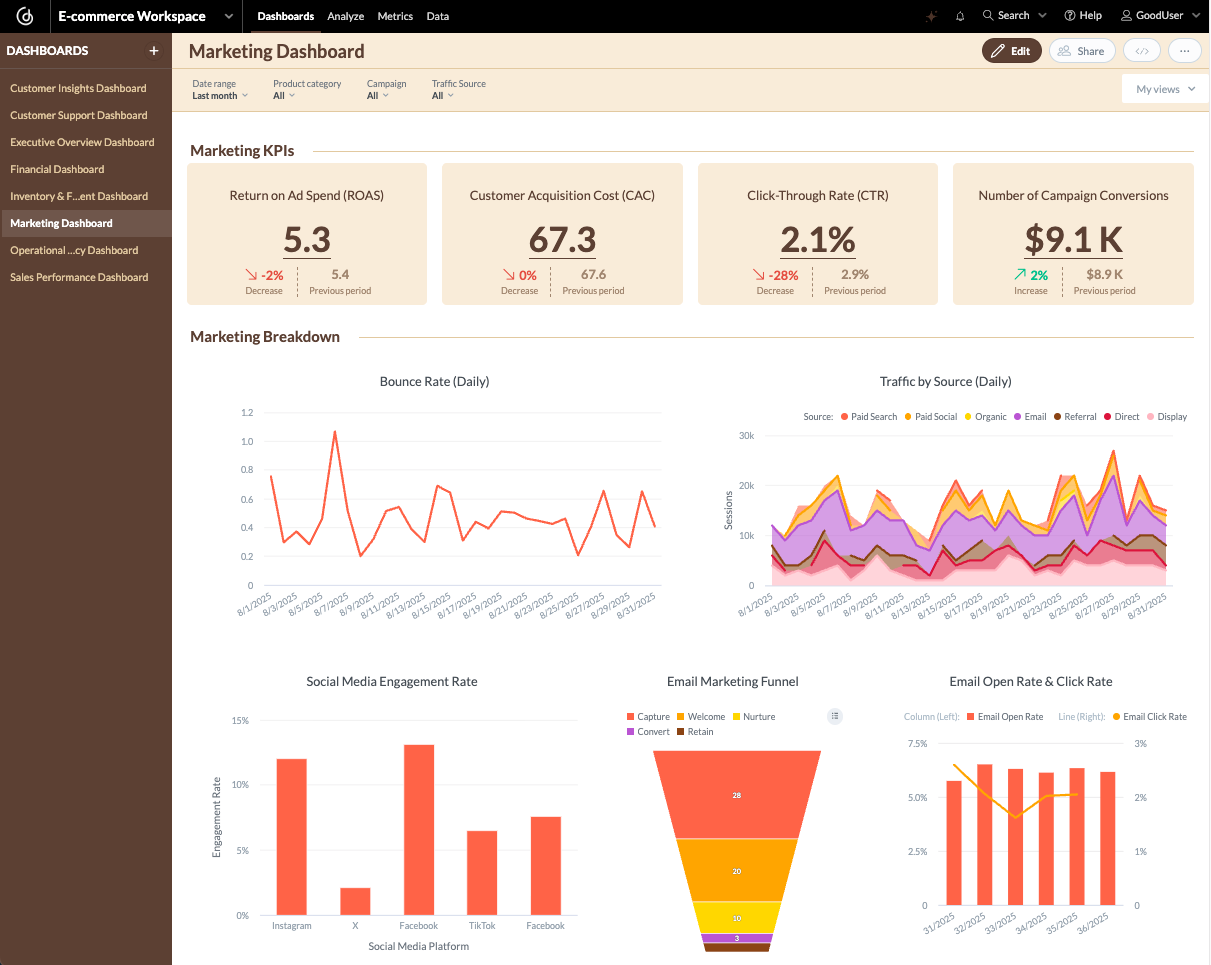
Marketing Dashboard
4. Customer Insights Dashboard
Understanding your customers is key to building lasting relationships and boosting revenue. The Customer Insights Dashboard covers behavior and value-based metrics, such as customer lifetime value (CLV), retention rates, and net promoter scores (NPS). It segments your audience by purchase frequency, recency, and average time between purchases, giving you a nuanced view of who your customers are and how they engage with your business. With these insights, you can personalize experiences, improve loyalty programs, and enhance your marketing strategies to better serve every segment.
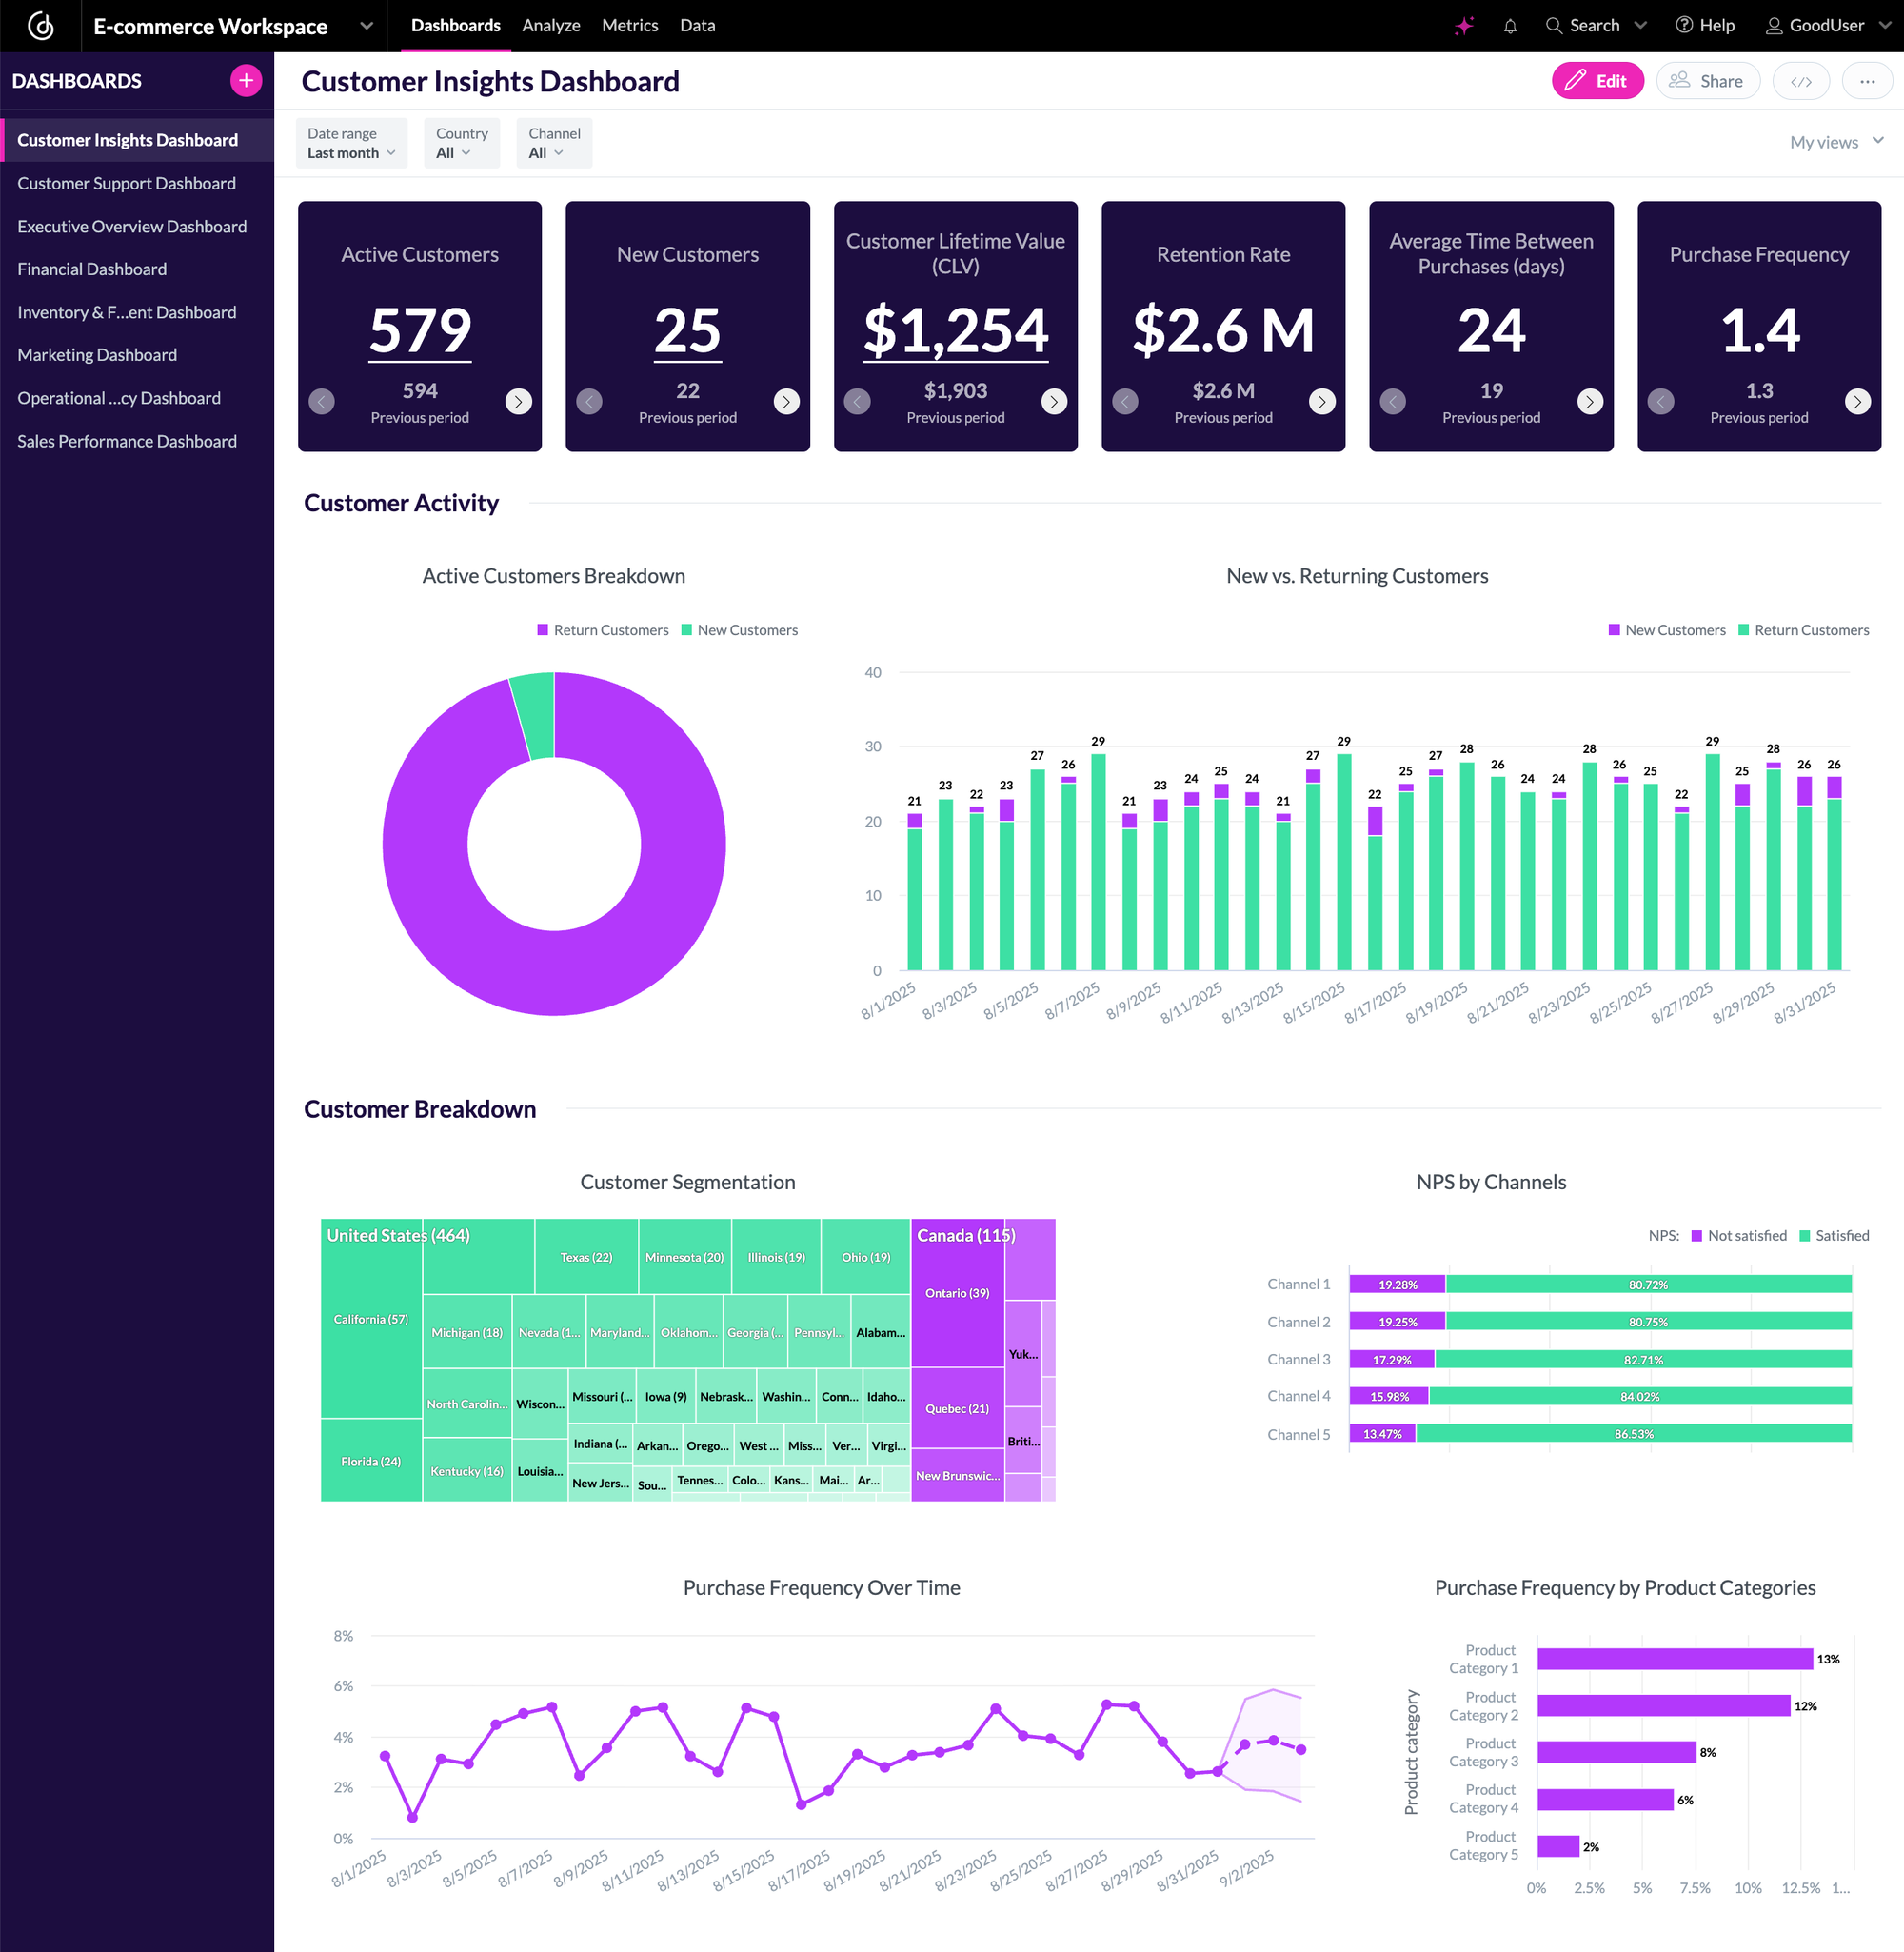
Customer Insights Dashboard
5. Inventory & Fulfillment Dashboard
Operational excellence begins with knowing what’s in stock, what’s moving, and how quickly you can deliver. The Inventory & Fulfillment Dashboard monitors critical logistics metrics like delivery times, inventory turnover, and stockout rates. It provides real-time visibility into your supply chain, helping you reduce costs, avoid missed sales, and keep customers happy. Whether you're managing multiple warehouses or just getting started with order fulfillment, this dashboard ensures your backend operations run as smoothly as your customer-facing ones.
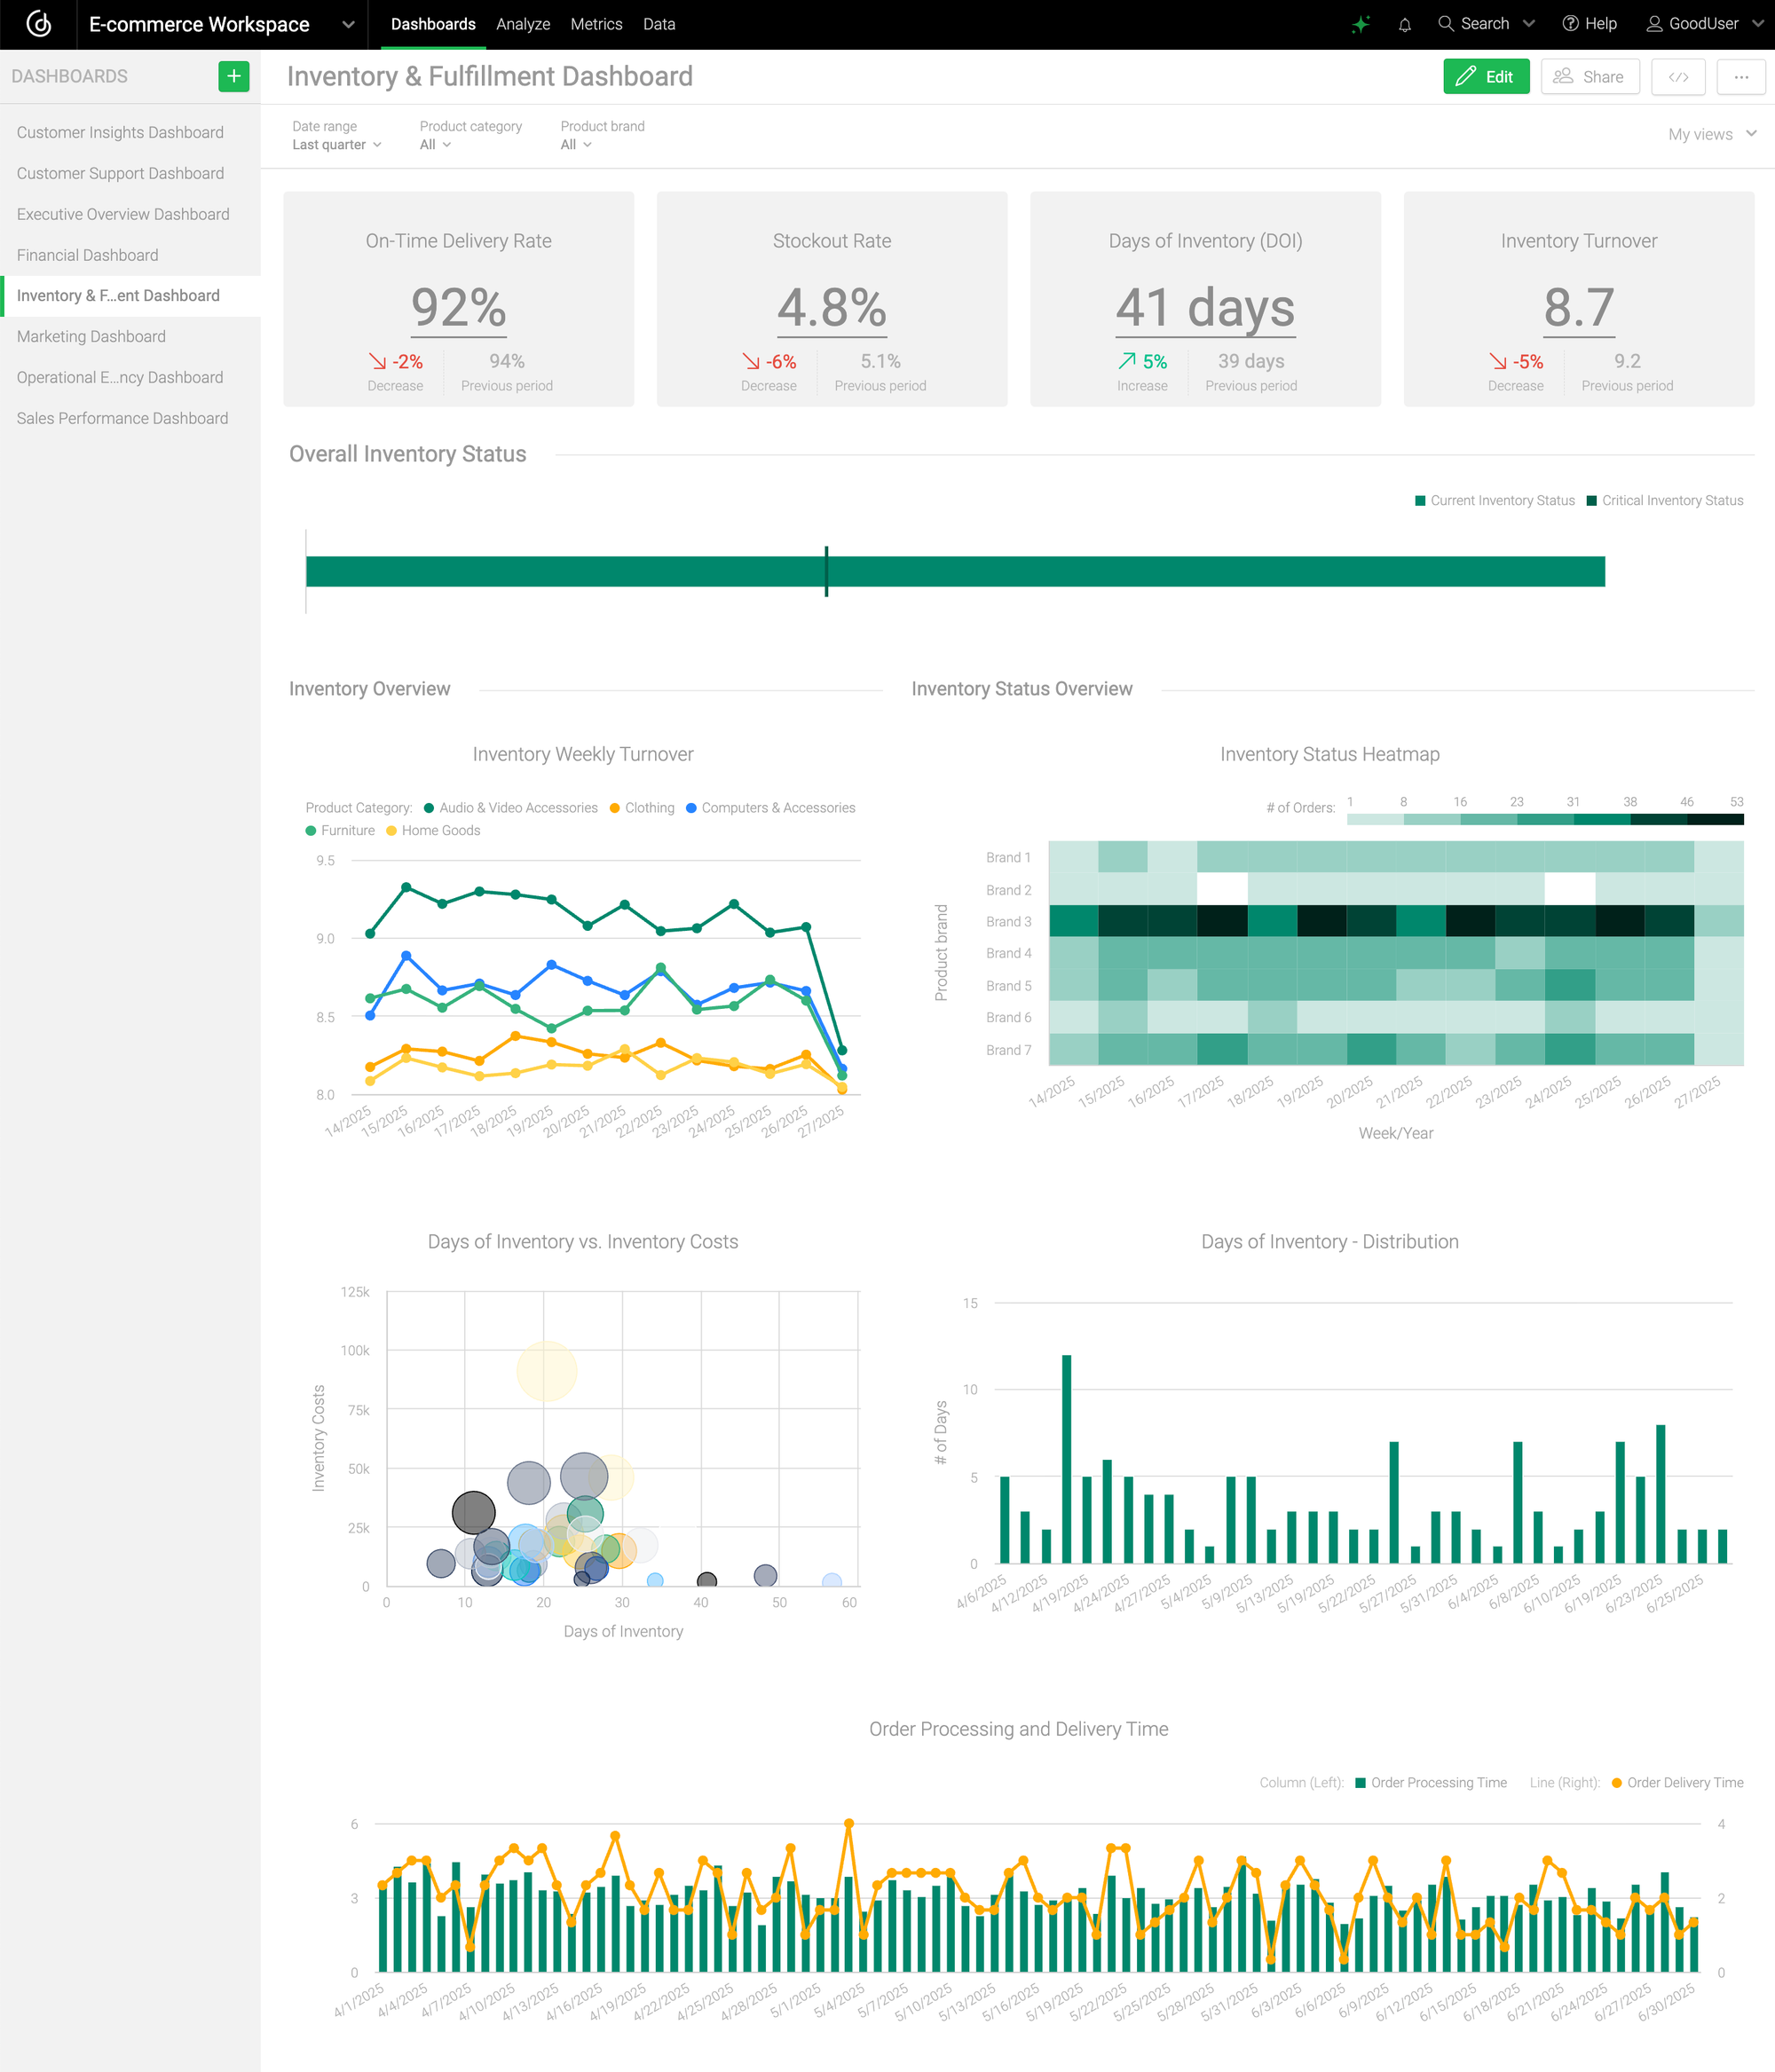
Inventory & Fulfillment Dashboard
6. Customer Support Dashboard
Your support team represents your brand in critical moments; a well-handled issue can transform a frustrated customer into a loyal advocate. The Customer Support Dashboard helps you monitor service performance by tracking response times, ticket resolution rates, and customer satisfaction scores (CSAT). You’ll know how quickly issues are being addressed, how many tickets are still open, and whether customers are returning with the same concerns. These insights enable your team to improve processes, reduce friction, and deliver exceptional service that builds trust.
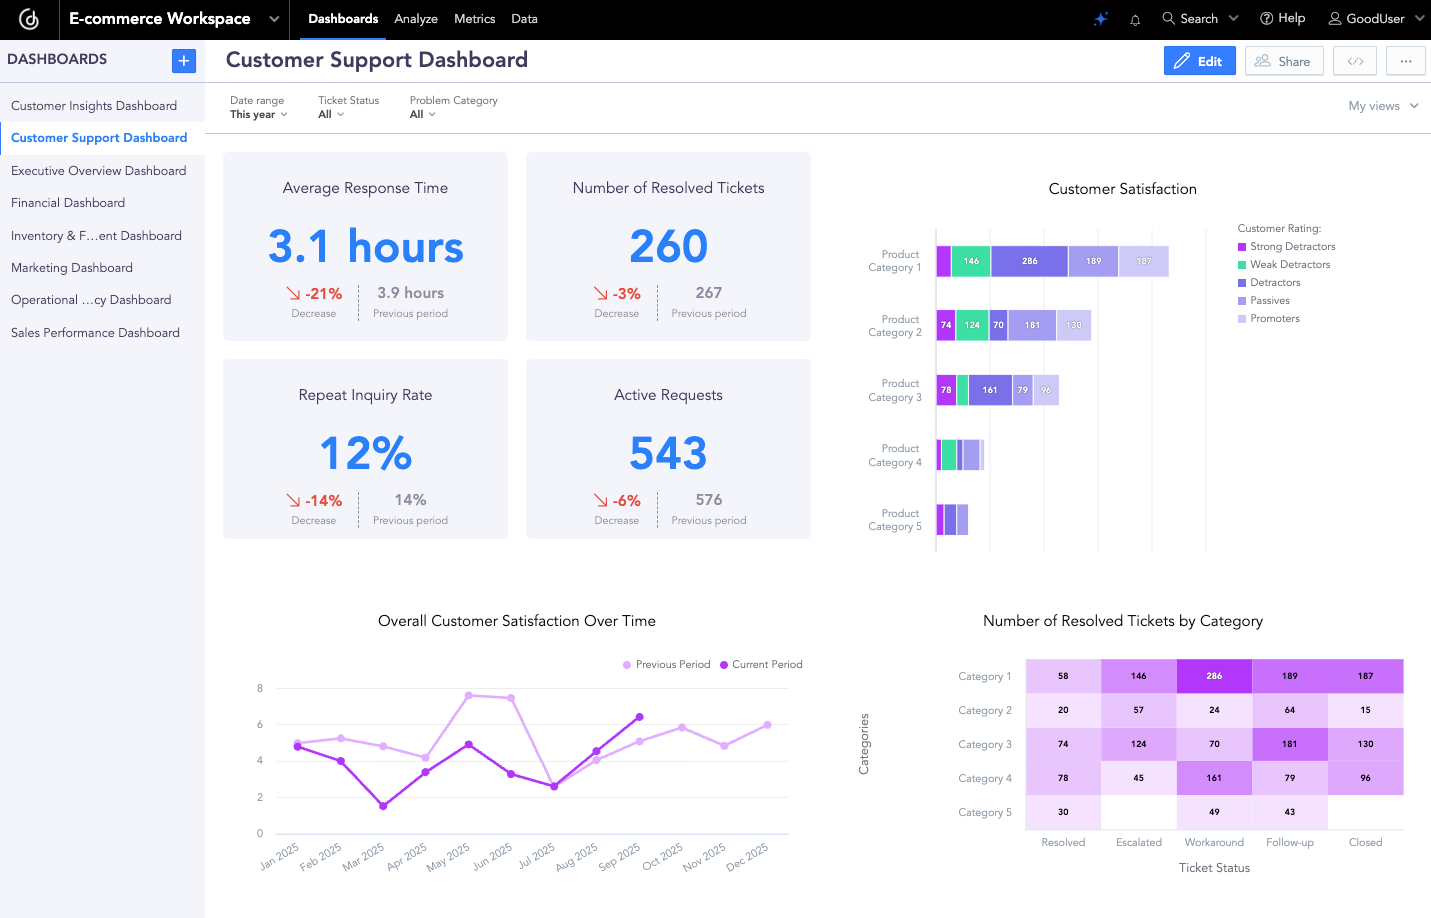
Customer Support Dashboard
7. Financial Dashboard
A clear understanding of your financials is crucial for long-term growth. The Financial Dashboard aggregates metrics like EBITDA, net profit margins, cash flow, and operating expenses into one centralized view. It helps you monitor cost-to-income ratios, identify your break-even point, and make better budgeting and investment decisions. Whether you’re presenting to stakeholders or planning next quarter’s strategy, this dashboard ensures that your financial health is always front and center.
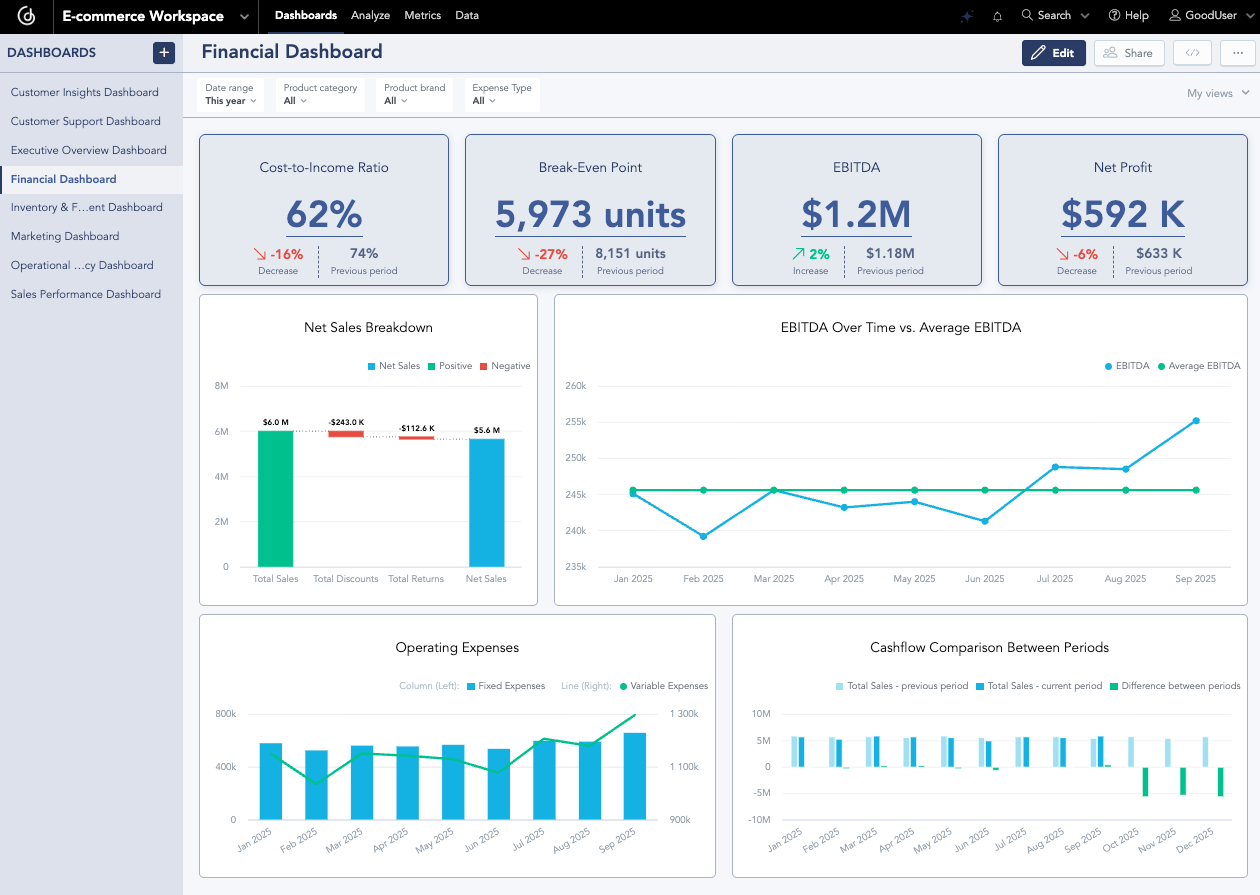
Financial Dashboard
8. Operational Efficiency Dashboard
Retail success relies as much on everyday efficiency as it does on forward-looking strategy. The Operational Efficiency Dashboard tracks the metrics that keep your stores and teams running like clockwork. From staff attendance and productivity to foot traffic and checkout time, this dashboard highlights both strengths and bottlenecks. Managers can use this information to adjust staffing, streamline processes, and ensure daily goals are being met, creating a better experience for both employees and customers.
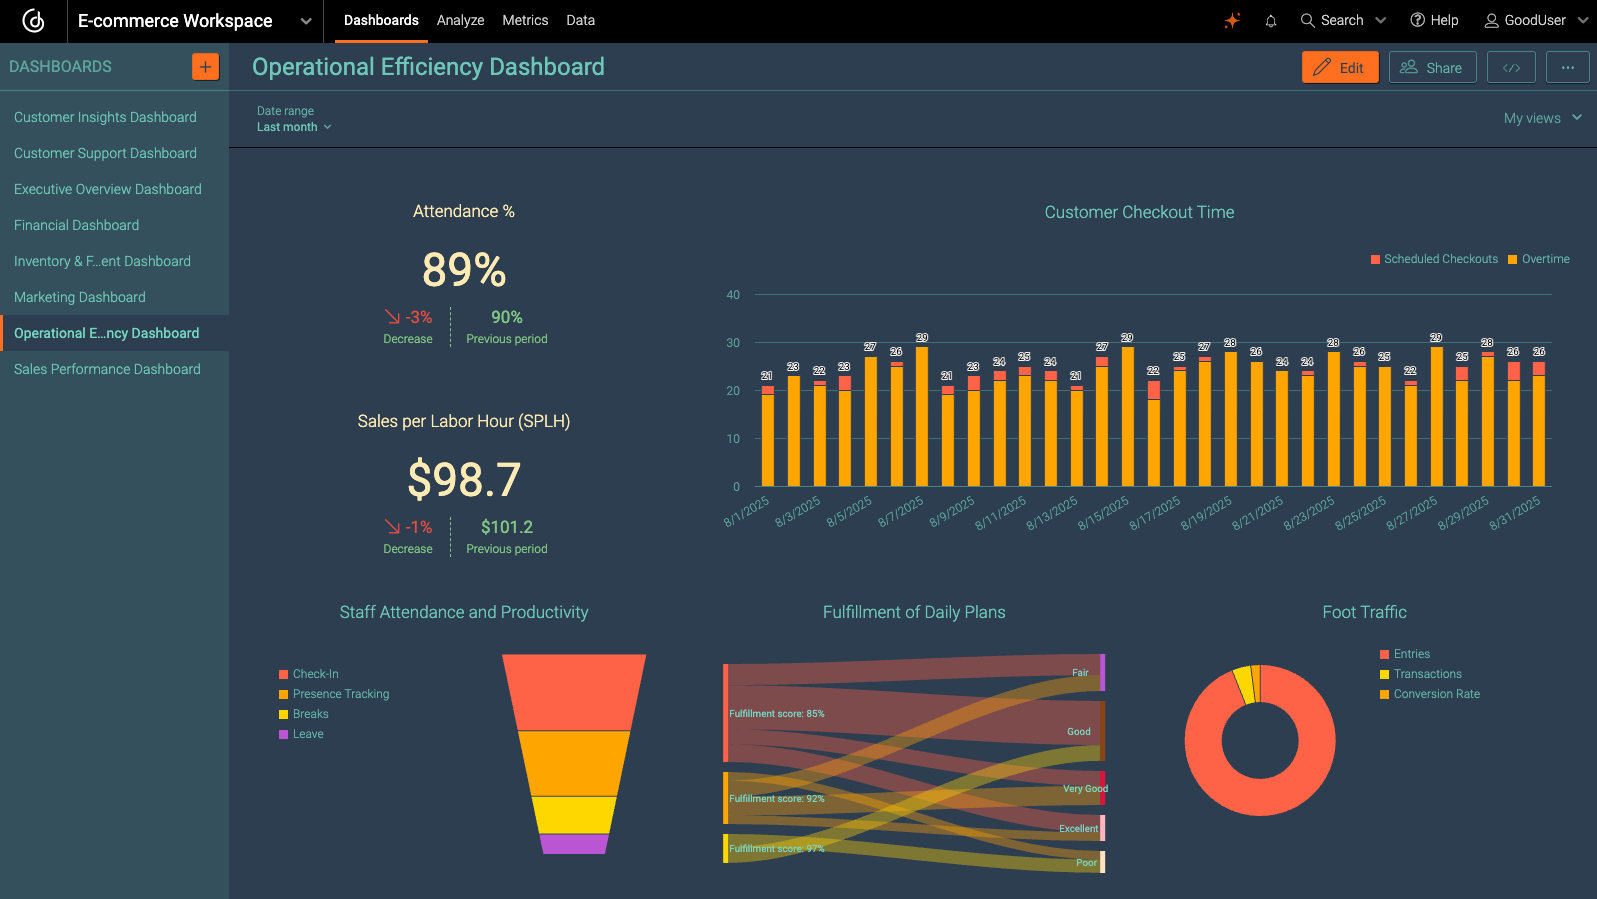
Operational Efficiency Dashboard
How To Build Dashboards That Scale With Your Business
Creating dashboards needn't be complicated. Our retail and e-commerce analytics platform brings sales, marketing, and operations data together in one place. Whether you’re an emerging e-commerce brand, a growing retailer, or a large enterprise, the platform adapts to your workflows and provides the metrics you need to make confident decisions.
With GoodData, it's easy to embed dashboards and provide insights where your users need them. For example, a global fashion retailer used the platform to deploy e-commerce dashboards across 30+ regions. In doing so, the company improved coordination across markets, enabling faster, more informed decisions.
Ready to build dashboards that drive real results? Request a personalized demo today.
FAQs About E-commerce and Retail Dashboards
A retail dashboard provides a centralized view of key metrics (such as sales, customer behavior, and inventory), so businesses can make data-driven decisions quickly and efficiently.
Dashboards highlight trends, track KPIs, and reveal problem areas in real time, allowing e-commerce teams to optimize marketing, inventory, and customer experience.
Commonly tracked metrics include conversion rate, average order value, customer acquisition cost, inventory turnover, and customer lifetime value.
Yes. Executives, marketers, sales teams, and operations managers often need different views. Custom dashboards can be tailored to each role’s priorities.
Modern dashboard platforms connect to CRMs, marketing tools, e-commerce platforms, and data warehouses, pulling information into one place for unified reporting.
Real-time dashboards allow businesses to spot issues like low stock or underperforming campaigns immediately, so they can act before revenue is lost.
Even small businesses benefit from dashboards, as they simplify decision-making, reduce manual reporting, and help uncover opportunities for growth.


