Automatic Emailing of KPI Dashboards: Bringing Insights to Users Who Prefer Hard Copies


Why email data in the 21st century?
I’m willing to bet that you’ve experienced this: You’ve spent a lot of time implementing a solution, working in detail on the design with your UX team, fine-tuning the look and feel, and training users, only for adoption rates to fall short of your expectations.
Although proper usability testing like this can certainly help solutions become sticky and useful and hopefully lead to better adoption rates throughout your network, there will always be some users who struggle to open your solution and interact with it effectively. This also applies for the analytics, including your KPI Dashboard.
These users may not have the time to interact with your solution, they may be on the road frequently and rely on their phones to conduct business, or they may just struggle to learn to use new systems. Regardless, there will always be some users who prefer an email-based and sometimes a printed version of the data at a specific time, regardless of how elegantly designed your solution is. And to improve your adoption rates, you’ll need to make it easier for every user to access insights.
Why do some people benefit from email or paper-based reports?
While some people simply like to have their data printed and ready for a meeting to reference key points and make notes, there are scientific reasons to prefer a printed version as well. According to the Huffington Post and a Dartmouth study, there’s a difference when people read from a screen compared to when they read from a print-out. Reading from a paper version typically helps people understand abstract concepts, while reading from a computer screen helps them remember factual data.
Clearly, combining at-the-point-of-work insights and interactive dashboards with an “old-fashioned” paper or emailed report can help you get data to more users in a way that they can more easily understand. Whether they want the paper on a table for the board meeting or just want to check a report from their email on a business trip, having multiple ways to consume data makes your solution more accessible.
How can you send reports to your users with minimal overhead?
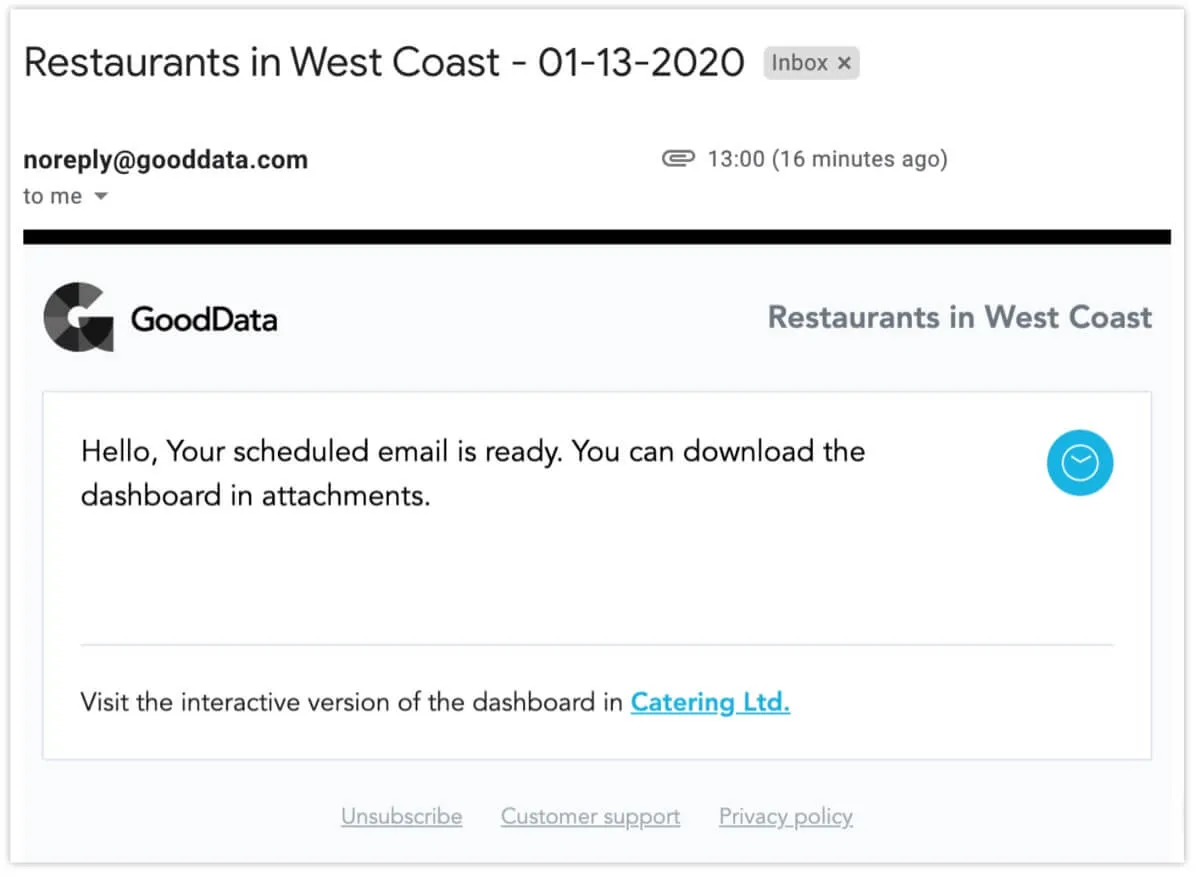
By automating the process of downloading and sending the report, you can ensure that insights are delivered at the right time to the right person in the right format. So how do you do so?
Set up the automated email within GoodData in the same way that you would when creating recurring meetings in your company calendar. First, open your KPI dashboard, navigate to “Schedule emailing,” then fill in the recipients, subject, message, and schedule.
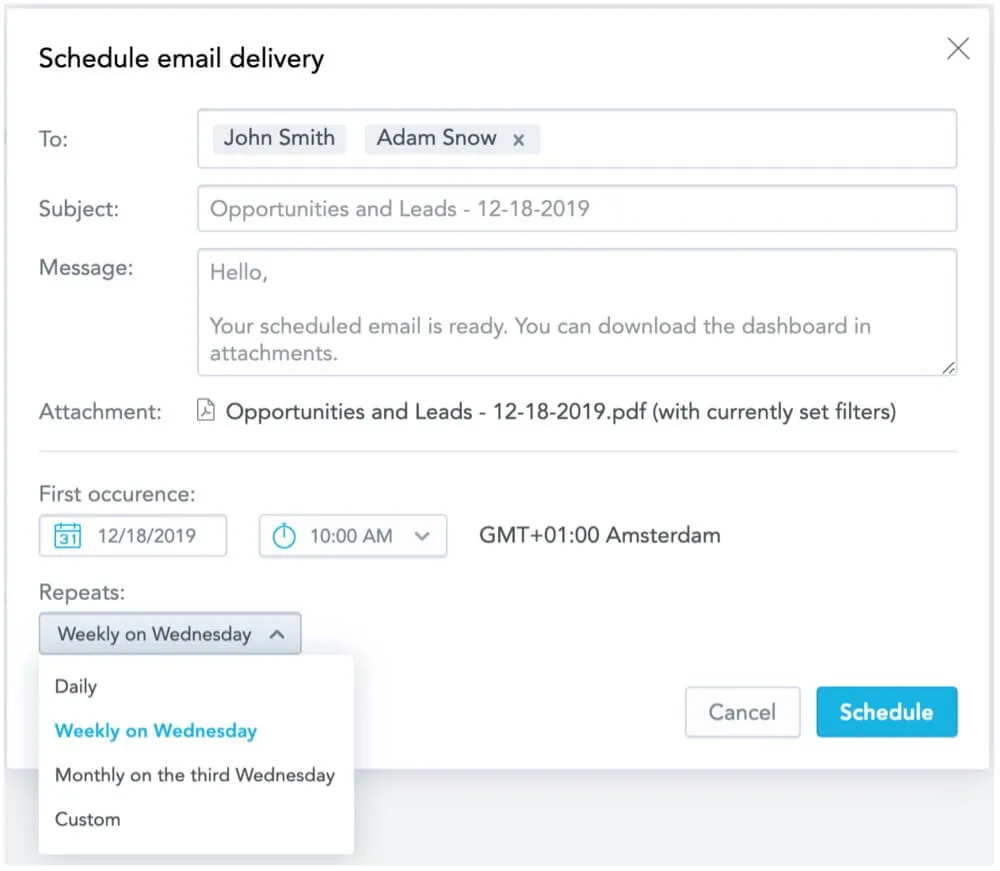
To make it easier to manage these reports, you as the administrator will be able to see all currently scheduled emails within one simple user interface.
Do you want to learn more about GoodData’s KPI Dashboards and how can they help your organization achieve better adoption rates when it comes to your company insights?

