Analytics for the Modern World - Part 2: How Complex Data Creates Challenges for Analytics
3 min read | Published


This is Part 2 of a 3 part series on complex data and analytics. In Part 1 we learned how to recognize complex data relationships, especially a certain type of relationship called many-to-many, and why it is useful.
This time, we will examine how complex data can make analysis difficult for both business users and analytics experts alike.
In Part 3, we will look at how to embrace the ’new normal’ of modern data complexity and make analytics even more relevant and accessible to everyone.
A difference in mindset, and data models
The marketing example we used last time had a many-to-many (M:N) relationship between campaigns and tags. “Many-to-many” might sound promiscuous and wild, but the underlying data itself is fairly conventional. If we look at a simplified version of the actual tables they might look like this:
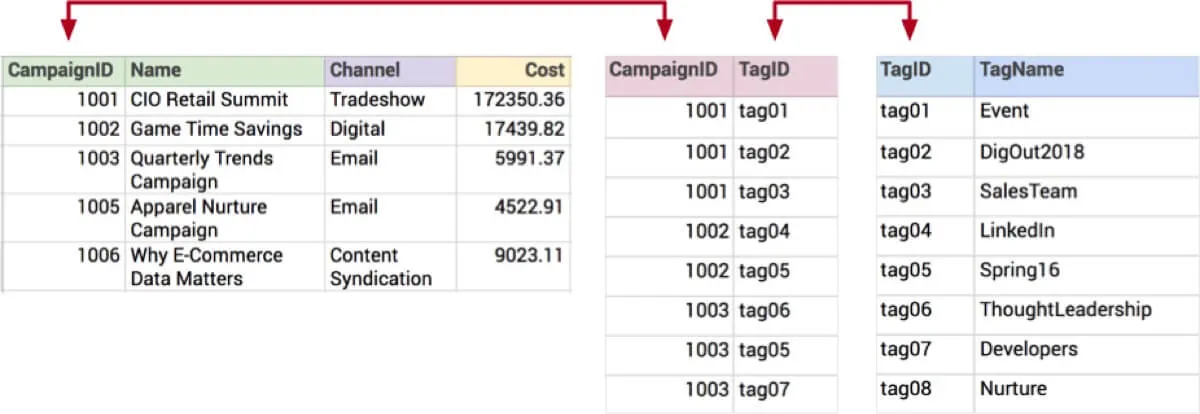
Notice the common values linking campaigns and tags together via the central table. This is called a bridge or intersection table, and it actually implements the many-to-many relationship. Neat, huh? This structure is typical of the relational model, and is one way that applications can store data.
The thing to understand is that this way of organizing data is fundamentally incompatible with the dimensional model, which is a different way of organizing data that is used by most all analytics systems.
The dimensional model is optimized for speed. It presents quantifiable measurements around a single topic (facts) that can be sliced and diced across different facets (dimensions). Does this sound familiar?
To be a little more concrete, let’s look at a diagram of a typical dimensional model:
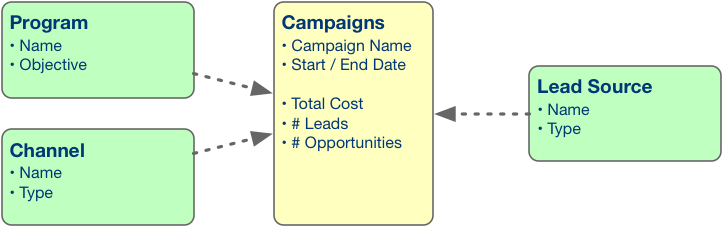
The model shows the topic we want to report on (Campaigns) and its facts (Total Cost, # Leads, # Opportunities), and the ways we want to slice and dice those facts (by Program, by Channel, and by Lead Source).
The good, the bad, and the ugly
This way of doing things (dimensional modeling) has been around since the 1990s, and helps us achieve great speed in slicing and dicing, filtering, drilling up/down and generally answering business questions.
However, the dimensional model does not handle today’s complex data very well. This is because in order to convert the relational model with its complex relationships to a dimensional model, we have to simplify it. The very detailed transactional data from an application system is combined and ‘squashed’ into a single summarized data set and we lose the original relationships.
This ultimately leads to less usability for business users and thus less usage of analytics, inflexibility, and performance issues. Let’s see how.
Workarounds
Unfortunately, most of the advice from analytics vendors about how to handle many-to-many data is to avoid, eliminate, work-around or mitigate it.
It is true that an analytics expert will use various techniques to address this difficult problem, but each workaround adds complexity and brings its own set of issues.
For example, one of the business questions from Part 1 was to find the total campaign costs per marketing program. One technique is to pre-compute the answers into a new dataset:
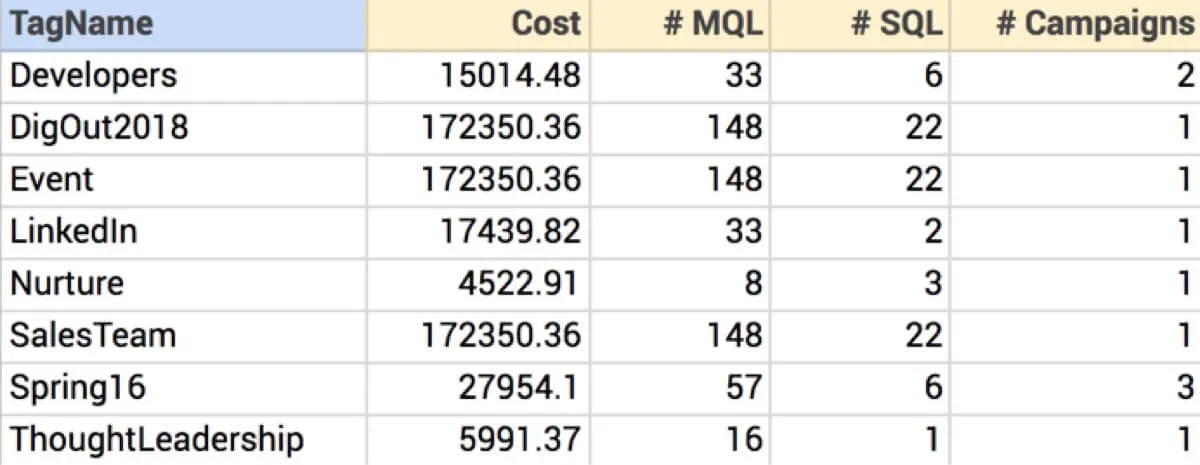
Now we can answer our business questions, but there are drawbacks:
- Transactional datasets are often huge, and this method takes time and extra storage. It can take a lot of computing resources to do this multiple times per day.
- The result is inflexible. Business users can only ask questions that are supported by the model. If we want to report on campaign costs by fiscal month, we need an analytics expert to prepare another summary. If we want to report on campaigns by geographic region or product line — you guessed it, we need another summary. We can’t ask ad-hoc questions as they occur to us, and we can’t easily relate this data to other data.
- This method will result in many different data sets, and the business user must be knowledgeable enough to pair the question to the correct data set.
There are other work-arounds involving custom code and complex computed columns, but they are generally very high effort, are equally inflexible, and tend to kill performance.
Obviously, we need a better way.
In the next part of this blog series on analytics and complex data, we will see that “support” for M:N isn’t always what it seems, and show how extensions to the analytic model can tame data complexity while keeping things simple for business users.


