
Particularly for business (non-technical) users, allowing them to see just the information they need is key in aiding efficient decision making and drawing concrete conclusions from the data. Two of our latest feature updates help users to better filter the information they see, both within the Analytical Designer as well as within KPI Dashboards. So, lets dig into what these new features are and how they can help your end-users better utilize the data available to them.
Ranking filter in the Analytical Designer
The Ranking filter gives users the option to narrow down the scope of an insight, allowing them to see just the values that are important to them, in only a few clicks.
Why is this feature helpful? Let’s take a look at an example scenario and how it can help you achieve more.
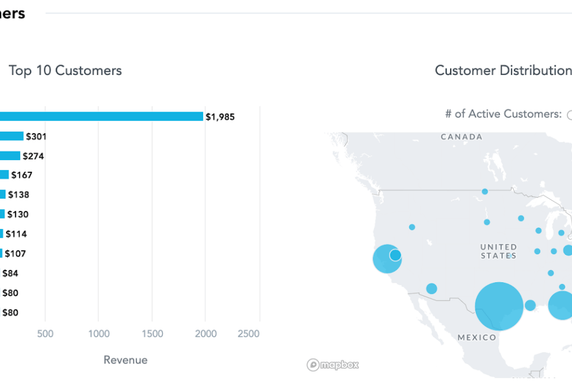
An obvious, yet impactful use would be when viewing sales figures for a list of nationwide salespeople. If the VP of Sales wants to see the best performing, and worst performing, team members, in order to both reward performance as well as drive numbers in the team’s weaker areas, the Ranking filter is the perfect tool. It’ll let the VP see just the top X values and bottom X values, omitting those that aren’t relevant. By doing so, they get to see a clear overview of who needs help to achieve their monthly targets, who is on track to deliver their numbers and who could potentially aid those that are lagging behind.
Below is a short step-by-step demonstration of how to use the Ranking filter within the Analytical Designer.
Dependent attribute filters
Being able to filter via multiple parameters is often very helpful in letting users see different views of the data they’re working with. The flip side of this, however, is that sometimes, all these options can become overwhelming to the non-technical end user, leaving them frustrated as to why they can’t see the insight they’re looking for.
This is where dependent attribute filters make working with KPI Dashboards that bit more intuitive.
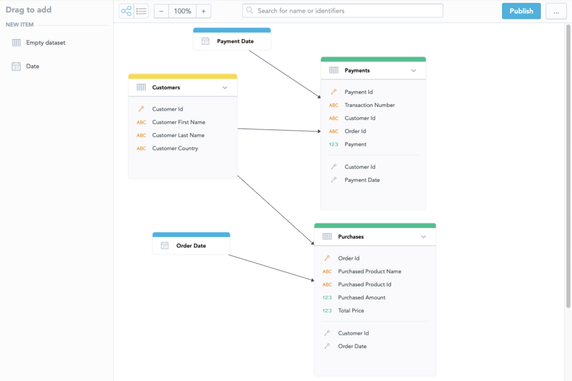
If the dashboard contains multiple related attribute filters, it is now possible to define parent/child relationships between them. The filter settings of a parent filter then limits the user to only seeing the child filters that correspond to it. This not only narrows down the number options, removing the possibility of the user being overwhelmed, but also avoids the instance of different filters negating one another and, therefore, the resulting blank page with no insights.
See the demo below for a short step-by-step guide to dependent attribute filtering.
Do you want to try it for yourself? Sign up for our free trial and start building insights for your teams or your customers today!
Already using GoodData and want to learn more about how filtering capabilities can further drive analytics adoption in your organization? Check out our documentation for developers or get in touch with our team.
Experience GoodData in Action
Discover how our platform brings data, analytics, and AI together — through interactive product walkthroughs.
Explore product tours