4 Ways to Ensure Successful Data Modeling in Big Data Projects
6 min read | Published

Regardless of your organization type or whether you’re starting internal company reporting, rolling out enterprise reporting for your business partners, or creating a SaaS application for your customers, data modeling is an essential part of delivering your analytics project.
Once you’ve completed your research and UX design, decided how the final application should look, and know at which point in their workflows users will interact with the data, you can begin to set up your data pipeline and prepare the data model. The data model forms the base of your semantic layer, which in turn helps your users understand the insights that the underlying data provides.
However, creating the data model can be challenging. In particular, ensuring that teams communicate effectively during the data modeling process can be especially tricky. In our experience, we’ve found that these are four key ways to make the data modeling process much easier.
1. Make It Easier to Connect to Data
Problem
Those of you who are familiar with the old way of connecting data know how complex that process was. You had to understand how the API worked and define all the API calls that you needed to connect your data—a time-consuming and difficult process that often led to technical issues and frustration.
These challenges are compounded as access to analytics expands. For example, let’s say your company invested in a new cloud data warehouse. They’re already using this warehouse as the data source for internal analytics, but now your company has decided to deliver analytics to all their business partners or customers. The data engineer would be overwhelmed with requirements now and will need some kind of automation.
Solution
Integrating data into an analytics platform should be as smooth as possible so teams can focus their time on analyzing data, instead of on connecting to it. With an automated connection to the cloud data warehouse, you can define the model from the output stage, or you can define it first and then generate SQL script to transform the output stage in your cloud data warehouse.
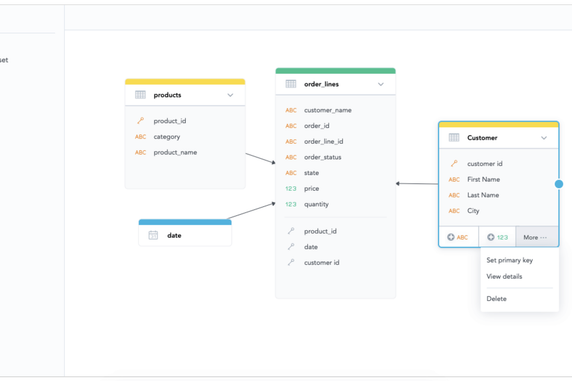
With something like the GoodData Data Source Manager, the data engineer can connect to the cloud data warehouse and allow the analytics platform to scan the tables and views that the data engineer has already created for her current analytics solution. Based on that, the GoodData platform then proposes how the data model should look. This is a huge help to the data engineer, as she does not have to create the data model from scratch. She can simply reuse what is already working and use the data model we suggested to her.
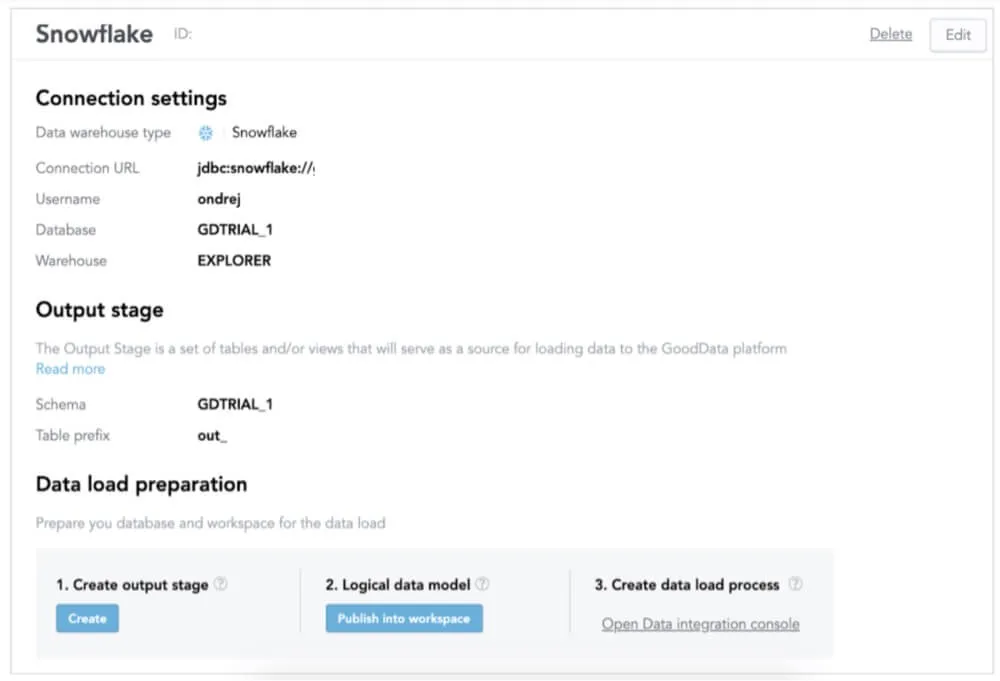
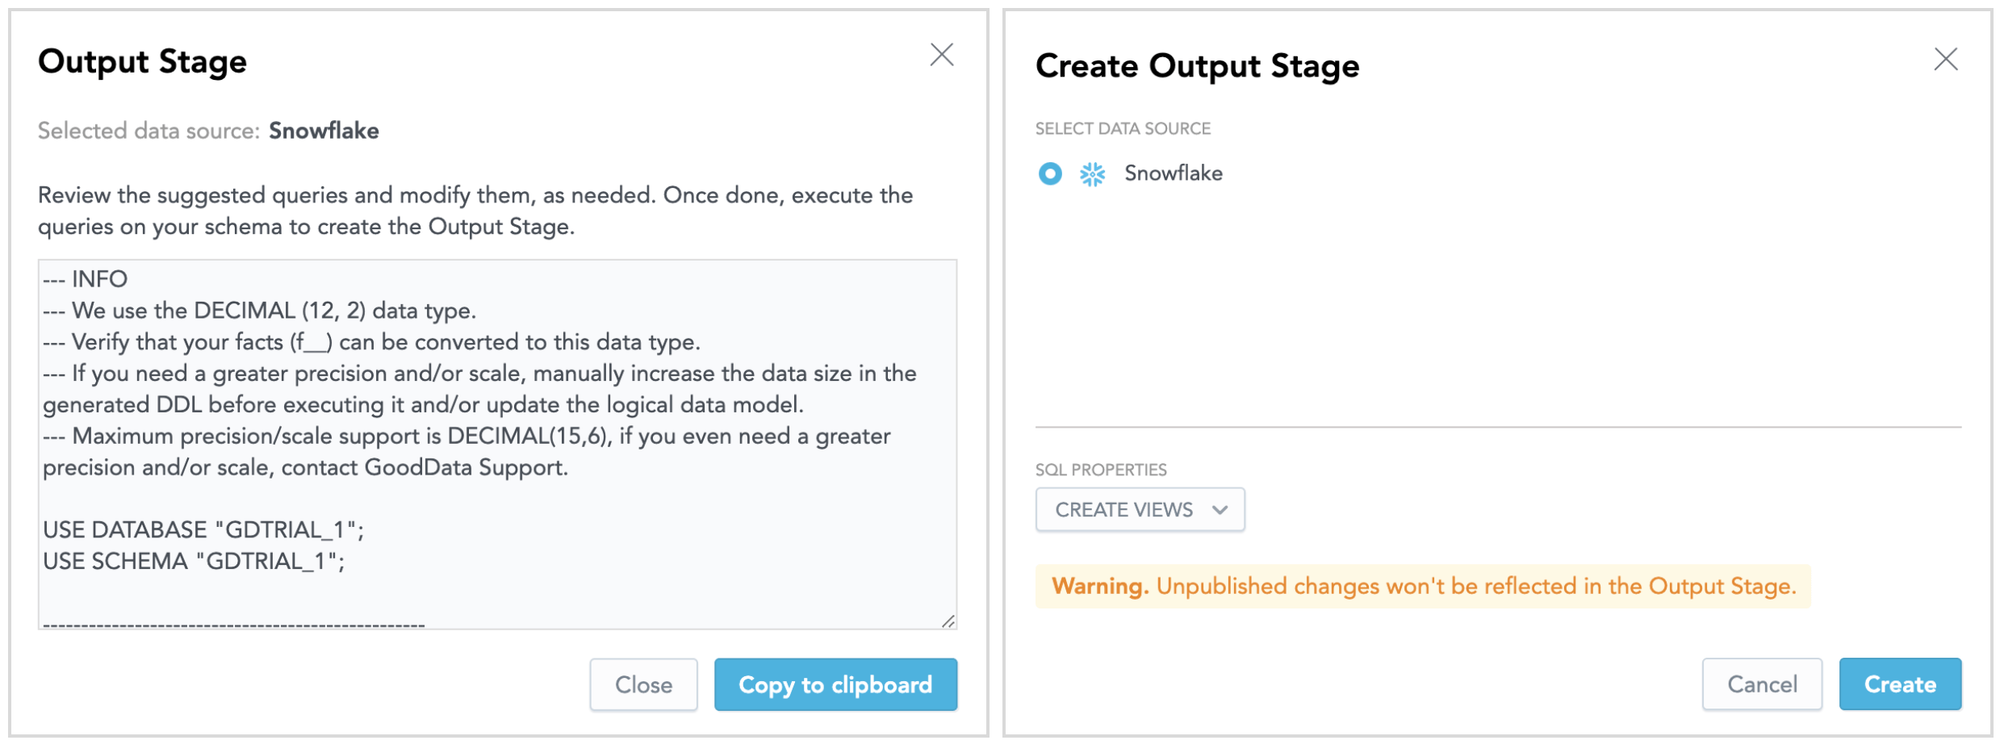
After connecting to the cloud data warehouse, our data engineer has to define the output stage to tell the GoodData platform which tables or views should be used. As you can see, the platform has already created the output stage code for the data engineer, so all that’s left for her to do is copy this SQL definition and execute it in the cloud data warehouse.
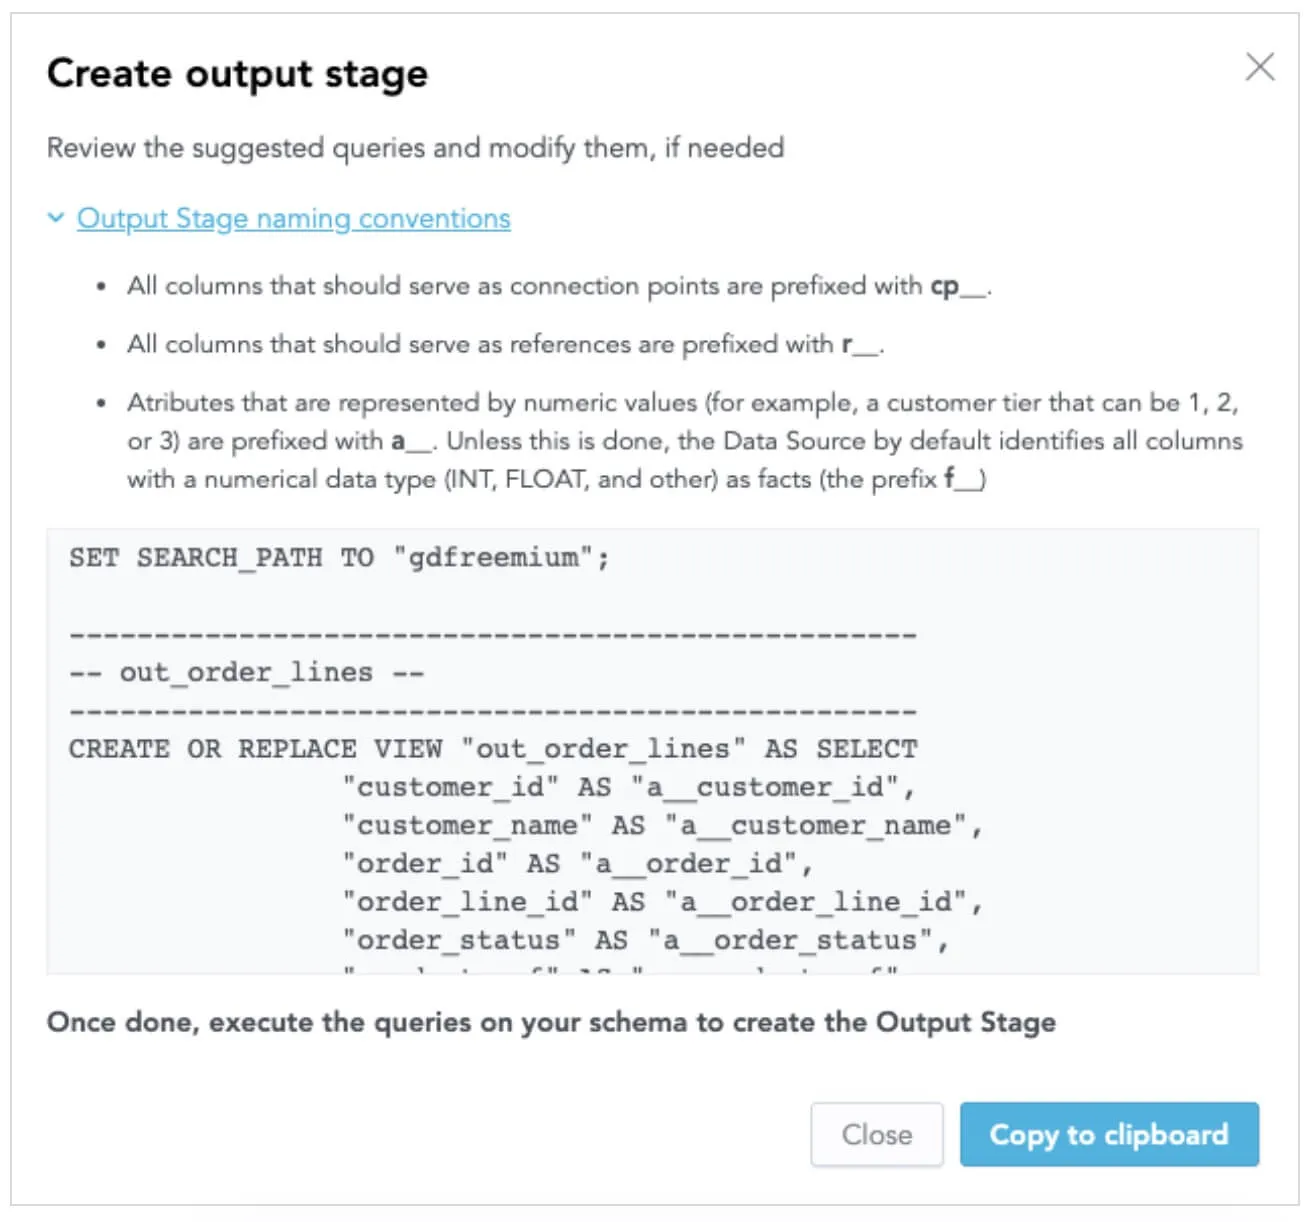
Notice how easy that is. We just generate the SQL definition, and our data engineer copies it to the cloud data warehouse interface. If she needs to, she can make any optional changes to the snippet.
Experience GoodData in Action
Discover how our platform brings data, analytics, and AI together — through interactive product walkthroughs.
Explore product tours2. Focus On Alignment Between Data-Related Roles
Problem
Before actually building dashboards and reports, those in data-related roles—namely data engineers working with physical data and data analysts figuring out how to model and interpret that data—need to determine the best way forward. The physical columns of source data within the data warehouse are often too complicated for the average business user to understand how they relate to each other, so the data analyst must build a layer that translates the raw data from the data warehouse into a structure comprehensible by business users.
This can be demanding work, not only when creating a new model from scratch but also when editing the existing one. Let’s say that the data analyst discovers that the original logical data model does not meet her needs. She knows that her client is trying to analyze product sales, and she knows that they can now see how many products were sold, which customers have bought the products and the total price. However, her client still needs information about a customer’s location.
Typically, to solve this issue, the data analyst would have to go to the data engineer, describe her requirements and how she needs the new data model to look, and then wait for the data engineer to update the source data. This may sound like a simple task, but it’s often time-consuming—requiring the data engineer to sift through data in the data warehouse, the analyst to verify the new model, and both parties to coordinate this work amid other priorities. During this time, business users are waiting to access valuable new insights.
Solution
How can we streamline the collaboration between data engineers and analysts so that business users can access insights faster? How can a data analyst, who does not have deep knowledge of data warehousing, simply update the data model without needing to wait for the data engineer?
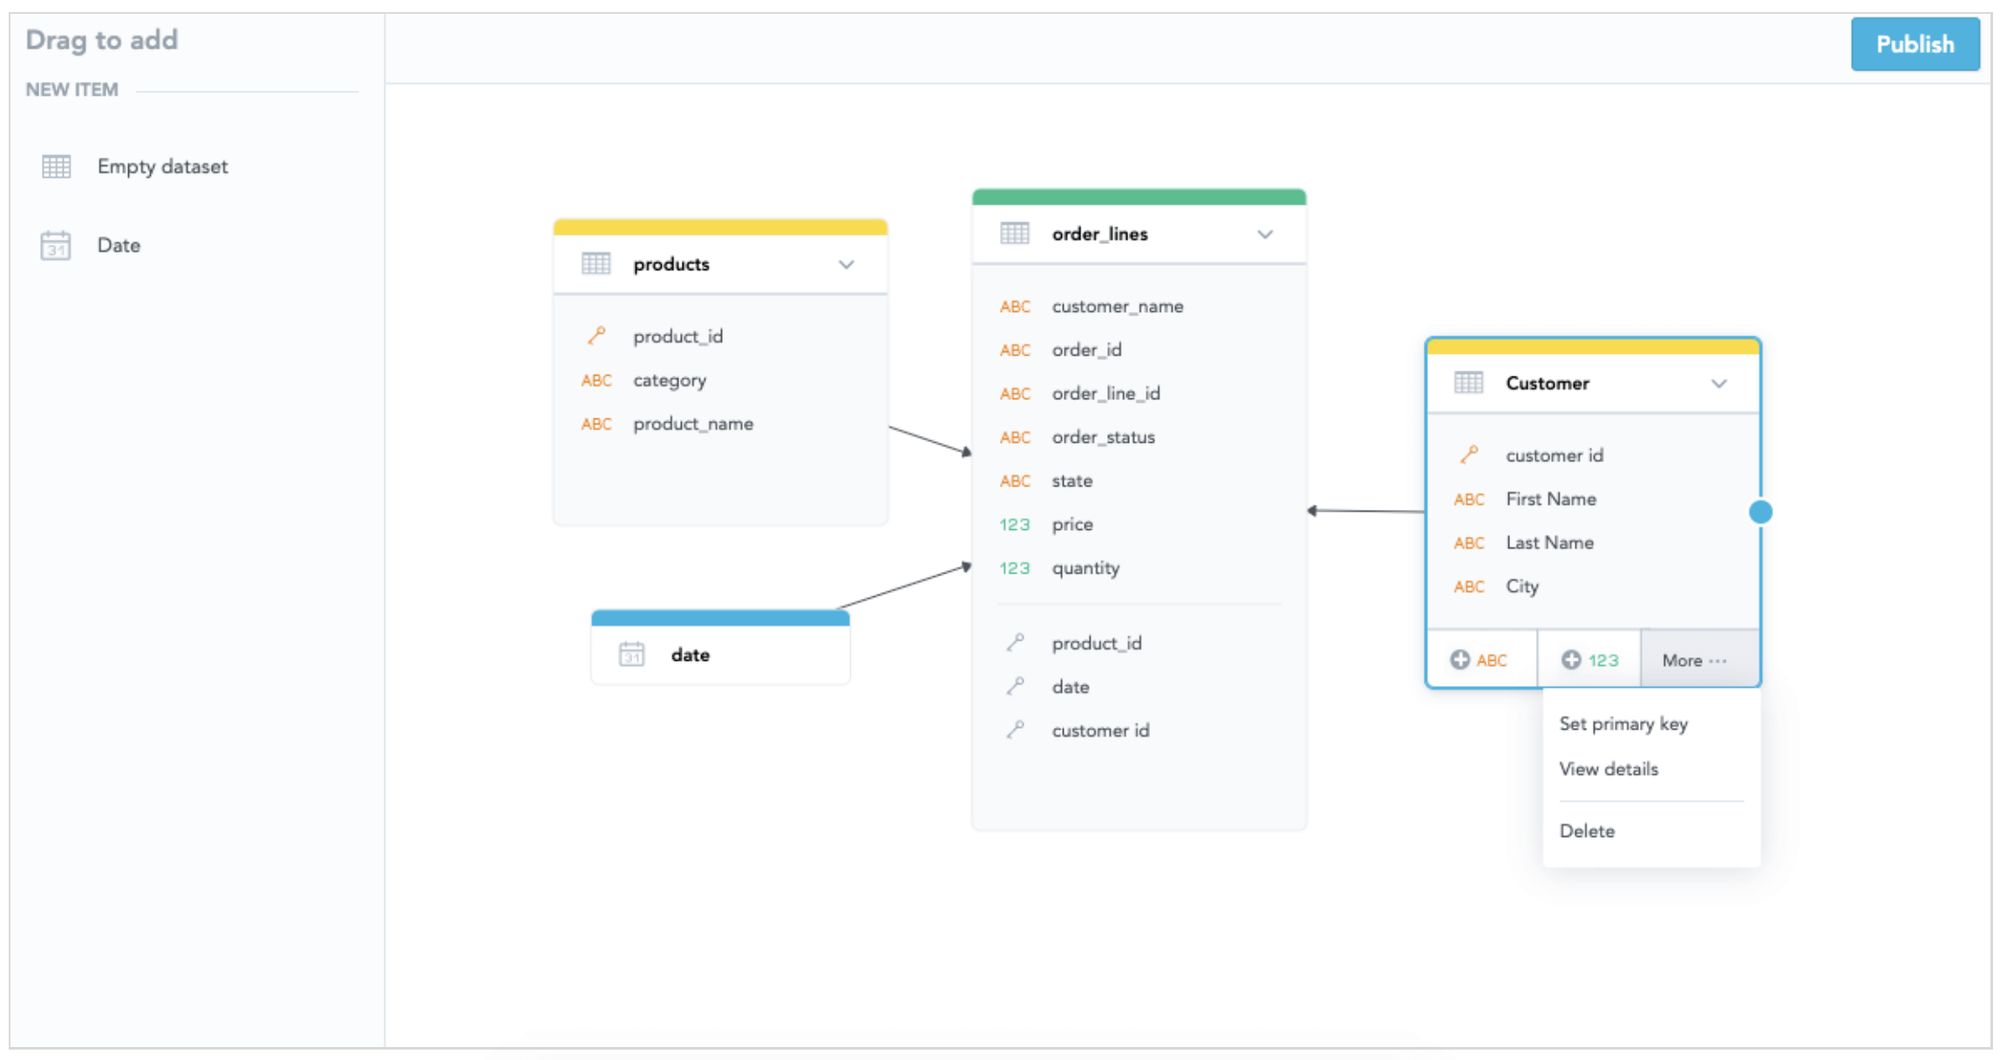
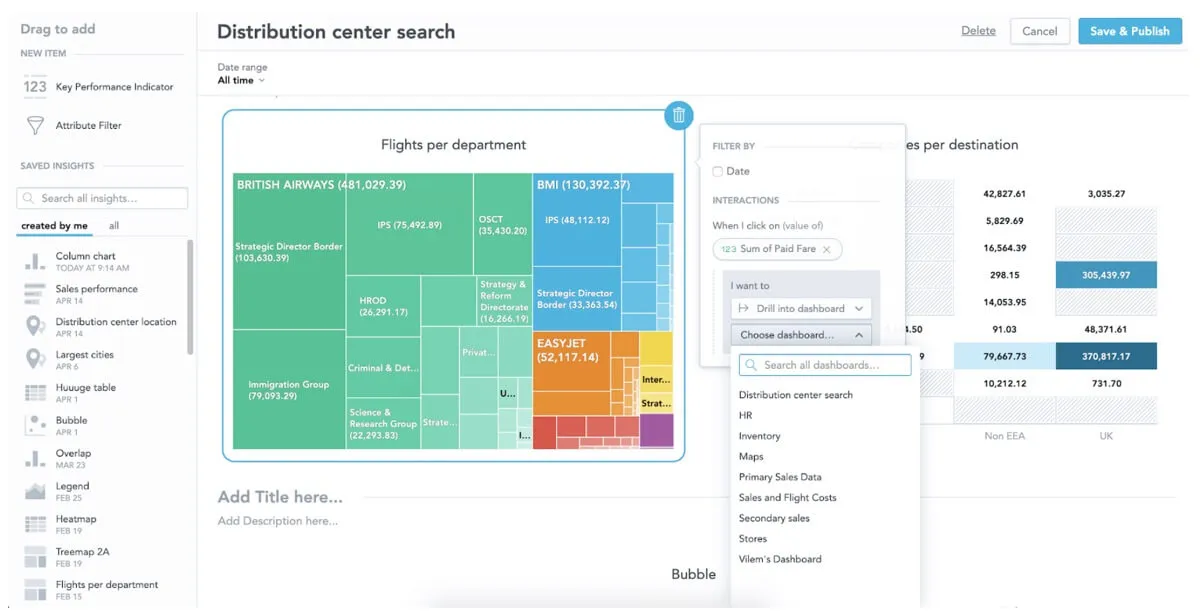
The new web-based LDM modeler brings drag-and-drop functionality to data analysts and allows them to communicate and easily explain the data model to the rest of the team. This is all integrated into a single interface where data engineers, data analysts, and business users work together.
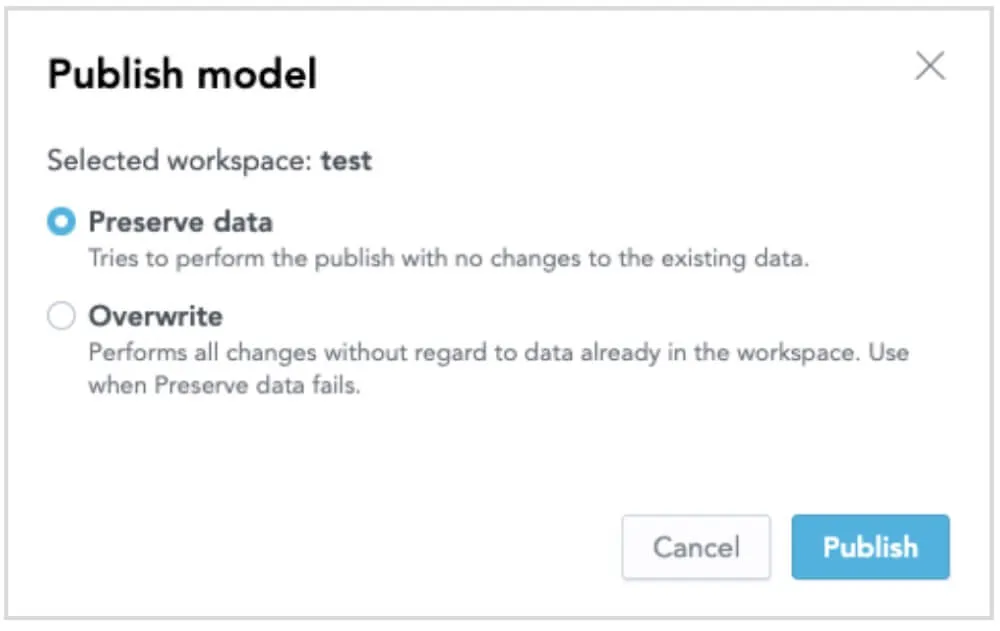
Let’s go back to our example of editing the model to access customer location in the insights. At that point, the data analyst can create a new dataset in the model and define relationships between datasets and publish the data model into the workspace of her choice. Once she is done publishing the data model into the workspace, she has to make sure that the GoodData platform will receive the information about the location, which she defined in the updated data model. She can simply create the output stage definition right inside the GoodData platform without needing to understand the SQL code. All she has to do is copy the code, forward it to the data engineer, and let the data engineer update the output stage in the cloud data warehouse.
By making it easier for data engineers and data analysts to collaborate, you can ultimately reduce the time to market and begin rolling out the solution to business users.
3. Automate Data Distribution and Change Management
Problem
The process of keeping your data fresh and managing change is never-ending. There’s always another issue that needs to be fixed, a report that needs to be adjusted or report definitions that need to be rewritten, or just a regular data update that needs to be performed. Multiply these needs for hundreds of business partners—each of which may have thousands of users—and things can quickly get out of hand. For there to be any feasible way to handle these changes, this process must in some way be automated.
Solution
You already have data connections to your cloud data warehouse. You also already have your data model updated based on your interactions with business users, and you’ve easily communicated this to your data engineers within the GoodData platform. Now you need to roll out your project to your business partners or customers so that they can make better decisions.
With GoodData, you can automate data distribution to private workspaces dedicated to each of your customers. GoodData organizes analytical data of your customers into customer-specific workspaces in a secure way that meets all compliance standards, a process that enables per-customer customizability and access controls so you can manage new releases and individual feature rollouts.
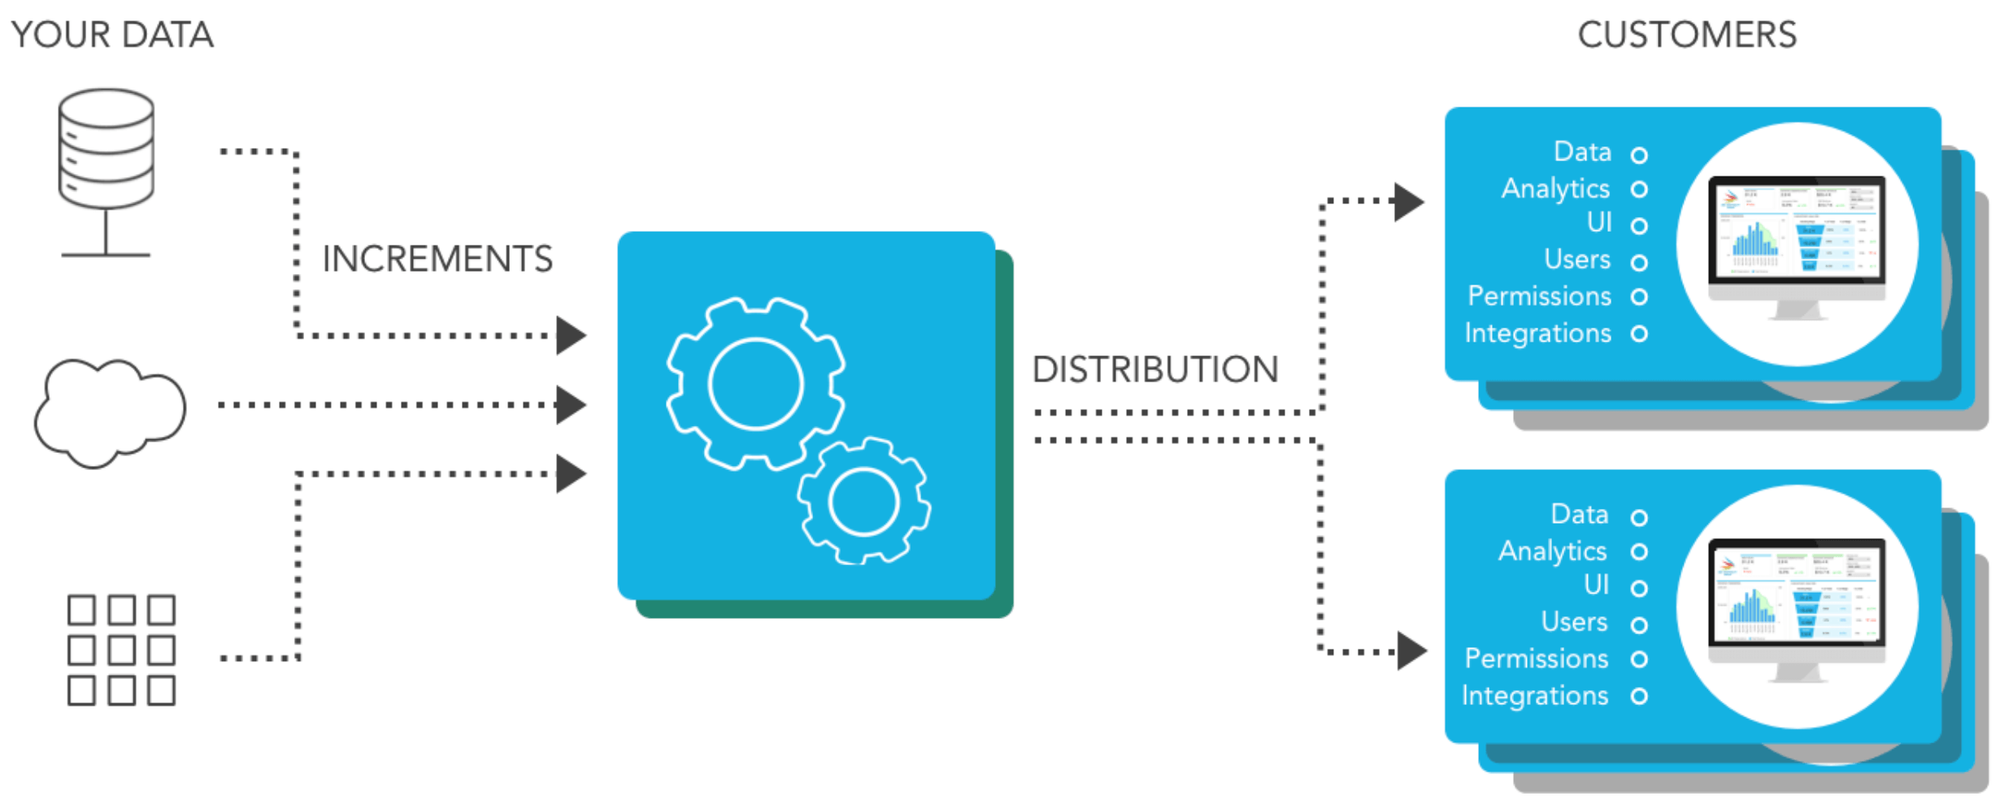
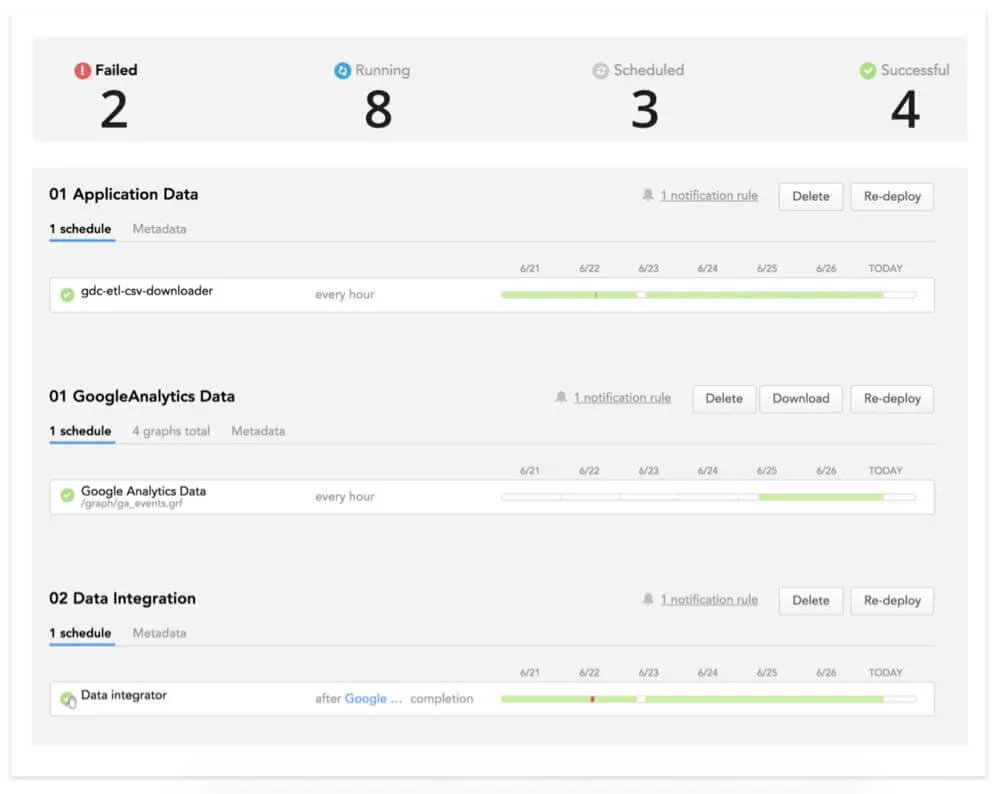
An automated distribution service efficiently pushes the changes from your retrieved data into thousands of customer workspaces. Then, you can schedule data ingestion tasks, invoke tasks by API, or set them up from the administration user interface. To keep tabs on changes or how data is distributed, you can set up failure alerts via e-mail or integrate alerts with third-party services like PagerDuty. Instead of having a team to manage the operation of the entire solution, which serves thousands of customers, GoodData allows you to set up, manage, and control the whole process in a single cloud-based platform.
4. Focus on the Insights the Data Brings, Not on the Data Itself
Problem
Your company needs to keep your data products and whole analytical solution consistent. The last thing you want is for one department to have different results than another, or for a user to perform improper analysis using data that isn’t related. Multiply this risk across hundreds, thousands, or tens of thousands of users, and it’s clear that you need to provide users with some form of guidance to help them create insights. You also need to be sure that there’s a single source of truth provided by the analytics platform.
Solution
Relationships and metrics are key elements in GoodData’s semantic layer. With a shared data model, business users in different entities get consistent results wherever they are, which support the single version of truth provided by analytics. They can also understand what data is related and use it effectively to draw their own insights and conclusions.
Metrics are created using a modern, easy-to-use tool that guides you through the process, so users don’t have to worry if they don’t exactly have deep BI or analytics experience. Self-service capabilities allow everyone to benefit from analytics, without the need to involve developers.
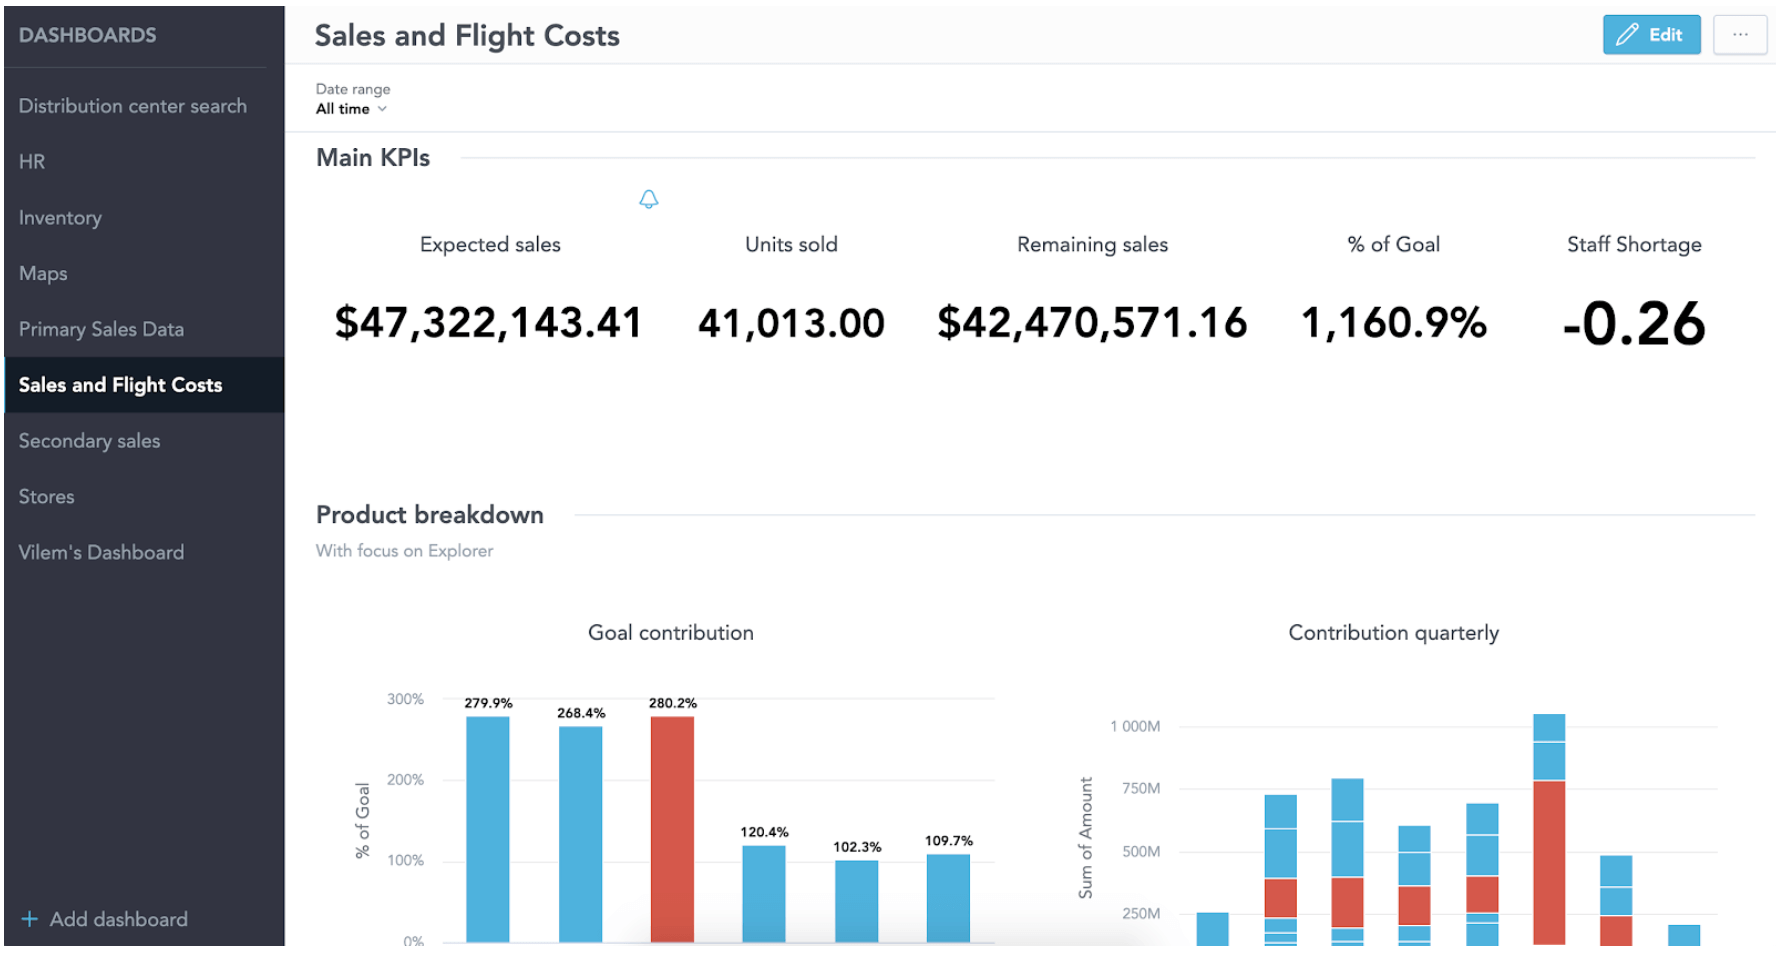
GoodData’s Analytical Designer is a best-in-class data discovery tool that allows you to work with metrics and attributes and create different views of the data. It offers multiple visualization types, so no matter what you are trying to visualize, GoodData will help you to convey the message in the best possible way. Users can also use Analytical Designer to create visualizations that can be used in dashboards or embedded in the application.
Thanks to the logical data model, GoodData also allows business analysts to work with augmented analytics by allowing them to work only with relevant data for their insights and suggests next steps for their analytical projects. Should a user discover that these insights aren’t needed at a particular point in their workflow, they can also schedule automatic report delivery by scheduling emails.
Interested in trying it for yourself? Sign up for the free GoodData trial and start building your insights today!
Experience GoodData in Action
Discover how our platform brings data, analytics, and AI together — through interactive product walkthroughs.
Explore product tours