GoodData Plugins #1: Dashboard Description
4 min read | Published

GoodData Dashboard plugins offer developers an opportunity to customize GoodData Dashboards according to their individual needs or business goals. If you want to develop your own plugin, check the tutorial.
Note: Interested in the second article in this series covering our Gauge Chart plugin? Read it here.
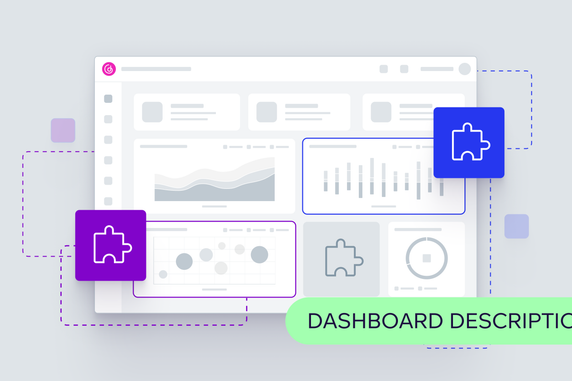
This article describes the Dashboard Description plugin, which has already been created. The plugin adds a textual description on top of the dashboard to which it is applied. The description text is loaded from a separate JSON file, so you can reuse the same plugin across different dashboards and simply provide a different URL to the JSON file when linking the plugin to the dashboard.

You can format the description text with markdown and even inject live metrics into it. The metrics will respect the global dashboard filters. This means that the metrics will update, whenever a filter is changed. To inject a metric, simply use inline code with a specific syntax: metric:
{
    "liveMetrics": {
        "sectionIndex": 0,
        "sectionTitle": "Description sample: Live metrics sample",
        "description": "*Total Sales are `metric:total_sales`", <-- inline code with metric
        "metrics": { <-- metrics section
            "total_sales": {
                "identifier": "totalsales"
            }
        },
        "dateDataSet": {
            "identifier": "sales.dataset.dt"
        }
    }
}
See the whole example of the configuration in texts.json file. If you use Export Catalog, you can find all metrics, attributes, and datasets in exported JSON.
Create Your Dashboard Description Plugin
If you want to create your own dashboard description plugin, below are the steps on how you can do it.
Step 1: Clone dashboard-plugin-examples repository
git clone https://github.com/gooddata/gooddata-dashboard-plugins.git
Step 2: Navigate to dashboard-description-plugin
cd dashboard-description-plugin
Step 3: Set environment variables
Make sure you have your .env and .env.secrets files with correct values. After you clone the repository, you will see a .env.secrets.template file in the dashboard-description-plugin folder. You need to remove “template” from the filename in order to set up everything correctly.
For .env, you will need to define four variables:
# GoodData backend (code name)
BACKEND_TYPE=tiger

# GoodData host
BACKEND_URL=

# GoodData workspace id
WORKSPACE=

# GoodData dashboard id
DASHBOARD_ID=
If you open a GoodData dashboard, you can find the BACKEND_URL, WORKSPACE_ID, and the DASHBOARD_ID in the URL:
https://<BACKEND_URL>/dashboards/#/workspace/
For .env.secrets, you will need only one variable:
# GoodData API token
TIGER_API_TOKEN=
Check Create an API token documentation for more information.
Step 4: Check dependencies
Make sure that dependencies in the package.json file are aligned with the version of the SDK dashboard component you use in your project (if you are embedding the dashboards with the GoodData SDK).
{
  ...
  "@gooddata/sdk-ui-dashboard": "^9.2.0" <-- must match in the plugin and your project
  ...
}
Step 5: Build a production version
Build a production version of the plugin with command npm run build-plugin, or yarn build-plugin. If you have this plugin already built, first delete the dist folder.
Step 6: Upload the built plugin
Upload built plugin to your hosting. GoodData does not provide hosting for your plugin builds. When you build your plugin, you will have to host it yourself in a publicly available location that supports HTTPS.
Also, make sure the hosting of your plugin is included in the allowed plugin hosts by CSP Policy (documentation).
Step 7: Create plugin metadata object
Create a plugin metadata object with npm run add-plugin or yarn add-plugin commands. For more information, run the npm run add-plugin –help, or yarn add-plugin --help command.
Copy the plugin object-id noted in the console output.
Step 8: Link the plugin to the dashboard
Run npm run link-plugin --
This will open the text editor where you can paste a Configuration JSON file with a link to a file with a Texts JSON file, and optionally IDs and positions of texts if you want to show only certain texts on a particular dashboard.
Configuration JSON file
Configuration JSON is an object that is passed to the plugin as a parameter when linking the plugin with a dashboard.
{
    url: "https://www.myHosting.com/texts.json",
    texts: {
        description1: 0,
        description3: 2,
    }
}
- url: MANDATORY, a link to publicly accessible JSON file with texts definition(s).
- texts: OPTIONAL, key-value pairs of text IDs (keys in Texts JSON) with a number describing section index where to add the section with text on the dashboard. If the texts field is omitted, all texts from the texts.json will be shown in the dashboard.
texts.json file
The texts.json is a publicly accessible file with text definitions. It contains key-value pairs with textIDs as keys and description text definitions as values.
{
    "description1": {
        "description": "Text with the live *metric*: `metric:my_metric_1`",
        "metrics": {
            "my_metric_1": {
                "identifier": "mymetric1"
            }
        },
        "sectionIndex": 1,
        "sectionTitle": "Dashboard description",
        "grid": {
            "width": 6,
            "height": 2
        },
        "wrap": false
    },
    "description2": {
        "description": "A valid description with the only **MANDATORY** field, *description*"
    },
    "description3": {
        "description": "Another description with the **OPTIONAL** Section title",
        "sectionTitle": "Description 3 section title"
    }
}
The texts.json is a publicly accessible file with text definitions. It contains key-value pairs with textIDs as keys and description text definitions as values.
- description: MANDATORY, the own text of the description in the markdown format.
- metrics: OPTIONAL, key-value pairs of metrics used in the description text. The value should be an object reference to the metric.
- dateDataSet: OPTIONAL, provided when using live metrics. It is needed so that live metrics would respect the date filters of your dashboard.
- sectionIndex: OPTIONAL, defaults to 0. Each description will add a new section to the dashboard. This is the indexed position(starting from 0) of the section within the dashboard.
- sectionTitle: OPTIONAL, the title of the section with the description. If left out, the section will be added without a title.
- grid: OPTIONAL, on objects with width and height properties. Both are expecting number values. The width should be a number between 1 and 12 and represents the width of the text ingrid columns. The height defines the height of the description in grid rows. Defaults to { width: 12, height: 1 }.
Once the plugin is linked to the dashboard, it will become visible on your dashboard, and you can start using it!
Give It a Try
If you want to try dashboard plugins, check out our free trial. If you would like to discuss dashboard plugins, or whatever you have on your mind, reach out to us on our community Slack.
Experience GoodData in Action
Discover how our platform brings data, analytics, and AI together — through interactive product walkthroughs.
Explore product tours