5 Reasons to Try Analytics as Code
Written by Tomáš Muchka |

In my article 5 Reasons Why to Write Your Semantic Layer in YAML I expressed my ideas about writing a semantic layer in YAML.
This time, I want to expand on the idea of using YAML for analytics. I want to envision what an analytics interface focused on Analytics Engineers should look like.
Here are my five reasons why I believe we are on the right track with Analytics as Code:
1. It feels familiar
Ok, this is kind of a no-brainer, but let’s think about it for a second. These days, most BI/analytics interfaces follow the drag & drop paradigm, but is this really the best interface for Analytics Engineers?
According to dbt, who introduced the term Analytics Engineers, these people seek to:
- Provide clean data sets to end users, modeling data in a way that empowers end users to answer their questions
- Apply software engineering best practices like version control and continuous integration to the analytics code base
That definitely does not sound like a drag-and-drop type of person. This is confirmed also by our own experience and research. These people are more familiar with IDE-type tools. They prefer clarity and productivity over astonishing animations and eye-candy effects.
2. It provides a unified user experience
Nowadays, analytics/BI tools rely on a layered abstraction model. This is in core, a good idea and it reminds me of the OSI communication model with its physical, network, presentation, and application layer.
However, even a good idea can quickly become a nightmare when each layer has its unique user interface, and a single person uses all of them. Such jacks-of-all-trades are Analytics Engineers. They work with data, data models, metrics, and sometimes even data visualizations.
Current BI platforms offer completely different interfaces for each of these layers. Let’s take Tableau as an example:
- There is a list-style UI for the management of workbooks and projects.
- Then there is a UI for data preparation and modeling.
- Then a visualization builder UI.
- Then a dashboard builder UI.
If you would like to check it for yourself, take a look at Tableau’s Get Started with Web Authoring guide for creators.
All of these interfaces heavily utilize drag & drop, yet at the same time all of them look and feel quite different. I feel sorry for everyone who has to switch back and forth between these interfaces in a rapid manner.
But what would such a unified experience look like? Would it be possible to keep the layered approach while having a unified user experience? Of course, that’s what software developers are used to anyway. Again, they use IDEs which literally means integrated development environment.

3. It is understandable at first glance
So now we have appropriate tooling (IDE) that feels familiar and provides a unified experience. However, we shouldn’t stop there. To make the experience truly smooth and unified, we need to focus on how to declare each of the analytics layers.
Fortunately, I have already done some work in my other article 5 Reasons Why to Write Your Semantic Layer in YAML.
Now let’s check a few examples on a real-life analytics project I have prepared for an Analytic as code webinar. The project maps some basic statistics about the famous movie character James Bond.
Data model (semantic layer)
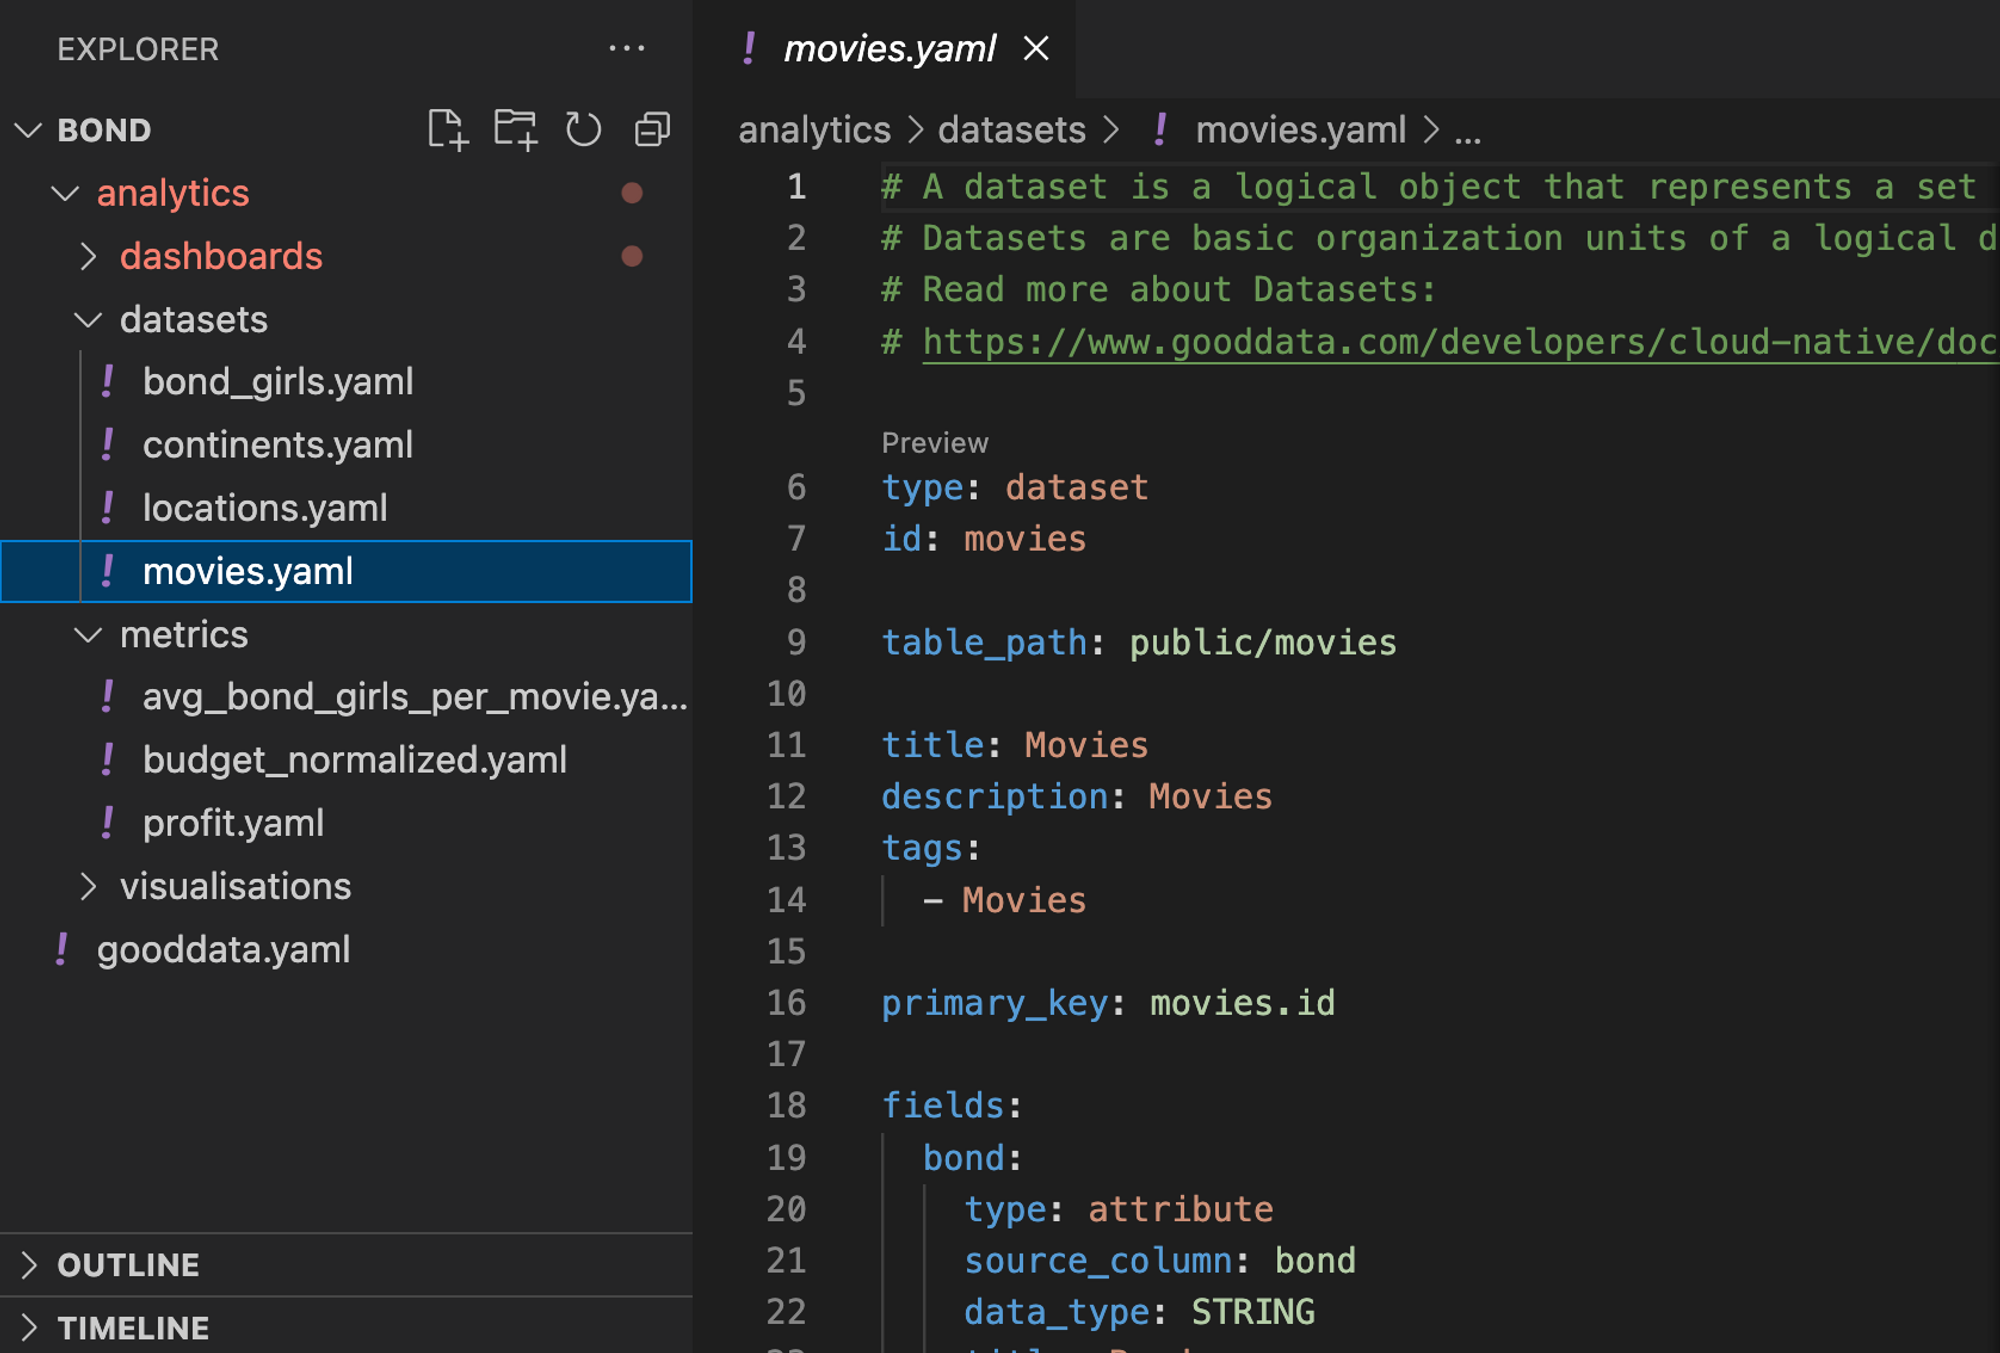
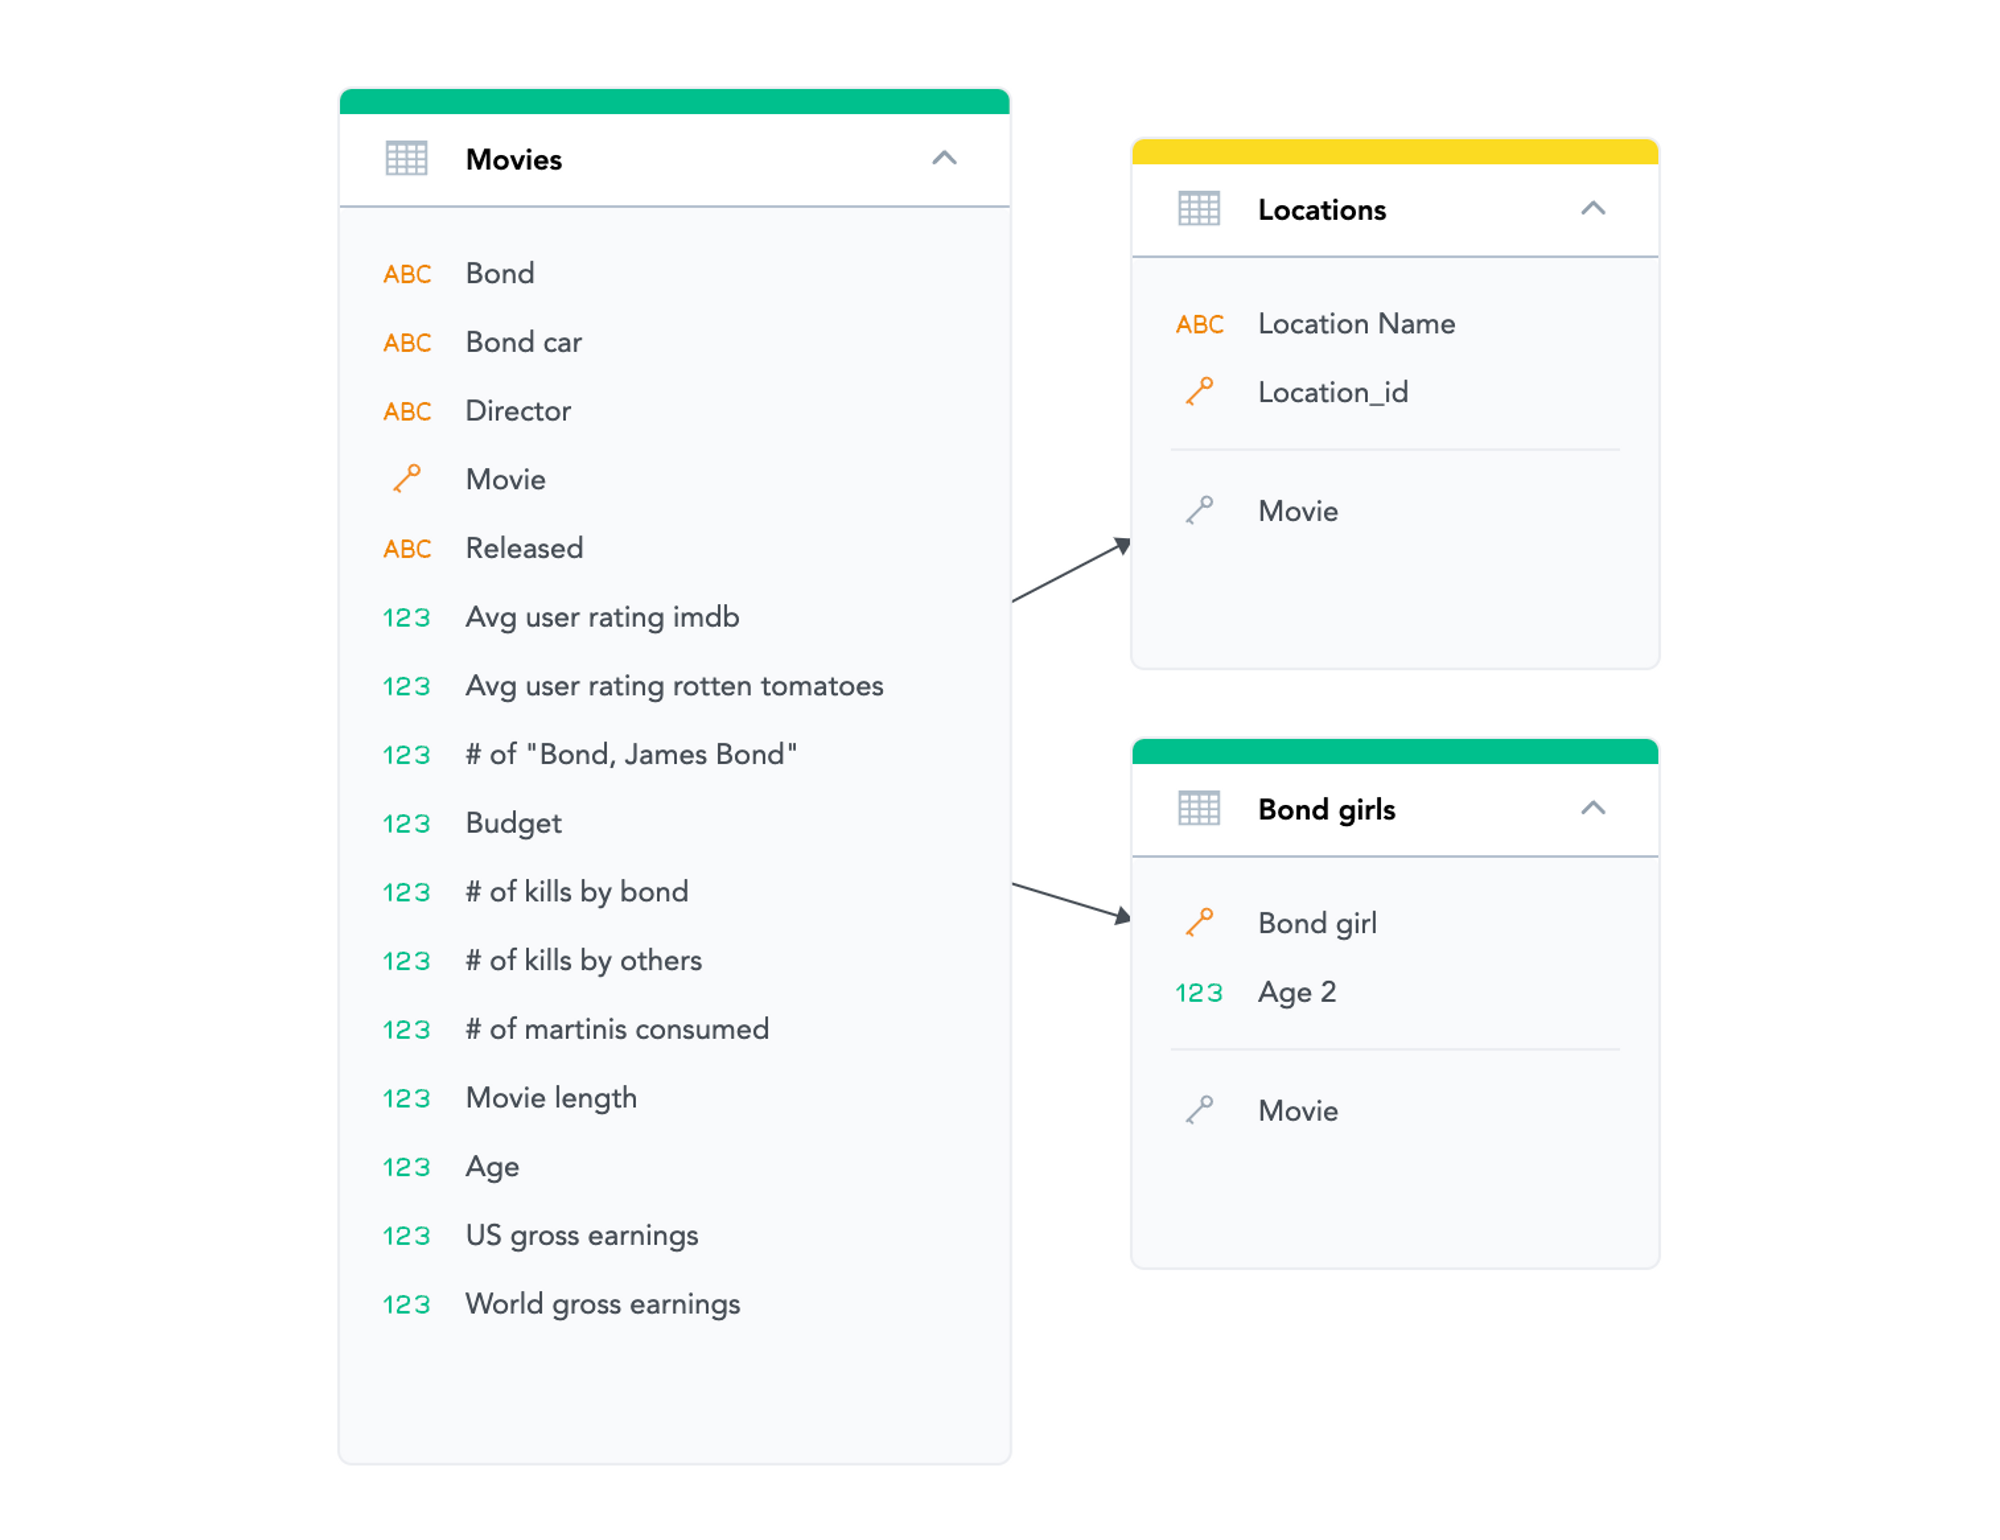
The logical data model is a cornerstone of any maintainable analytics project. The James Bond model is very simple and consists of just three datasets. Below is a shortened example of a dataset in its code form.
type: dataset
id: movies

table_path: public/movies

title: Movies

primary_key: movies.id

fields:
  bond:
    type: attribute
    source_column: bond
    data_type: STRING
    title: Bond
  bond_car:
    type: attribute
    source_column: bond_car
    data_type: STRING
    title: Bond car
  director:
    type: attribute
    source_column: director
    data_type: STRING
    title: Director
…
Metrics
In 2023 Gartner introduced a metric store as a new critical capability for Analytics and Business Intelligence (ABI) Platforms. Gartner describes it as a virtualized layer that allows users to create and define metrics as code. This is exactly what GoodData has offered for quite some time. Below is an example of metric’s code representation. The metric consists of a query (maql) and some metadata around it.
type: metric
id: profit

title: profit

maql: SELECT sum({fact/worldgross}) - SUM({metric/budget_normalized})
format: "#,##0.00"
Visualizations
Every visualization contains a query part that feeds the visualization with data. Think of it as a SQL query that represents the raw data.
The next noticeable part of visualization are buckets. These control how the raw data is translated into its visual form. We tried our best not to make the buckets visualization-specific and thus most of the visualizations contain buckets for metrics, slicing, and segmentation.
The emphasis on the distinction between raw data and buckets is aligned with GoodData’s composability efforts. Imagine that an Analytics Engineer prepares a raw data query that is later used by multiple Data Analysts in multiple visualizations.
id: actors__number-of-movies
type: column_chart

title: In how many movies did each actor play?

query:
  fields:
    number_of_movies:
      title: "# of movies"
      aggregation: COUNT
      using: label/movies.id
    bond: label/bond

  sort_by:
    - type: attribute_sort
      by: bond
      direction: ASC
      aggregation: SUM

metrics:
  - field: number_of_movies
    format: "#,##0"

view_by:
  - bond
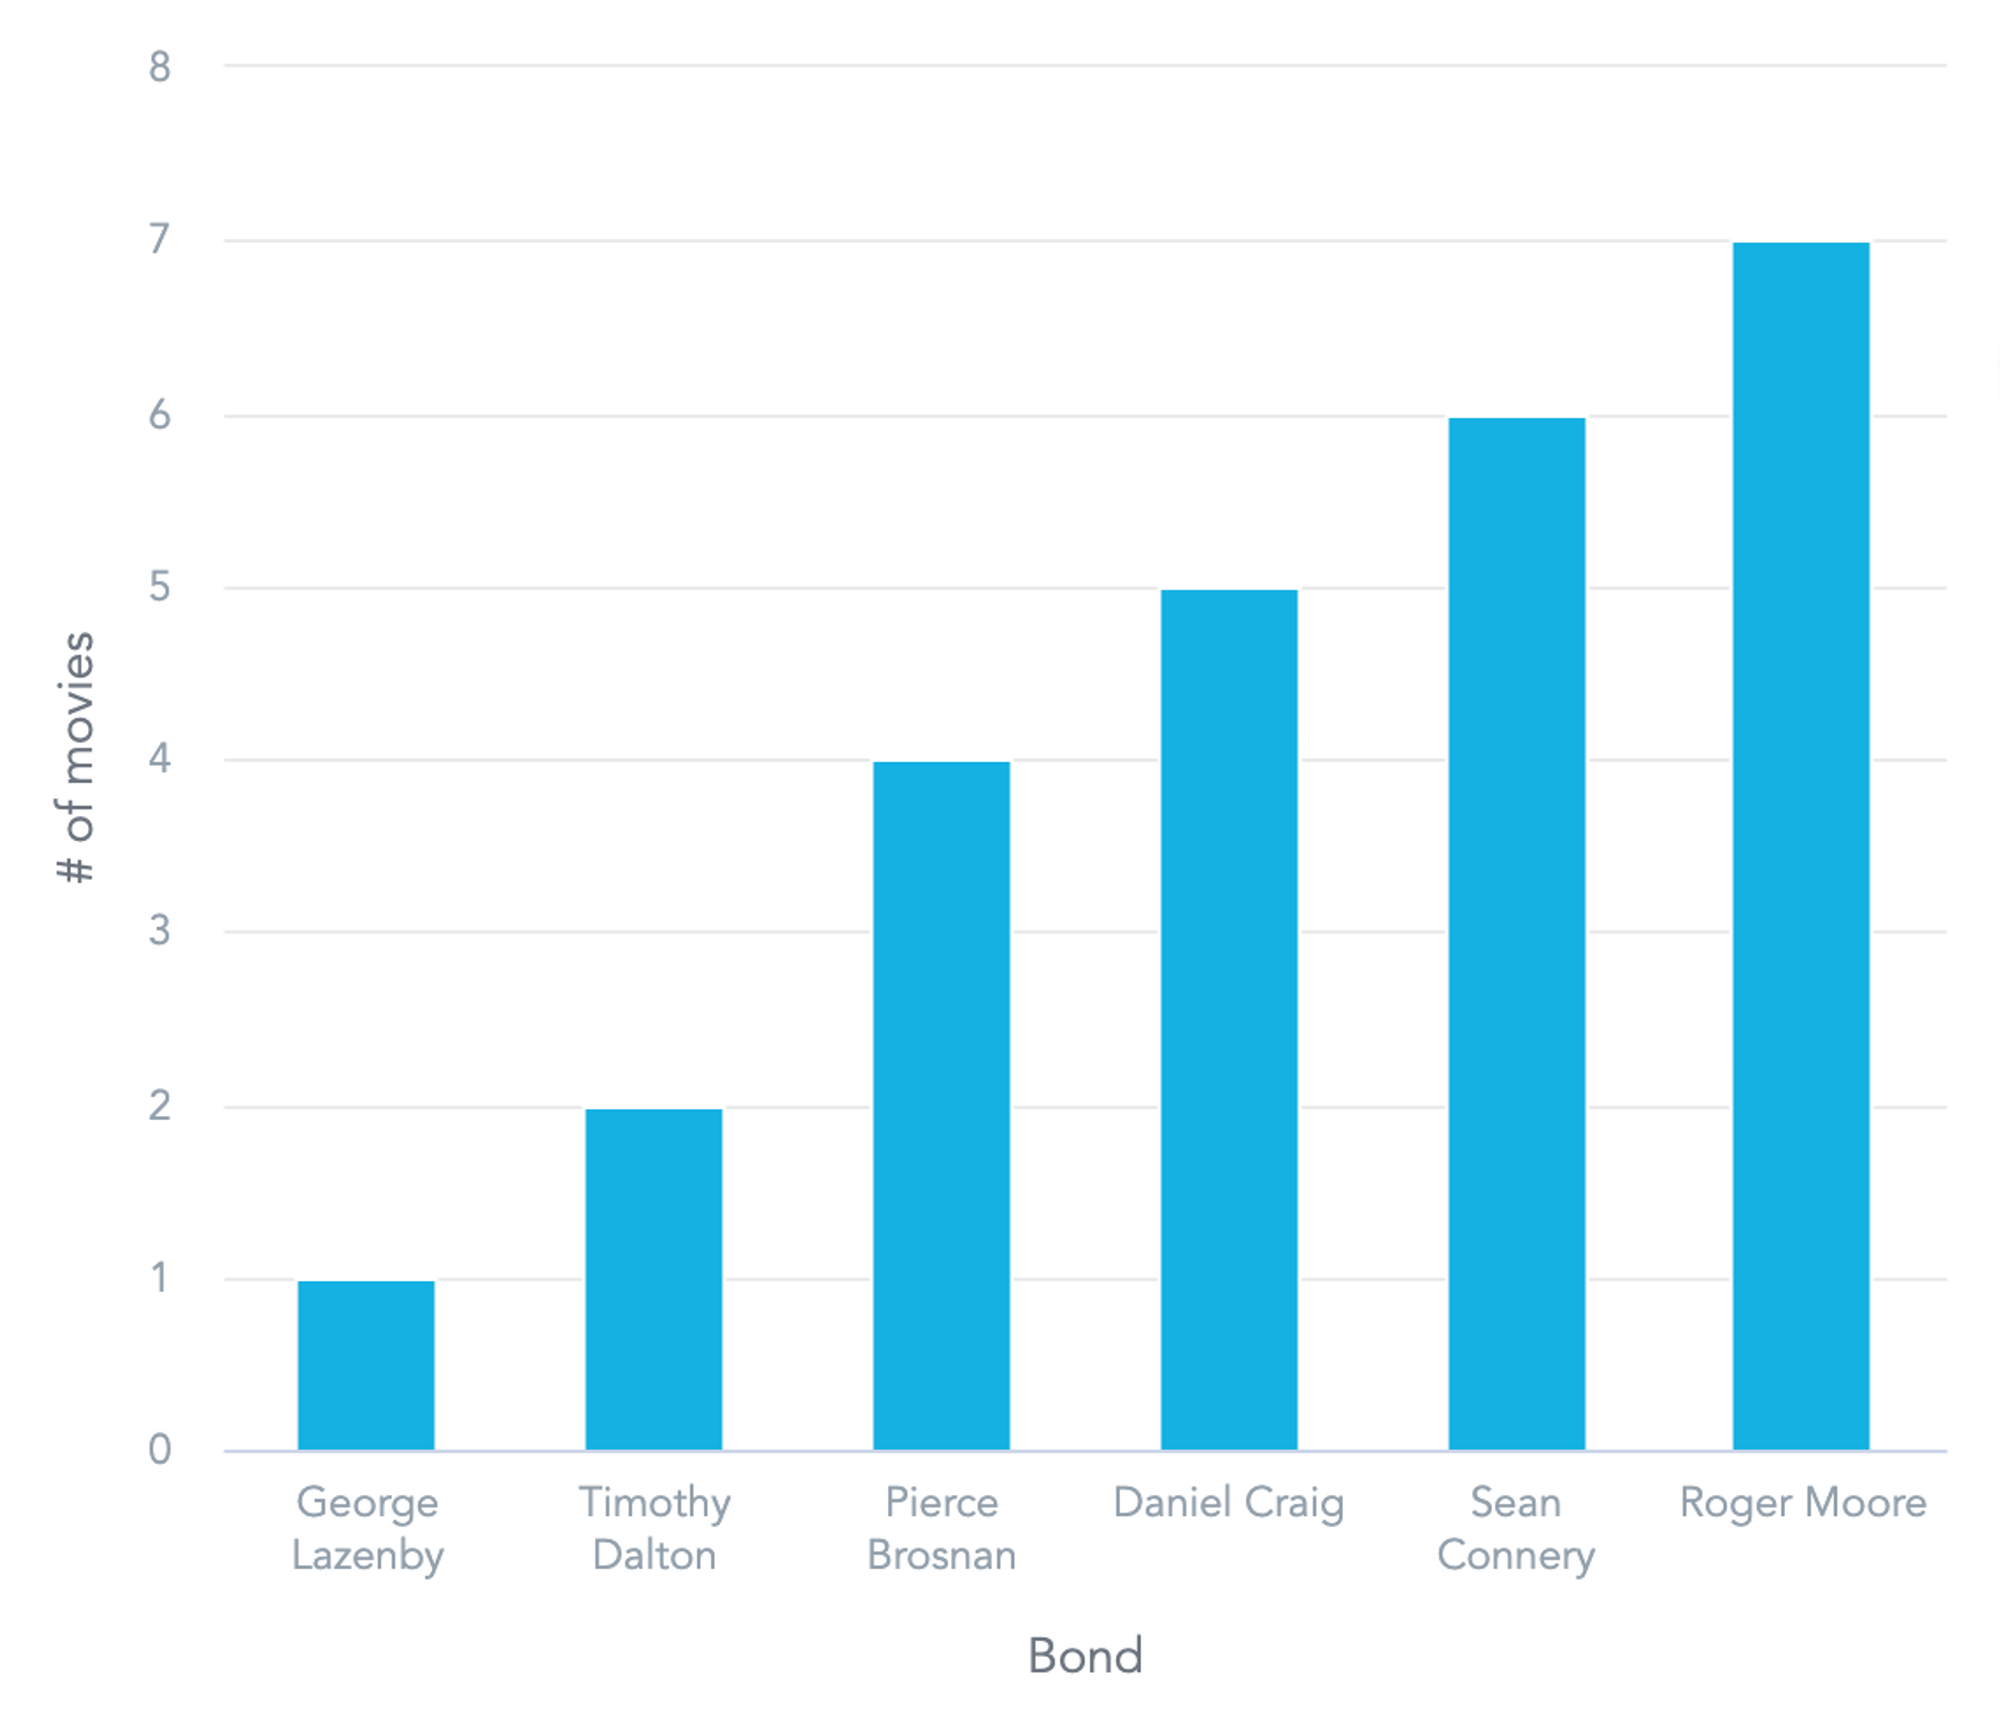
And the same visualization in its visual form.

Dashboards
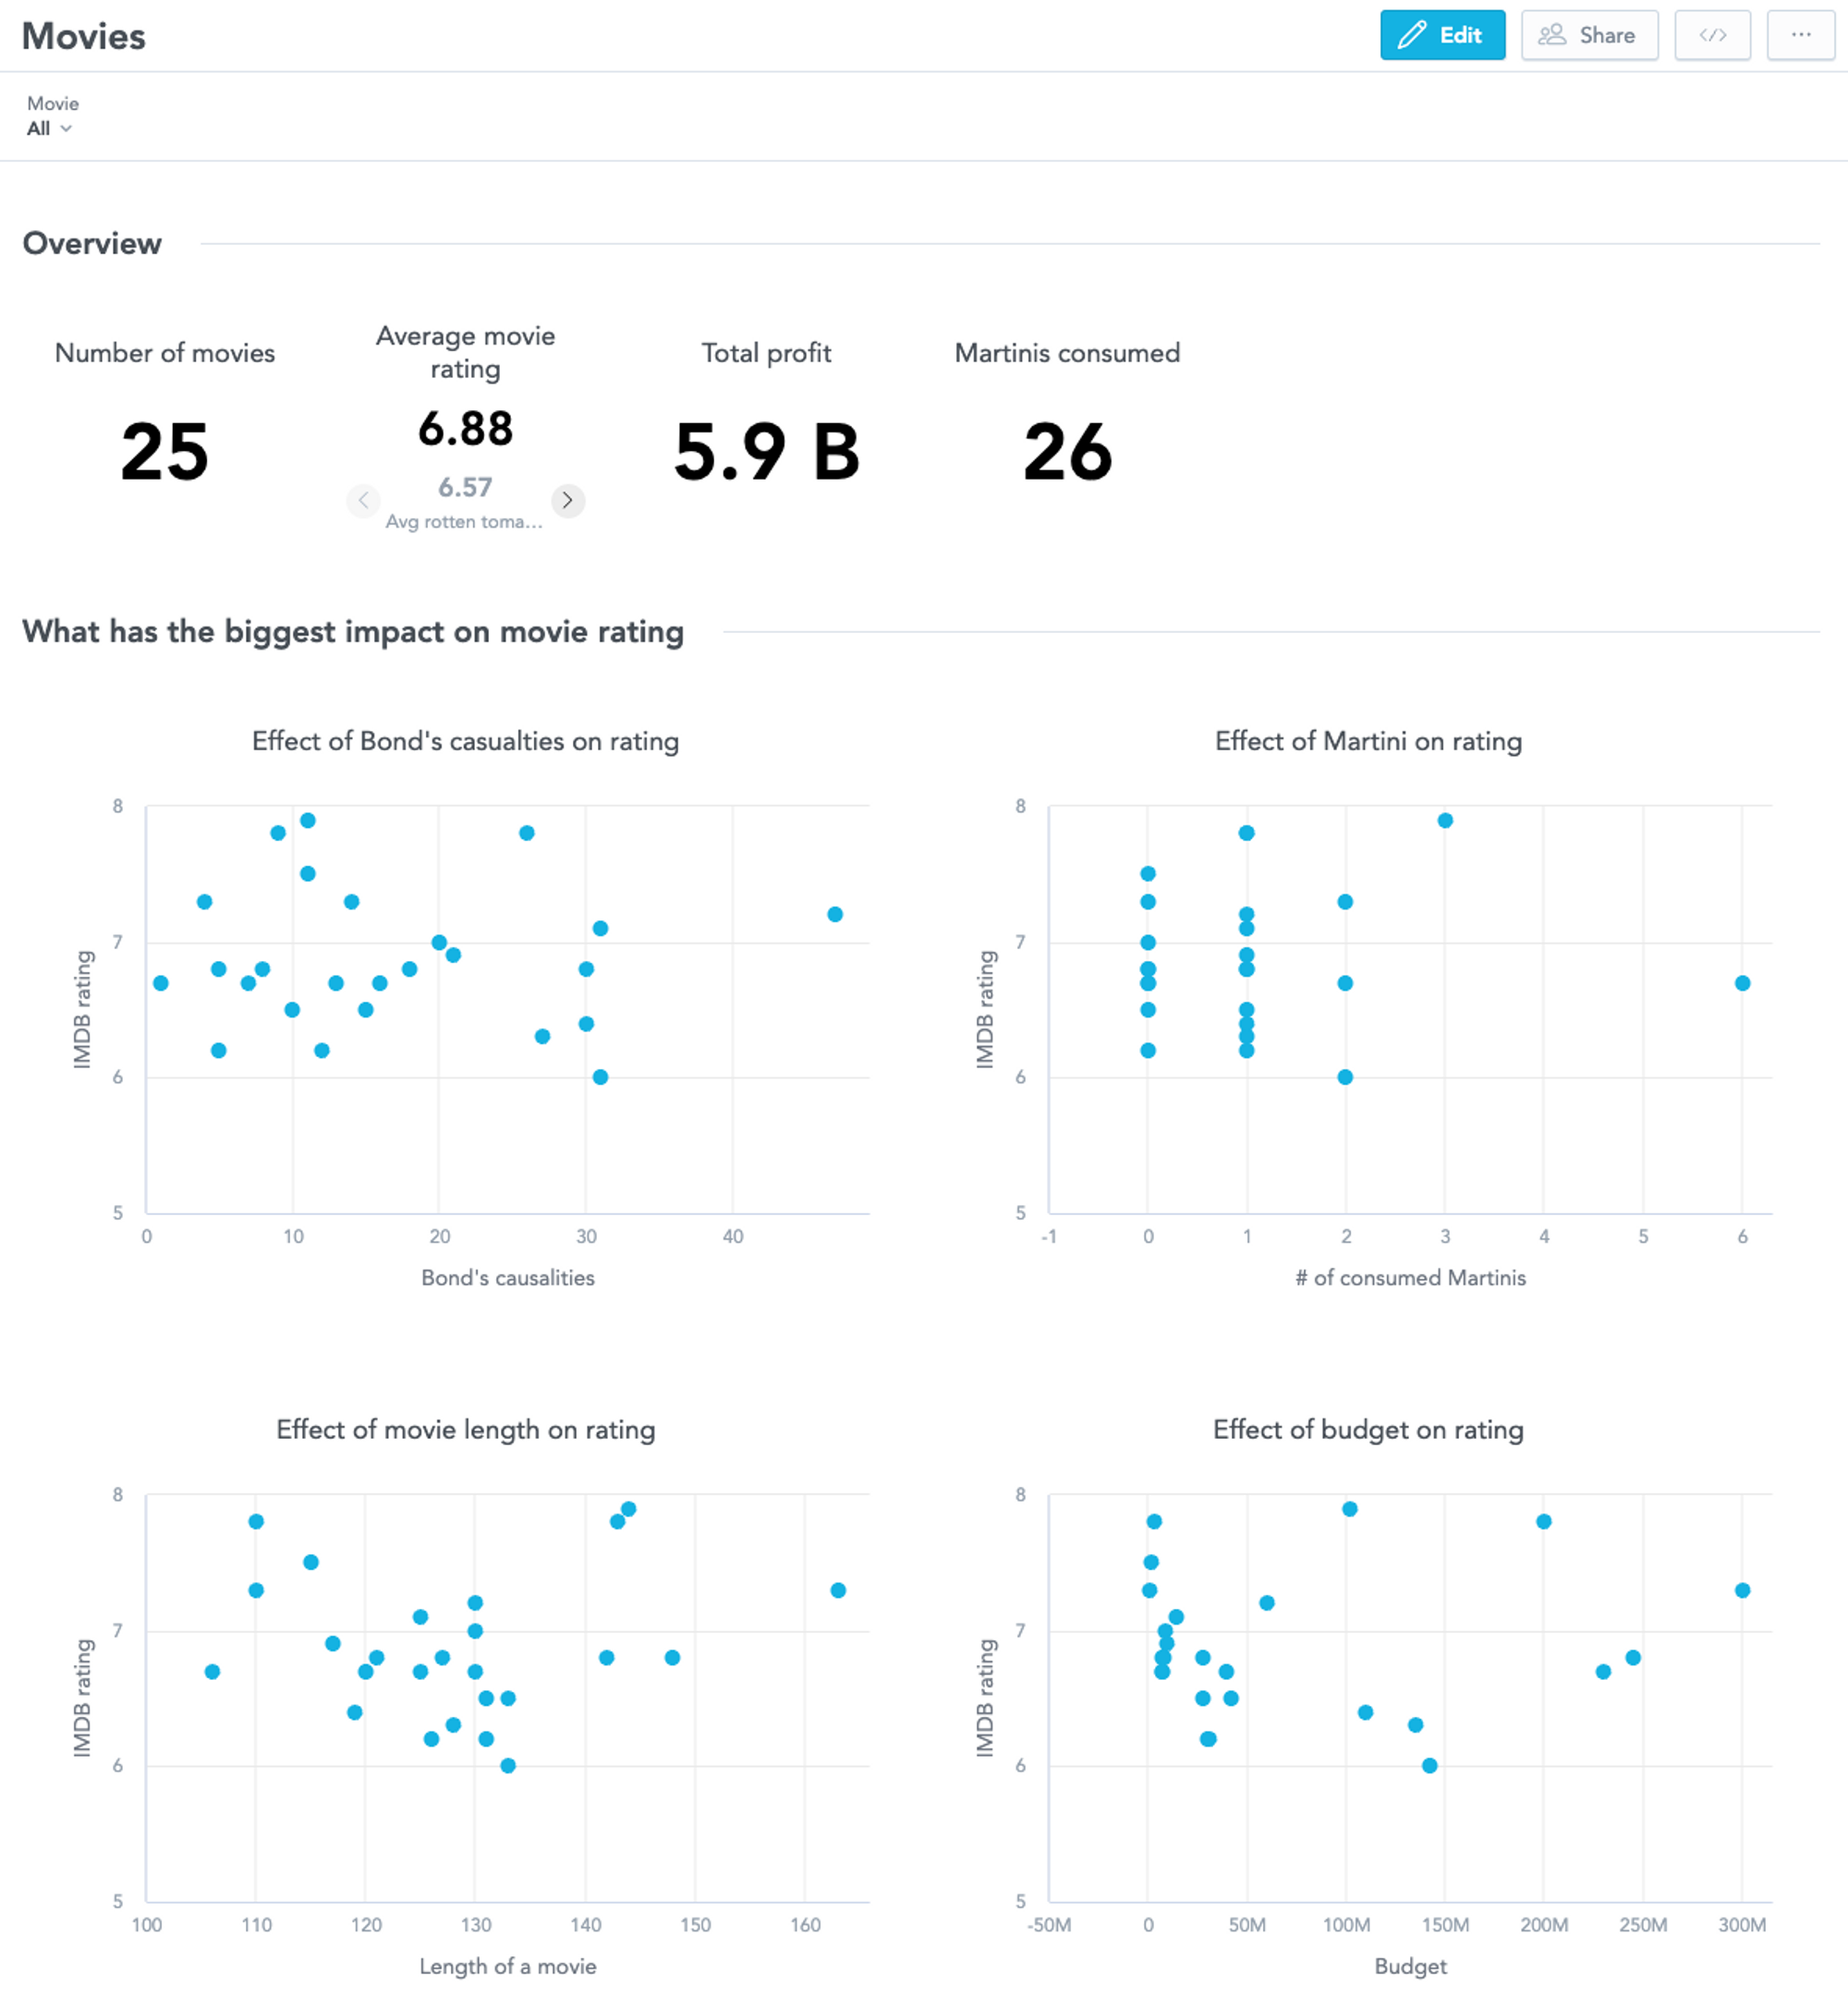
The final example relates to dashboards. The dashboard code looks fairly simple given the amount of displayed visualizations. That’s thanks to GoodData’s high level of composability, where Analytics Engineers are able to reuse a single visualization in multiple places. Does it sound like the famous DRY principle?
id: dashboard__movies
type: dashboard

title: Movies

sections:
  - title: Overview
    widgets:
      - visualization: movies__count
        title: Number of movies
        columns: 2
        rows: 10
      - visualization: movies__avg_rating
        title: Average movie rating
        columns: 2
        rows: 10
      - visualization: universal__profit
        title: Total profit
        columns: 2
        rows: 10
      - visualization: universal__martinis-consumed
        title: Martinis consumed
        columns: 2
        rows: 10
…
And here is the dashboard in its visual form. Notice the second section was omitted from the code example.

Did these samples catch your attention? Then go and check the complete reference guide.
4. It scales well
To be honest, the traditional drag-and-drop type of user interface works actually quite well until you get into scalability issues. Once you hit that wall, management of your analytics becomes a nightmare. I already spoke about IDE and how it was originally built for the productivity of software developers.
Guess what, production-quality software projects usually involve a lot of interconnected files and software developers need an easy way to manage all of them. That’s why an IDE offers functionalities like smart search, project-scoped refactoring, or go to references/definitions.
Of course, not all of these things come out of the box, but we have developed an IDE plugin that brings them even to the analytics files.
5. It supports cooperation
Cooperation is increasingly important in today's world of analytics. Silos are gone and changes need to be delivered in hours or days, not weeks or months.
Software developers have faced issues with collaboration and cooperation for many years. Let’s inspire and reuse what works well, such as various version control systems like Git. Thankfully today's IDEs offer quality out-of-the-box support for these systems, which means all the heavy lifting has already been done.
Collaboration between multiple Analytics Engineers to deliver a curated analytics experience:
The cornerstone of the curated experience is a Git repository that is considered as a single source of truth. Optionally this repository is connected to a CI/CD pipeline which validates each change and deploys it to production. Let’s have a look at how it would go in practice:
- Alice creates a new metric. She does not do it in production, but rather in her local environment.
- Alice commits her new metric and creates a pull request.
- Bob reviews her changes and accepts the pull request. Alice’s changes are now in the master branch.
- CI/CD pipeline automatically validates Alice’s changes and pushes the changes to production.
Cooperation between Analytics Engineers and business users:
Business end users strive for self-service, but in many situations, they still need assistance from Analytics Engineers. Let’s have a look at an example:
- Carol (business end user) wants to create a new visualization. However, she needs new data for it.
- Carol contacts Taylor (analytical engineer) with a request to add the required data into the semantic layer.
- Taylor pushes the changes into Git and adds a commit message explaining the changes.
- After Taylor’s changes get promoted to production, Carol creates her desired visualization.
- Other business users start to request the very same visualization Carol has already created.
- Taylor doesn’t need to recreate the visualization from scratch, instead, he simply fetches and accepts Carol’s visualization as a part of the curated experience.
Conclusion
In this article, I tried to outline a vision for an alternative user interface to author analytics. It might be tempting to ditch the drag-and-drop type of user interface at this point, but I won’t do that. I still believe it has its place in the analytics ecosystem, mainly for self-service analytics and business users.
Analytics Engineers as we know them however strive for productivity and see that software development best practices will ease their daily jobs. I believe the analytics as code type of interface will cover their needs.
Still not convinced? Would you like to try it? The easiest way to do so is to try our GoodData for VS Code.
Written by Tomáš Muchka |
Subscribe to our newsletter
Get your dose of interesting facts on analytics in your inbox every month.
Subscribe