A Guide to MAQL Metrics Reusability
Written by David Kubečka |

In this blog post, we will showcase Multidimensional Analytical Query Language (MAQL) reusability capabilities in more detail. However, if you are not yet familiar with the concepts and purpose of MAQL — the GoodData analytics platform’s proprietary query language — please first read the MAQL introduction blog post.
We'll guide you through the reusability metric creation journey via concrete examples and pictures. For hand-on experience with MAQL, try GoodData.CN and the demo data provided along with it (while taking into consideration this article or experimenting on your own). Simply follow the Getting Started guide to get a kick-start with the Community Edition. For this tutorial, it’s necessary that you complete steps one to four (i.e., end up with a functional logical data model of the demo workspace).
For this blog post, below is the model that we will work on:
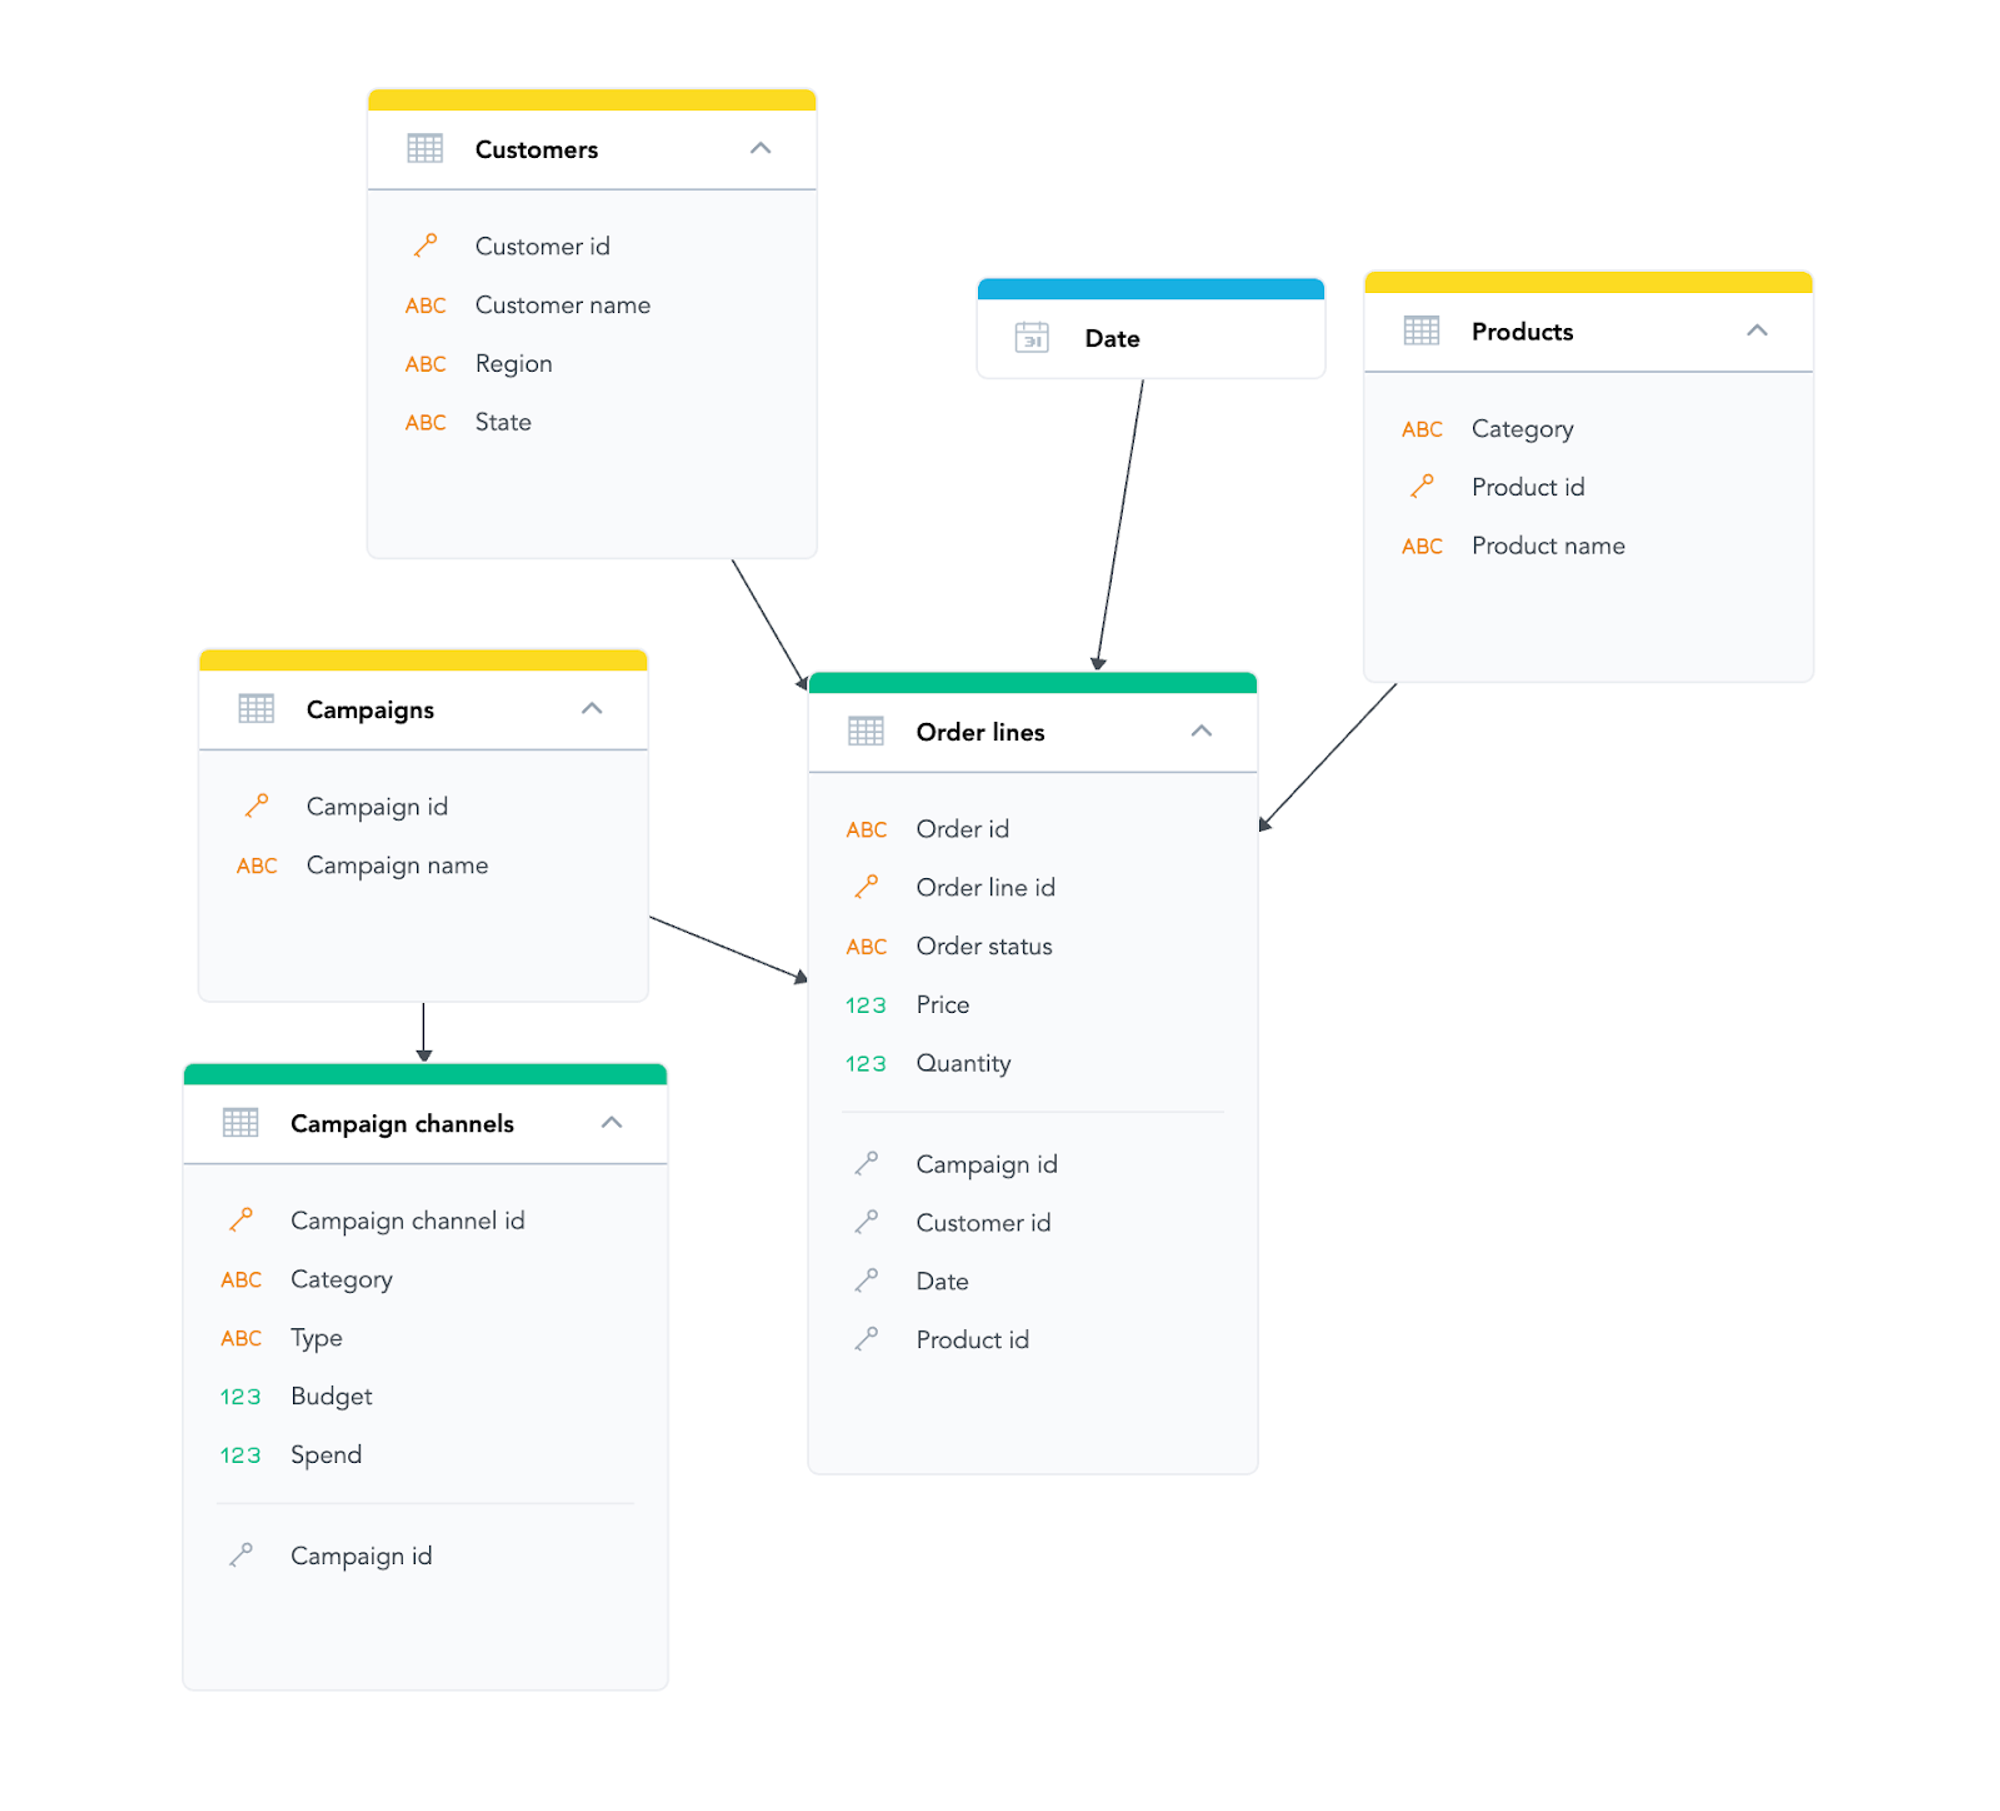
You can see that we have one fact dataset, Order Lines, with three connected dimension datasets: Customers, Products, and Date. Also shown in the model are the Campaigns and Campaign Channels datasets; however, we won’t be using them in this tutorial. For more information about these concepts, take a look here.
Why not try our 30-day free trial?
Fully managed, API-first analytics platform. Get instant access — no installation or credit card required.
Get startedMetric Definition
Our goal is to create a reusable metric by computing the ratio of order amount on the given report dimensionality to the total order amount for each Region. The reusability of this metric means that the end user should be able to choose any dimensionality (or granularity) of the report and get the expected results. For example, for State dimensionality, one should get the order amount ratio of each State to its corresponding Region. In contrast, for State and Category, the nominator of our ratio should represent the total order amount broken down by State and Category.
Note: If you are following with a live GoodData.CN instance, you can create the metric yourself in the Metric Editor.
Let’s start with the definition of our base metric: Order Amount.
SELECT SUM({fact/price}*{fact/quantity})
Once you have your base metric, you can finally define the main metric: Order Amount Ratio to Region.
SELECT (SELECT {metric/order_amount}) /
(SELECT {metric/order_amount} BY {label/region}, ALL {label/state})
If you create the metric yourself, ensure that the Number format is set to Percent (rounded).
Before we demonstrate its capabilities, let’s first explain what exactly is happening here with all those BY and ALL keywords. The nominator of this metric doesn’t have any BY modifier, so its dimensionality is taken from the context. In this case, the report attributes — as you will see later — ensure the reusability requirement. The BY modifiers in the denominator ensure that Region will always be part of the dimensionality, while State will never be.
Now that we understand the basics of MAQL mechanics, it’s time to put our metric into action and use it in the Analytical Designer, the visualization tool provided with GoodData.CN. Under different attribute combinations, we will see what happens. Firstly, note that because the denominator is BY Region ... , the Region should always be in attribute buckets; otherwise, the result wouldn’t make sense. So, let’s first only put Region into an attribute bucket, such as Rows.
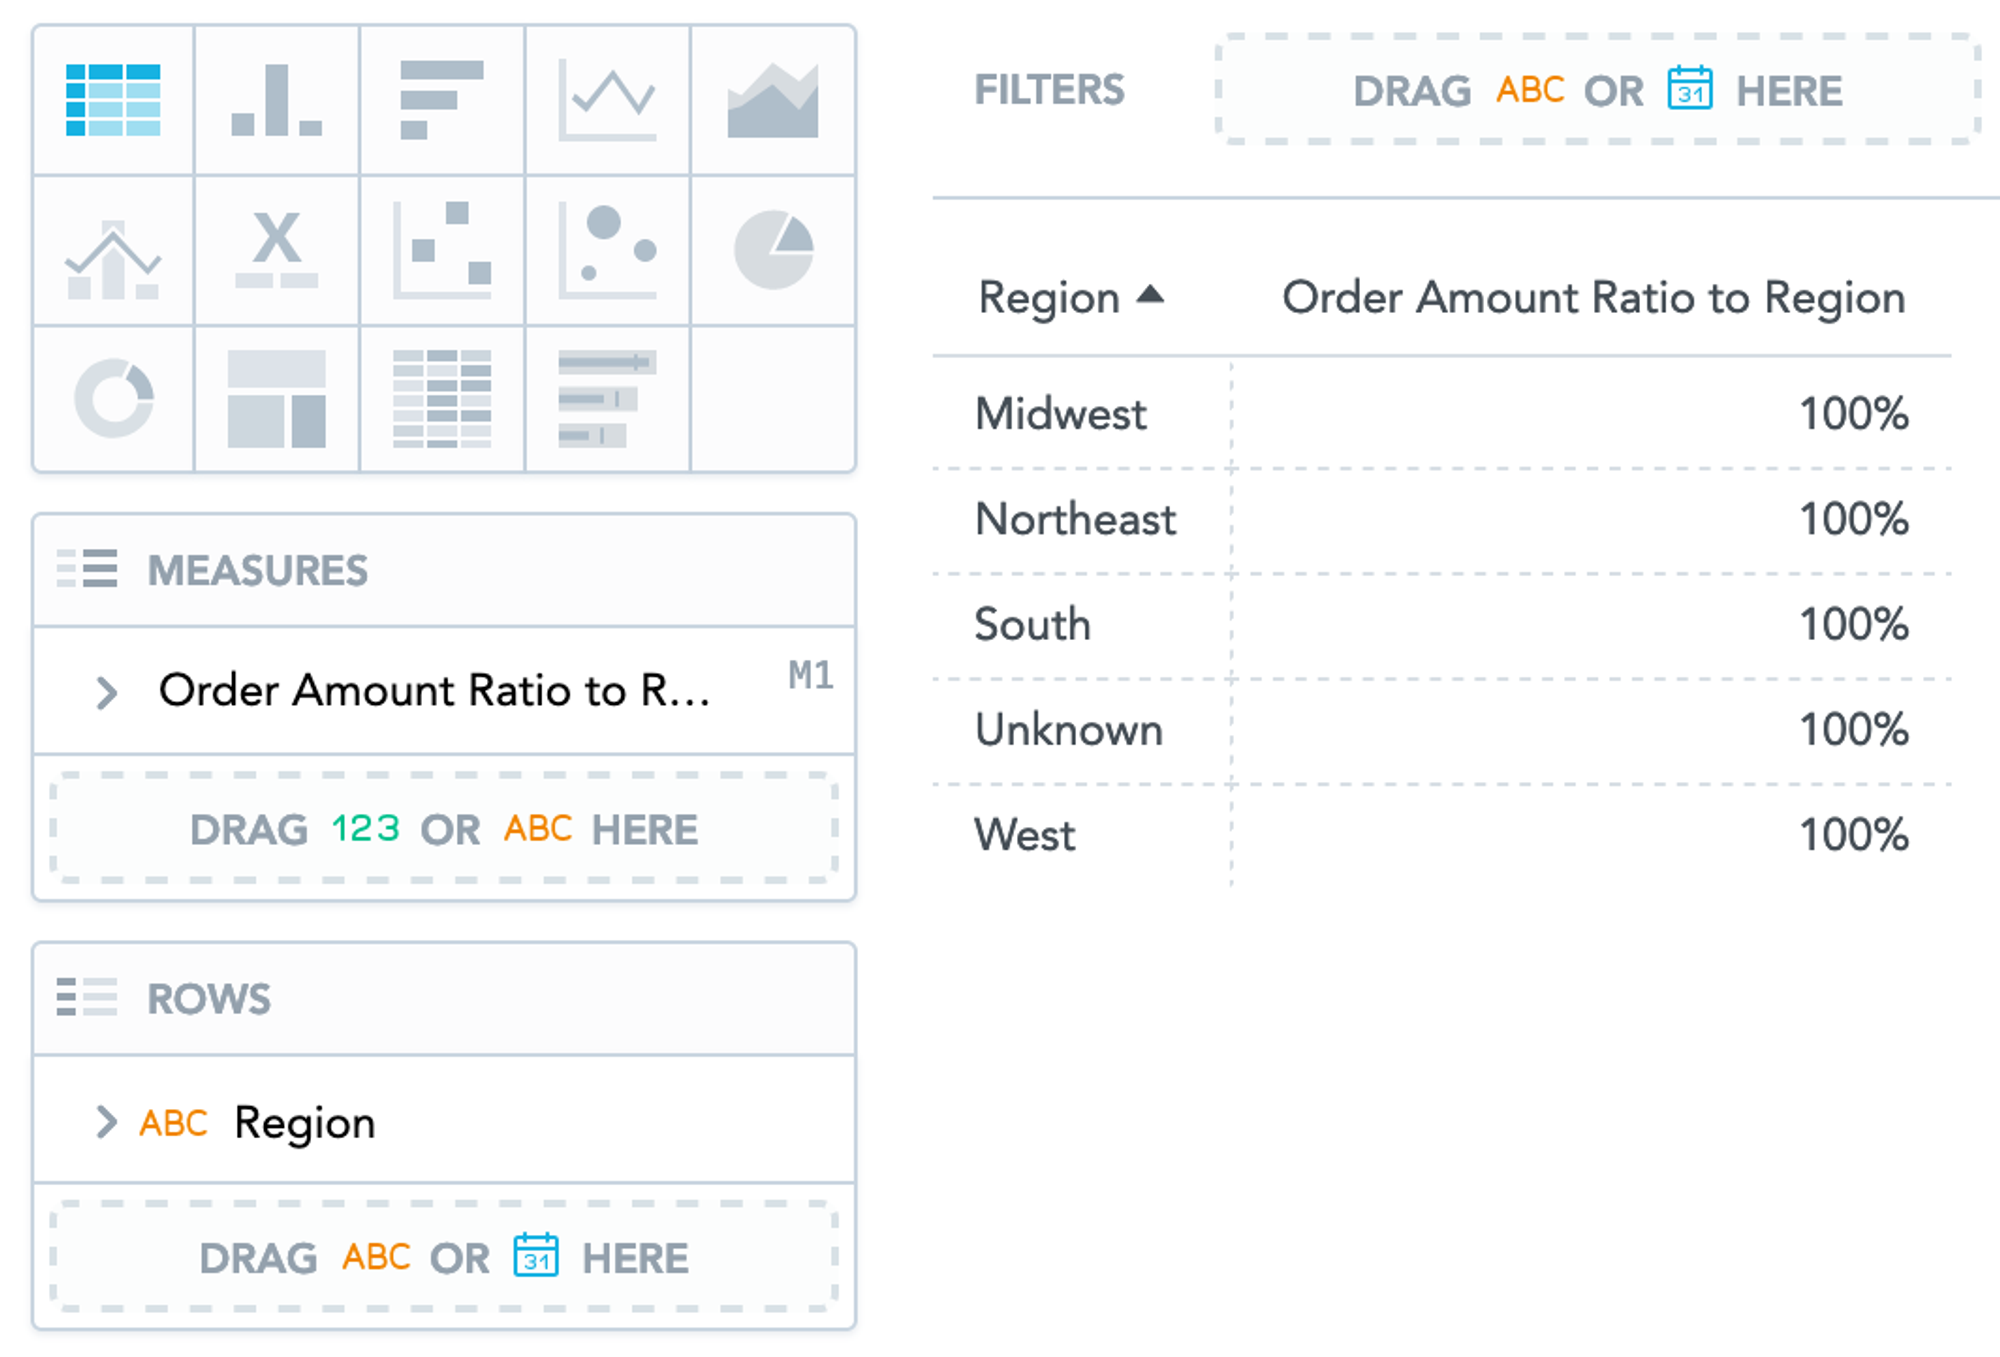
As you can see, we get a 100% ratio for each Region. This is because the nominator inherits dimensionality from the context while the denominator has a fixed Region (which we already have in context) and removes State (which we don’t have in context, so this is a no-op). Therefore, both parts are effectively the same, yielding 100%.
Now, we can try something a little more interesting, such as adding State to rows.
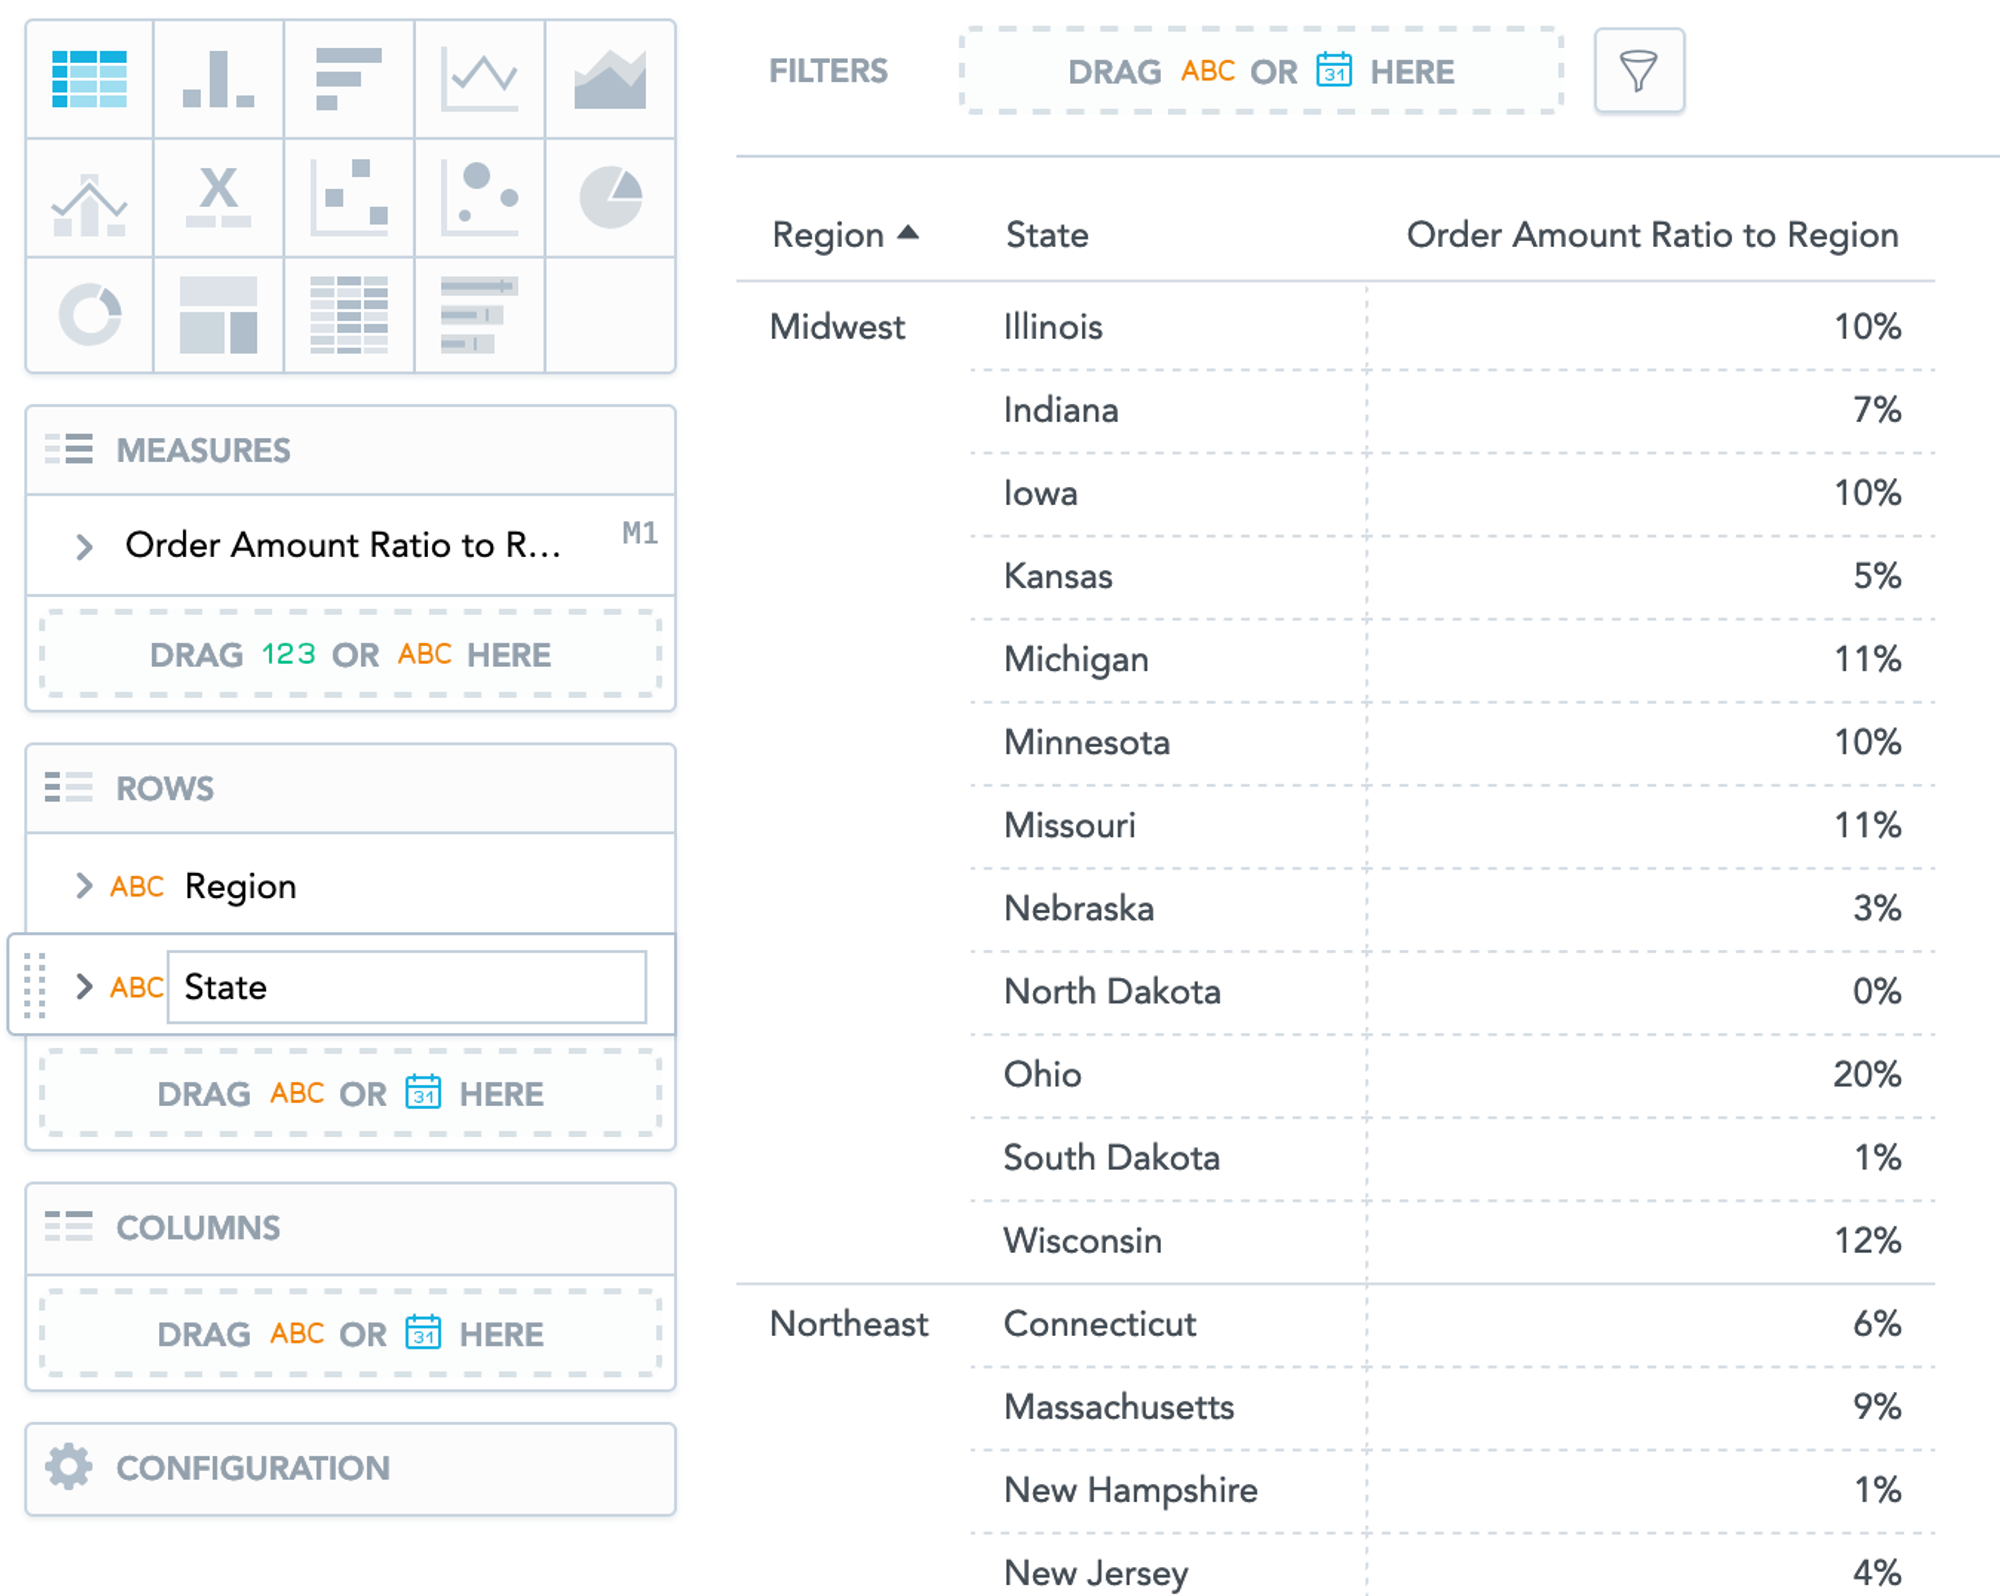
This now gives us some useful numbers. The nominator is again computed on the context dimensionality (Region, State); although, this time, the denominator is only on Region because State is removed from the context by means of the ALL STATE construct. So, we effectively computed a ratio of State order amount against the total order amount of the corresponding Region.
Reusability in Action
Finally, let’s demonstrate the reusability aspect of the metric. Thus far, we have found only one combination of attributes for which our metric gives sensible results: Region and State. The unique MAQL property, which sets it apart from the other analytical languages, is its ability to compute a metric under various different contexts. Let’s add an attribute from a different dataset to our report, such as Category from Products.
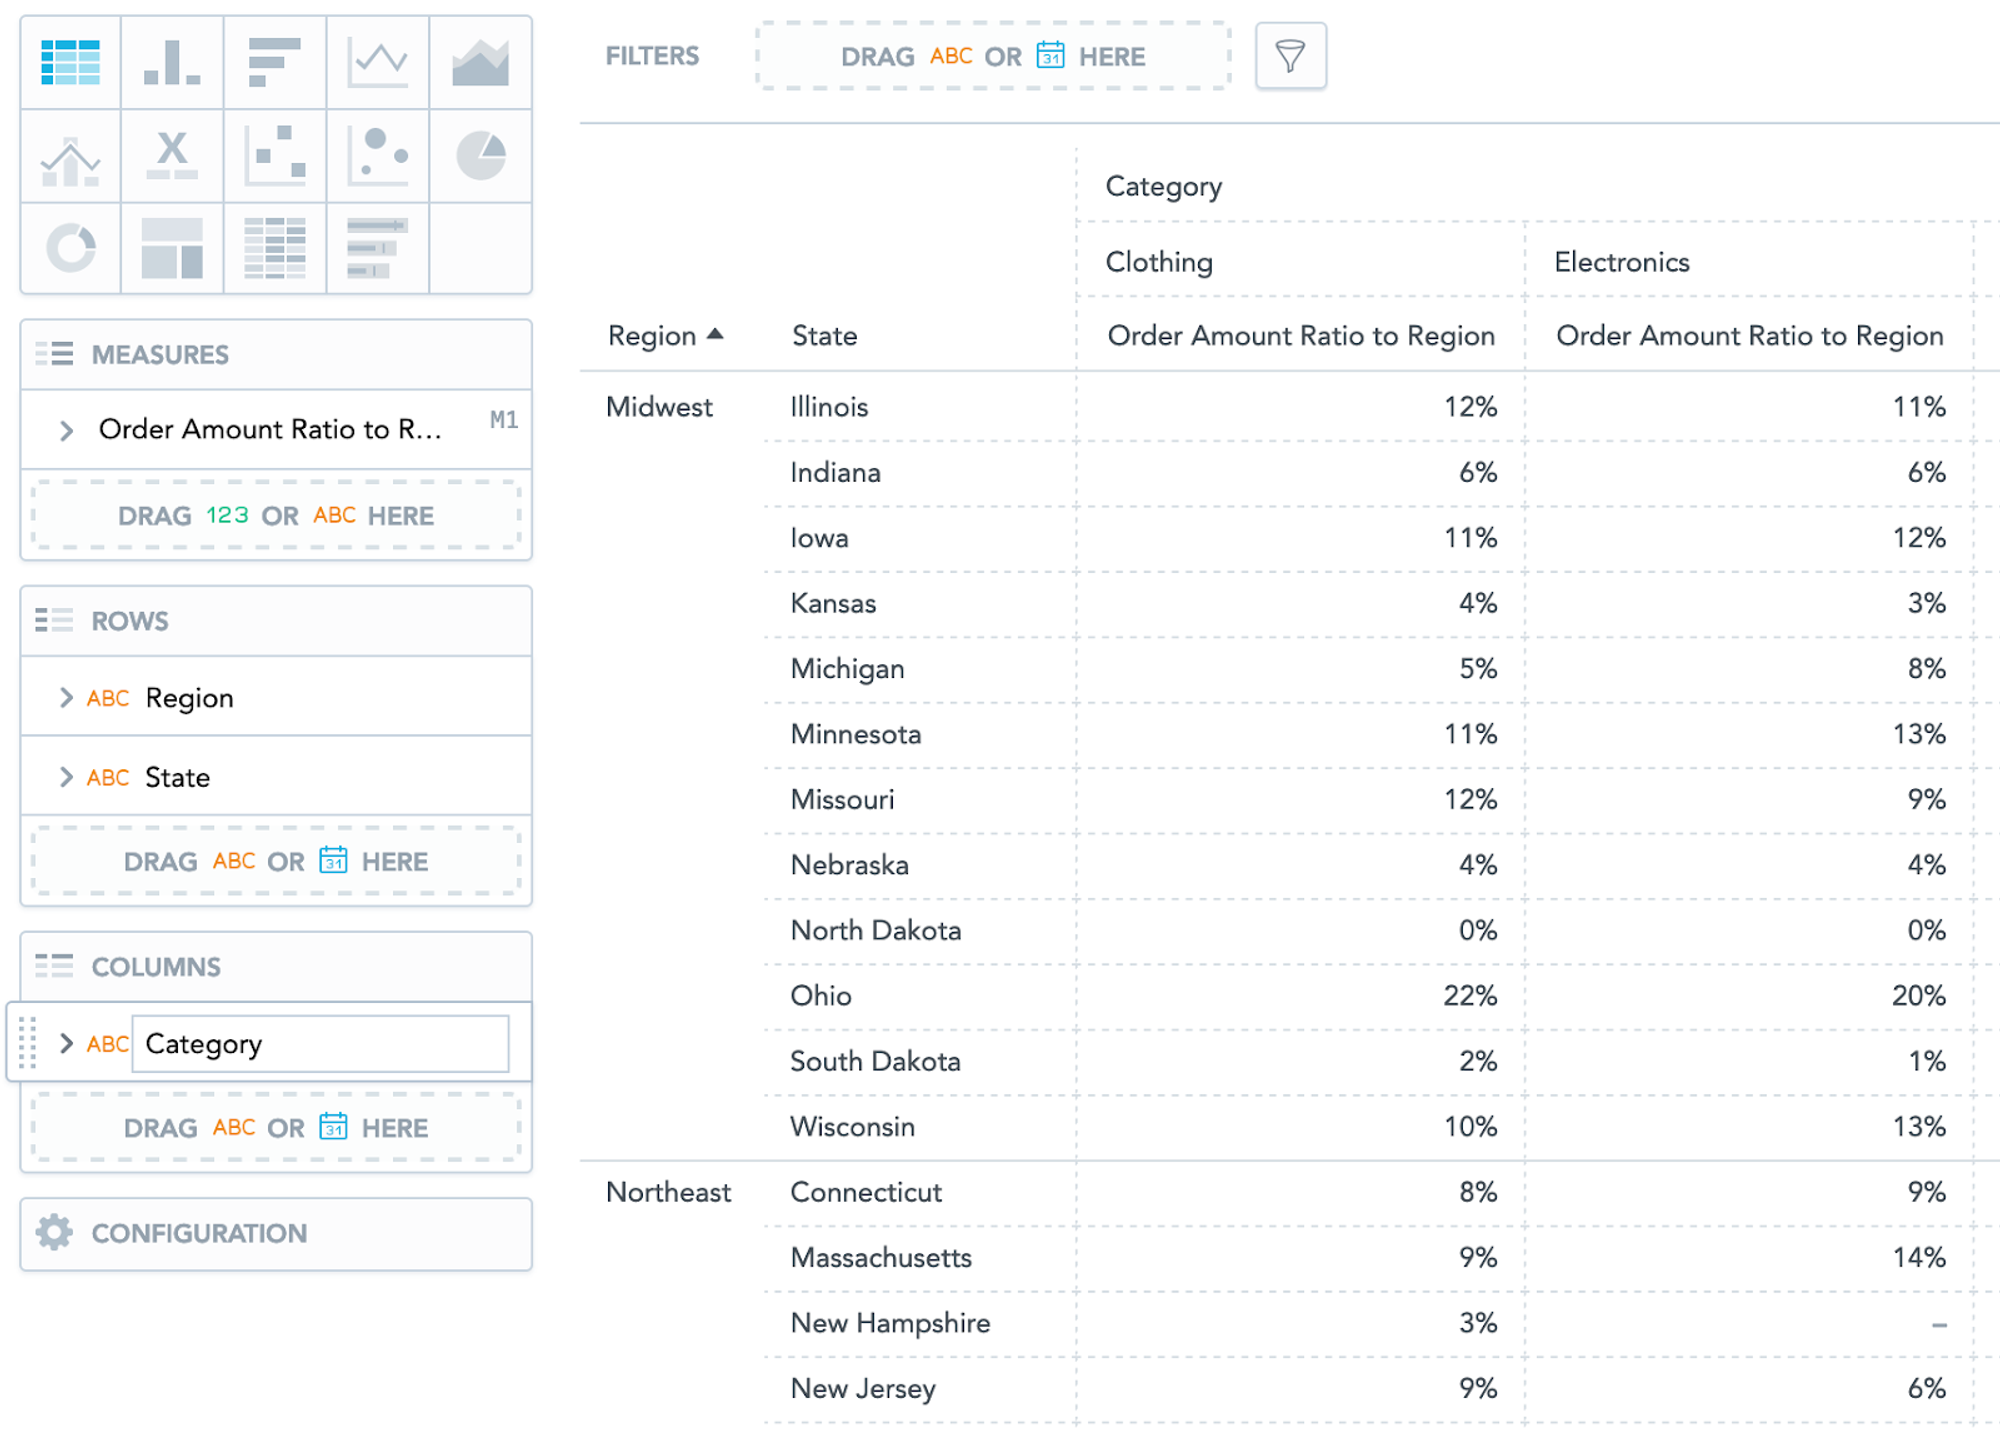
We now get a ratio between order amount per Region, State, Category, and order amount just per Region, Category. In particular, the denominator is directly computed on the Category attribute because any BY modifiers do not influence it, so it’s simply kept as is. Note that the corresponding metric column adds up to 100%.
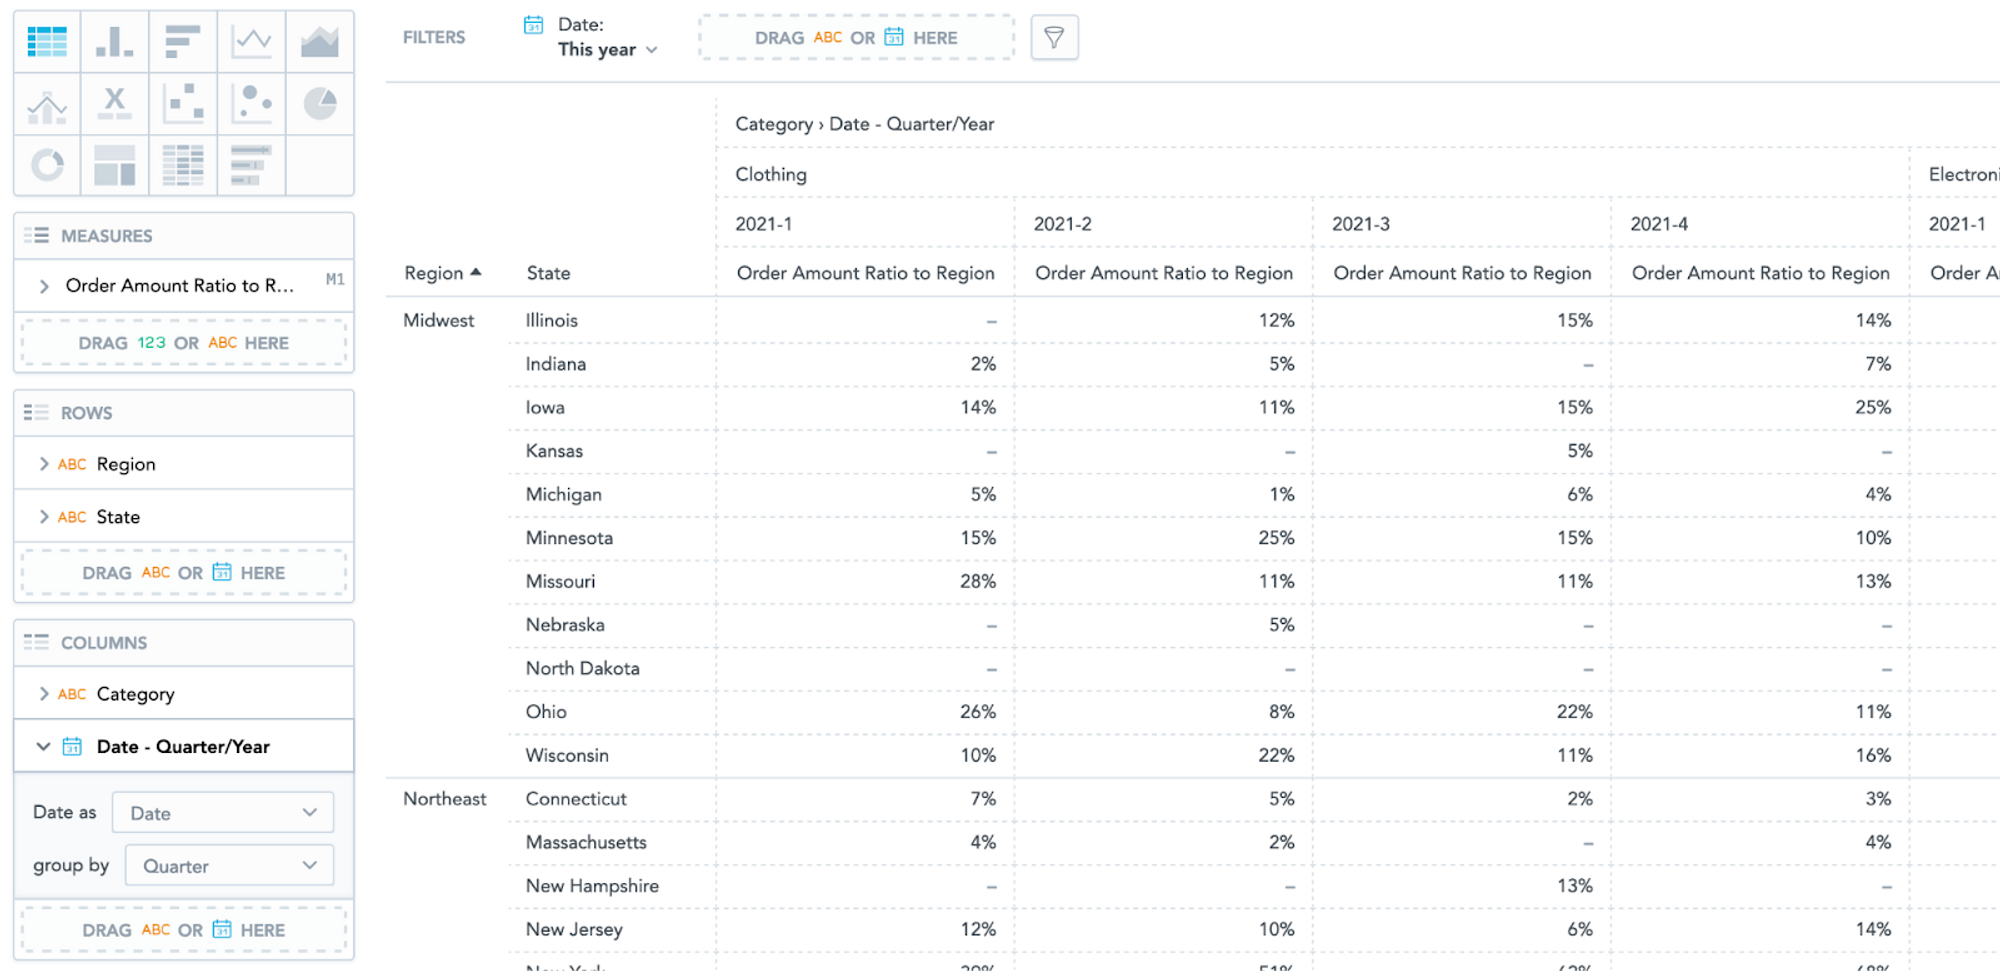
Similarly, we could add more attributes, this time from the Date dimension (Quarter/Year) and even some filters (this Year). We still get meaningful and correct numbers:
But what if we want to fix the dimensionality of the denominator to Region and ignore all other context attributes? For that, you would have to slightly modify the Order Amount Ratio to Region metric. Actually, for future comparison, it’s more useful to create a new version: Order Amount Ratio to Region All Other.
SELECT (SELECT {metric/order_amount}) /
(SELECT {metric/order_amount} BY {label/region}, ALL OTHER)
The newly added ALL OTHER construct means to ignore all other context attributes except those from BY. Consequently, we don’t have to specify ALL STATE anymore since ALL OTHER covers it. Let’s see the results for the Region, State, Category attributes combination.
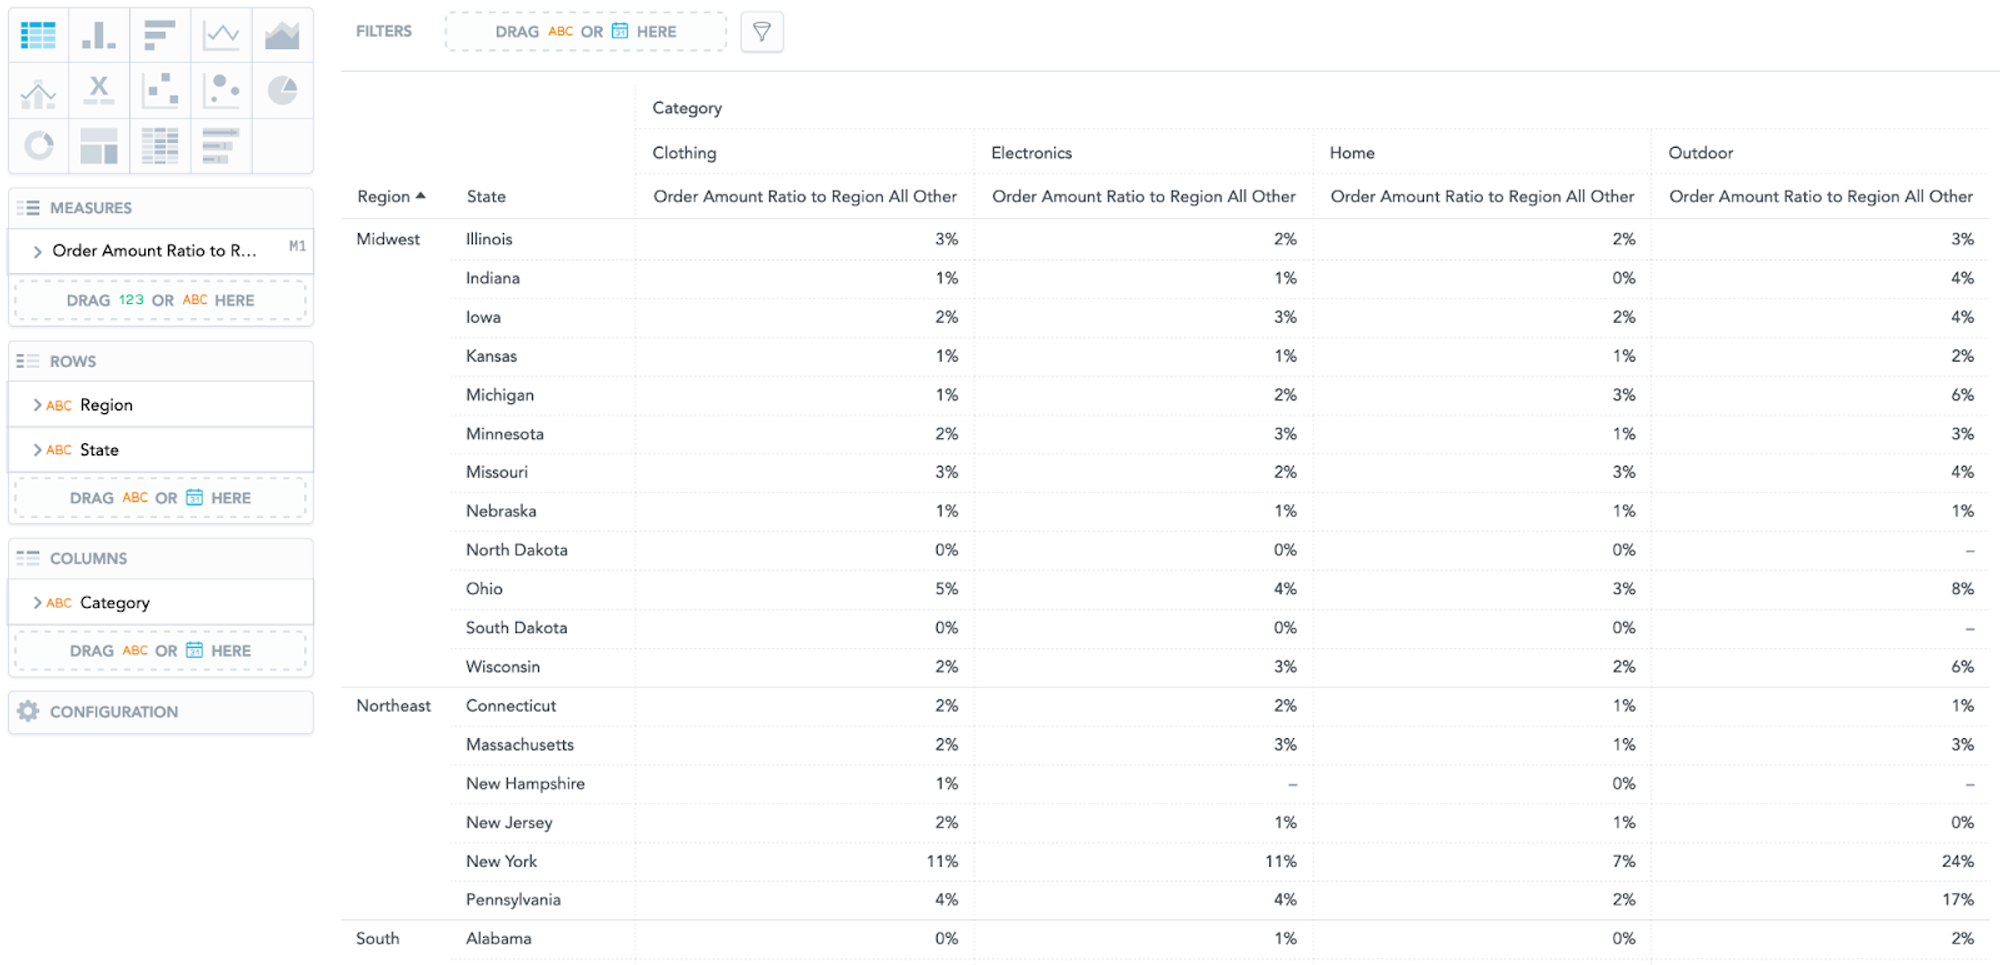
Now, we get Region, State, and Category order amount divided by whole Region totals.
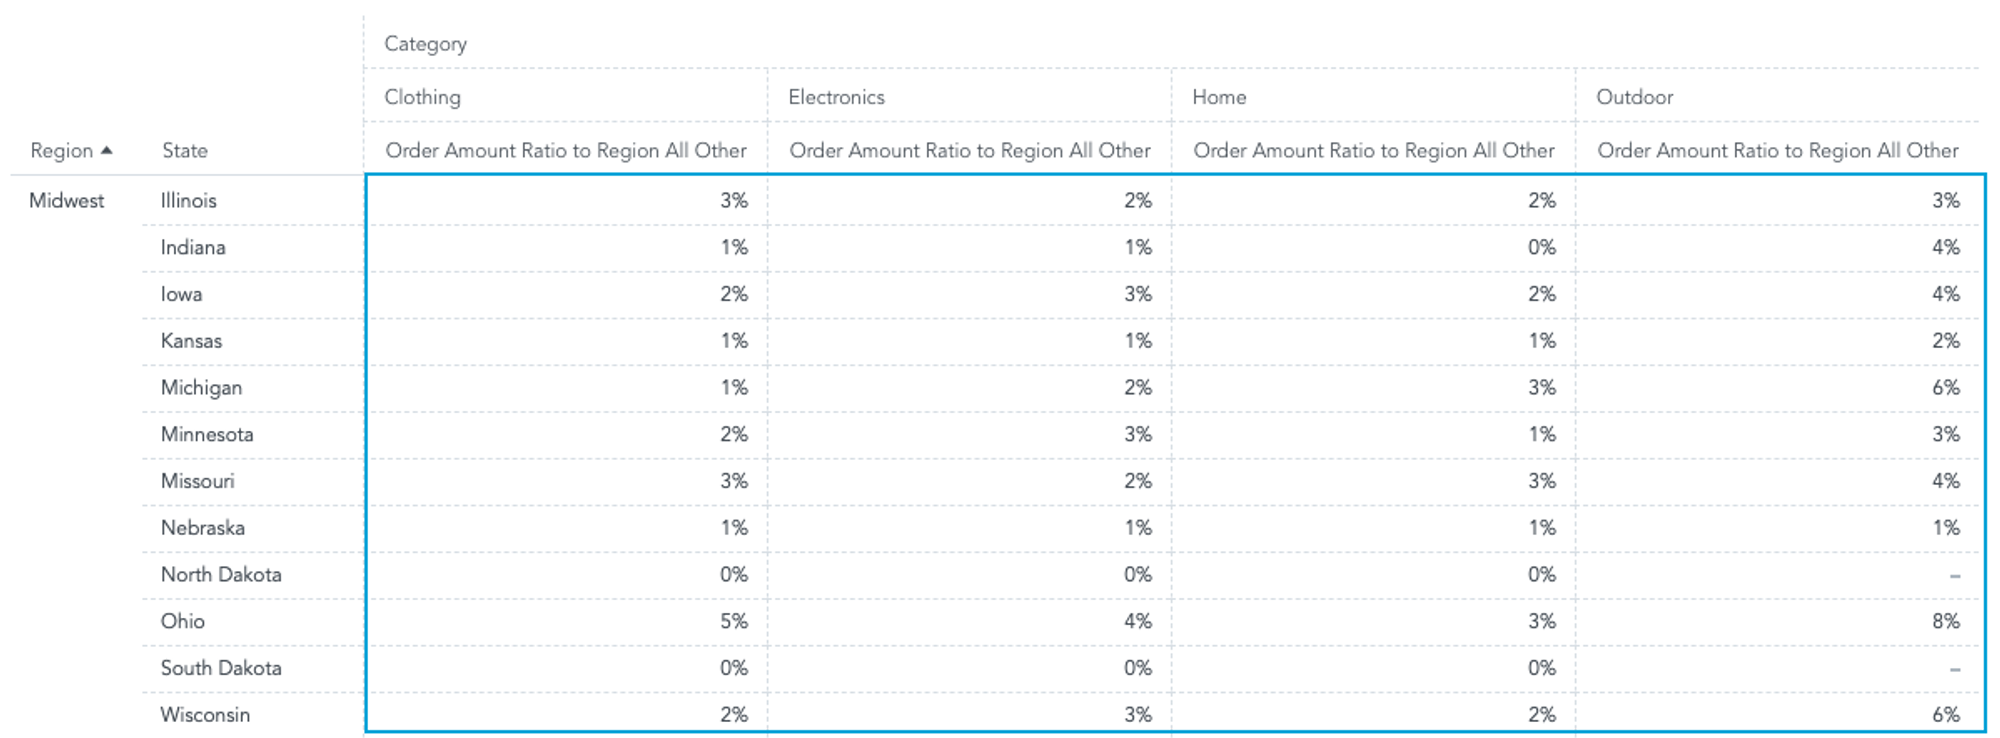
Note that if we want to get 100%, we have to add up all numbers in the selected whole Region/Category rectangle below.
Try it out yourself: Even this modified metric still displays the same reusability capabilities as shown before.
Learn More About MAQL
Excited to learn more about reusable MAQL metrics? To get further in-depth knowledge of this powerful language, you can follow our GoodData University MAQL course. For additional help and info, see our MAQL documentation, community forum, and community Slack channel.
Why not try our 30-day free trial?
Fully managed, API-first analytics platform. Get instant access — no installation or credit card required.
Get startedIf you are interested in GoodData.CN, please contact us. Alternatively, sign up for a trial version of GoodData Cloud: https://www.gooddata.com/trial/
Written by David Kubečka |
Subscribe to our newsletter
Get your dose of interesting facts on analytics in your inbox every month.
Subscribe