Design Better Dashboards: 5 Ways to Make Dashboards Stick


Any time a company invests in analytics, they are going to want their employees to actually use the tool. It may sound obvious, but the design of a dashboard can go a long way to determining whether or not users will actively adopt the solution. Check out these five techniques for dashboard design to help engage users.
1) Make the Dashboard a Part of a Routine
All professionals have routines that they establish as part of their daily workflow. Ideally, a dashboard will serve as the focal point of a user’s routine. No matter who the audience may be, making your reporting indispensable to a user’s workday is the ultimate form of stickiness. Start your design process by thinking like your user: What information and KPIs are vital to their performance? How do their superiors evaluate them? Use information like this as the logical focus of a dashboard. In this manner you can ensure that you are providing a tool that contains actionable and meaningful insights.
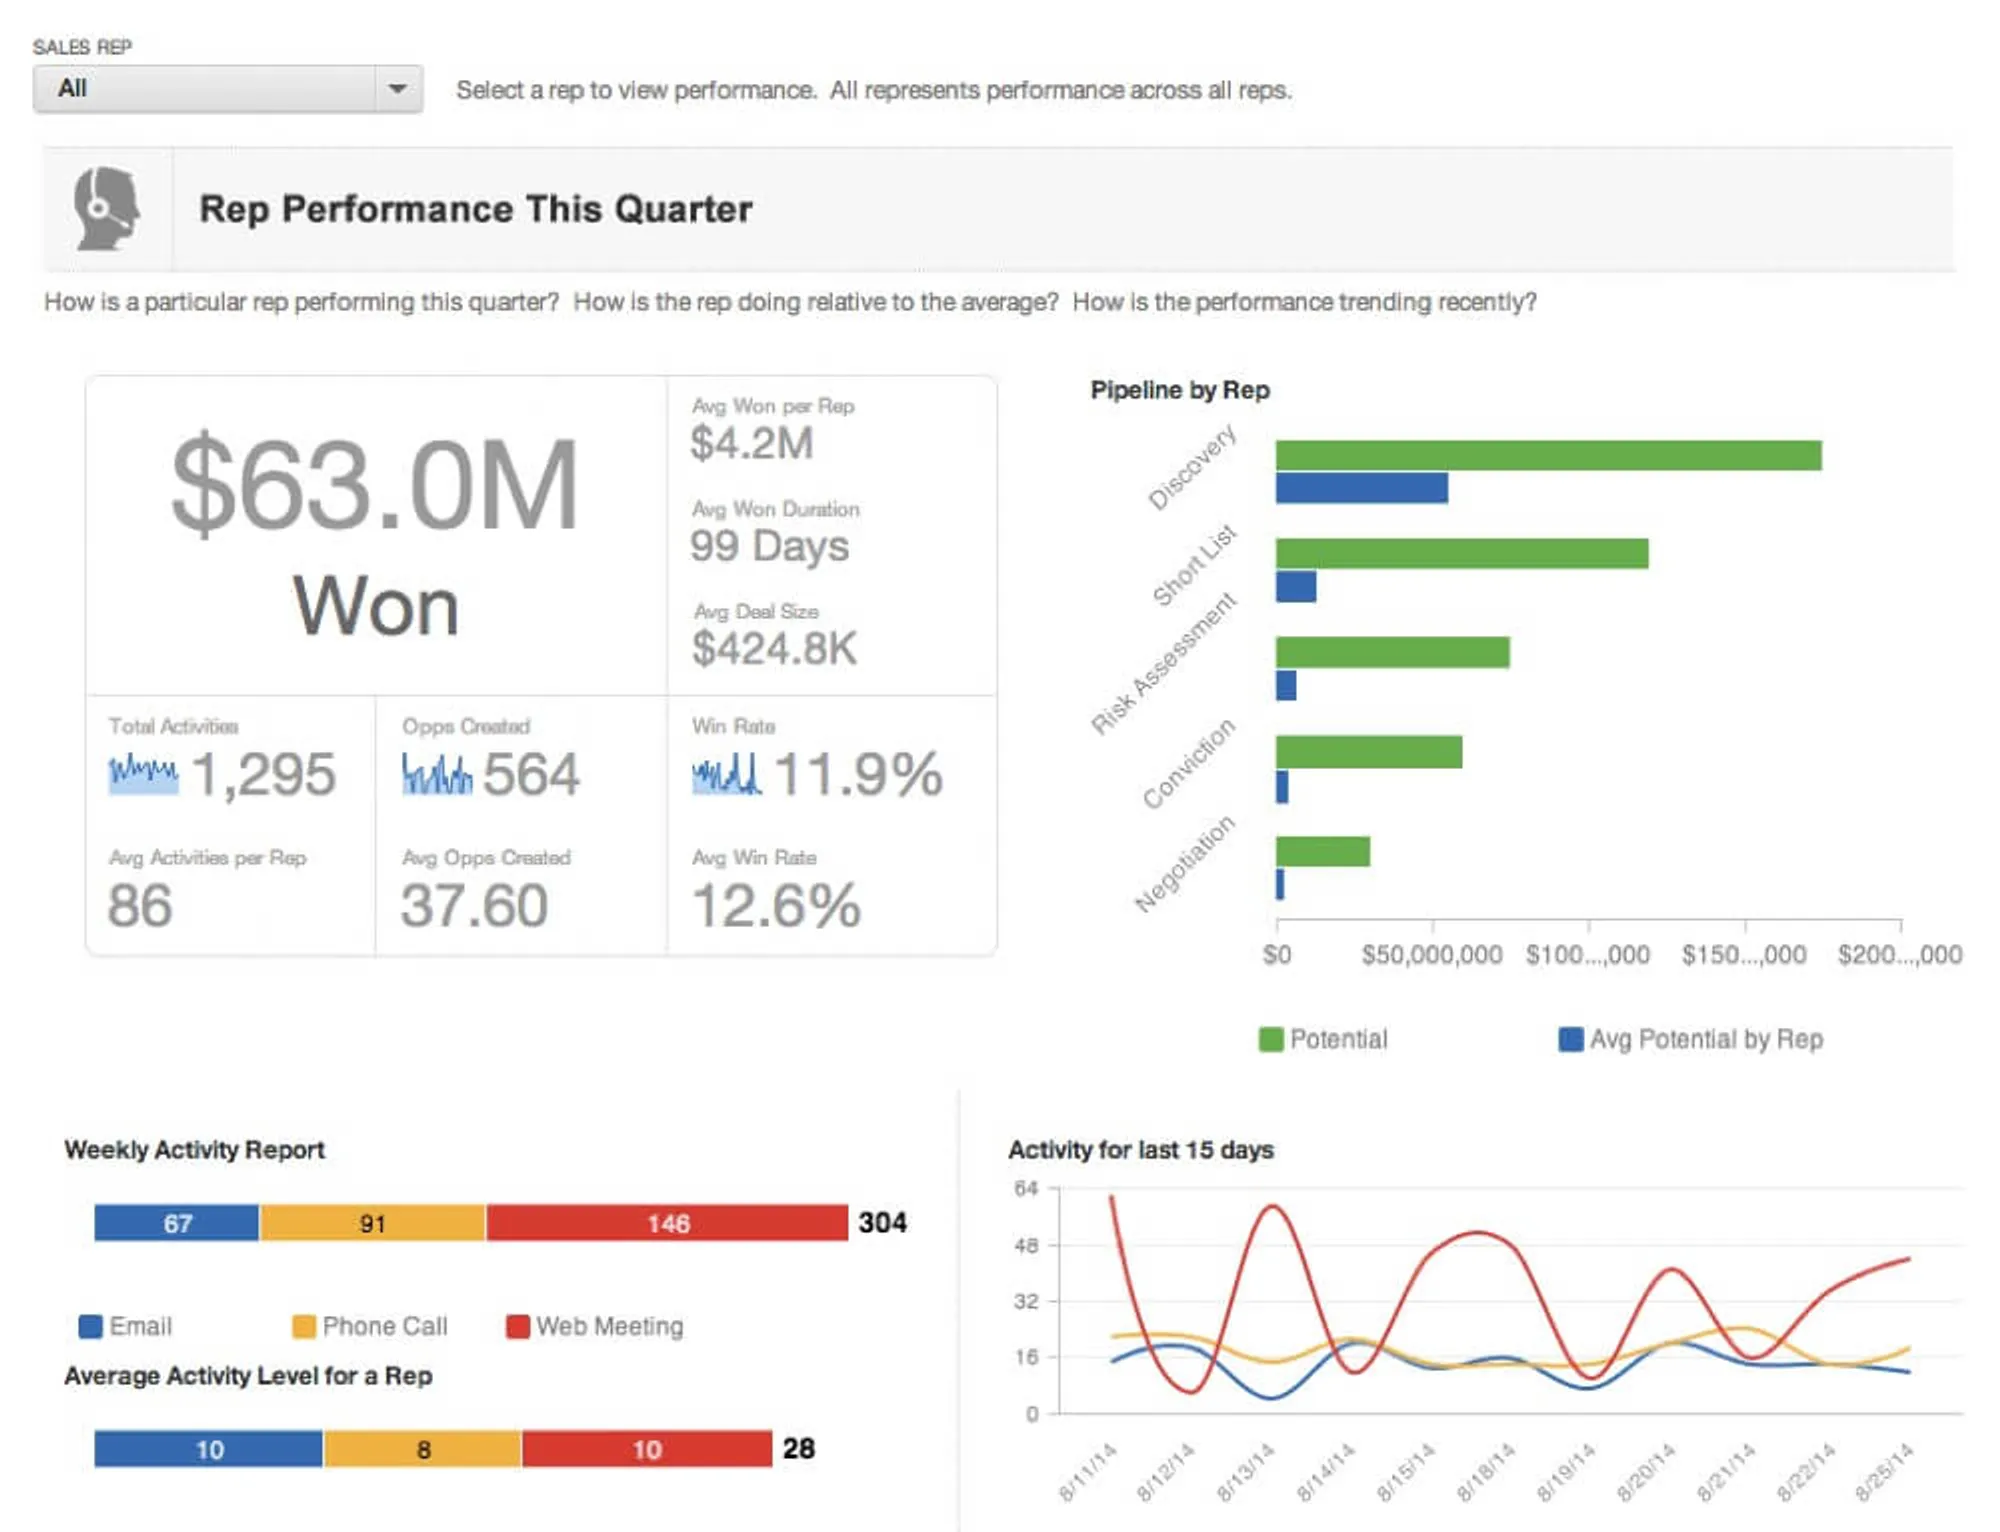
2) Use Headline Reports at the Top of a Dashboard
This is something that newspapers (remember those?) figured out a long time ago. Always place the important high-level important information in the first place that a user will look. This provides them with an easy and reliable way to understand the status of their KPI’s and make fast interpretations from their data.
3) Start with Broader Information and Allow Users to Explore
Sometimes users don’t have time to sift through all of their data. It may help to think of your main dashboard reports as the Cliff’s Notes version of that book that you never read in school; The main reports should focus on all of the major trends and key metrics but don’t have to contain a full breakdown of the information. A more granular view of the data can be achieved by providing drill-in reports or separate dashboard tabs. This will encourage users to explore the data in depth and to have an interactive experience with the analytics tool.
4) Promote Competition
Most people have experienced the powerful motivational force of competition. Comparative analytics and benchmarking in reporting can be used to achieve similar results. Showing users how their current performance stacks up to that from a previous time period is a great way to encourage personal growth and track professional development. If your business is quota driven, tracking employees relative to their peers will also help them achieve their individual goals. In the end, if your tool is central to a healthy and productive competitive environment, the adoption of the tool will increase and your business numbers will reflect this change.
5) Send Metric Driven Notifications to Users to Keep them Engaged
What would you do without your calendar? If you are like me, you rely on calendar reminders to guide your daily routine. What if your dashboards could offer this functionality to the end users? Well, it turns out that they can! You can accomplish this in many ways but two possible solutions are metric-driven notifications or regularly scheduled email reports. A metric-driven notification is used to alert your users when key numbers on a dashboard drop below a defined threshold. This is extremely useful to use with KPI’s. Another way to engage users is through regular email reports. This method is great for delivering content before a recurring meeting or as a way to promote regular consumption of reports. Often times it helps to nudge a user to return to the product to look at their dashboards in greater detail. Both of these techniques promote continued engagement and provide calls to action. This is an easy win and the best part is, it’s automated!
Want to see what GoodData can do for you?
Get a guided tour and ask us about GoodData’s features, implementation, and pricing.
Request a demoRead more

